Scalability Model for the LOFAR Direction Independent Pipeline
Pith reviewed 2026-05-25 14:22 UTC · model grok-4.3
The pith
A model built from scaling tests predicts LOFAR prefactor pipeline processing times for varying CPU counts, data sizes, and calibration models.
A machine-rendered reading of the paper's core claim, the machinery that carries it, and where it could break.
Core claim
We present these results as a comprehensive model which will be used to predict processing time for a wide range of processing parameters. We also discover that smaller calibration models lead to significantly faster calibration times, while the calibration results do not significantly degrade in quality. Finally, we validate the model and compare predictions with production runs from the past six months, quantifying the performance penalties incurred by processing on a shared cluster.
What carries the argument
The empirical model derived from measurements of pipeline completion time as a function of CPU number, data size, and calibration sky model size.
Load-bearing premise
The scaling relationships measured in controlled tests continue to hold for full-scale LoTSS production runs on a shared cluster once performance penalties from resource contention are accounted for.
What would settle it
Compare the model's predicted processing time for a new LoTSS data set against the actual time measured in a production run; a large discrepancy beyond the observed shared-cluster overhead would falsify the model.
Figures




read the original abstract
LOFAR is a leading aperture synthesis telescope operated in the Netherlands with stations across Europe. The LOFAR Two-meter Sky Survey (LoTSS) will produce more than 3000 14 TB data sets, mapping the entire northern sky at low frequencies. The data produced by this survey is important for understanding the formation and evolution of galaxies, supermassive black holes and other astronomical phenomena. All of the LoTSS data needs to be processed by the LOFAR Direction Independent (DI) pipeline, prefactor. Understanding the performance of this pipeline is important when trying to optimize the throughput for large projects, such as LoTSS and other deep surveys. Making a model of its completion time will enable us to predict the time taken to process large data sets, optimize our parameter choices, help schedule other LOFAR processing services, and predict processing time for future large radio telescopes. We tested the prefactor pipeline by scaling several parameters, notably number of CPUs, data size and size of calibration sky model. We present these results as a comprehensive model which will be used to predict processing time for a wide range of processing parameters. We also discover that smaller calibration models lead to significantly faster calibration times, while the calibration results do not significantly degrade in quality. Finally, we validate the model and compare predictions with production runs from the past six months, quantifying the performance penalties incurred by processing on a shared cluster. We conclude by noting the utility of the results and model for the LoTSS Survey, LOFAR as a whole and for other telescopes.
Editorial analysis
A structured set of objections, weighed in public.
Referee Report
Summary. The paper claims to derive an empirical scalability model for LOFAR's prefactor Direction Independent pipeline from controlled tests that vary CPU count, data volume, and calibration sky-model size. The model is presented as usable for predicting processing times across a wide parameter range for surveys such as LoTSS. A secondary claim is that smaller sky models yield significantly faster calibration with no significant quality degradation. The model is validated by comparing predictions to six months of actual production runs on a shared cluster, with quantification of contention penalties.
Significance. If the fitted scaling relationships prove robust and generalizable, the work would provide a practical tool for optimizing throughput and scheduling on LOFAR and similar future instruments. The inclusion of retrospective production validation supplies some independent grounding beyond the controlled tests, which is a methodological strength.
major comments (3)
- [Abstract / model sections] Abstract and model-construction sections: the manuscript asserts a 'comprehensive model' for predicting processing time but supplies neither the explicit functional forms (how CPU, data-size, and sky-model terms combine) nor the fitting procedure or coefficient values; without these the central predictive claim cannot be evaluated or reproduced.
- [Validation section] Production-validation section: the comparison with six months of LoTSS runs is retrospective and demonstrates consistency only for the observed load patterns; it does not test whether the functional forms remain predictive under different contention regimes or new parameter combinations, which is load-bearing for the claim that the model can be used for future production scheduling.
- [Calibration-quality results] Calibration-quality claim: the statement that smaller sky models do not significantly degrade results lacks reported quantitative metrics (e.g., residual statistics, source counts, or statistical tests) and therefore does not support the 'no significant degradation' assertion at the level required for the secondary claim.
minor comments (1)
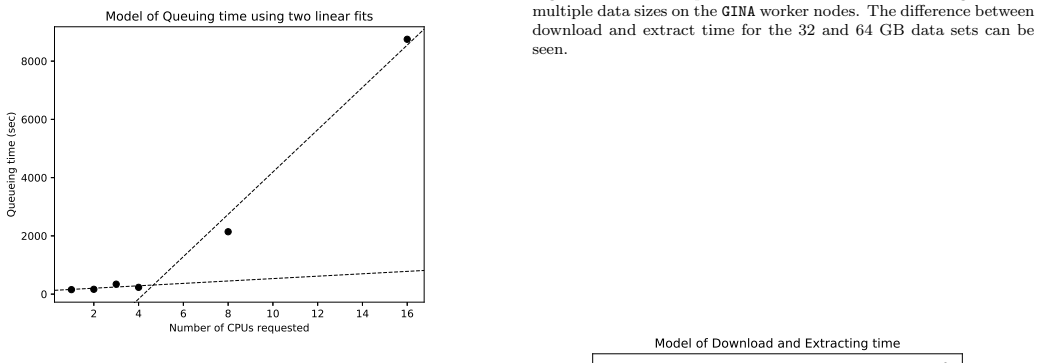
- [Figures] Figure captions and axis labels should explicitly state the range of parameters tested and the number of repeated runs per point to allow readers to assess statistical reliability.
Simulated Author's Rebuttal
We thank the referee for their constructive and detailed review. The comments identify important areas for improving clarity, reproducibility, and rigor. We respond to each major comment below and indicate the planned revisions.
read point-by-point responses
-
Referee: [Abstract / model sections] Abstract and model-construction sections: the manuscript asserts a 'comprehensive model' for predicting processing time but supplies neither the explicit functional forms (how CPU, data-size, and sky-model terms combine) nor the fitting procedure or coefficient values; without these the central predictive claim cannot be evaluated or reproduced.
Authors: We agree that the submitted manuscript did not include explicit functional forms, the fitting procedure, or coefficient values, even though scaling trends were shown via figures and text. This omission limits reproducibility of the central claim. In the revised manuscript we will add a dedicated subsection that states the combined functional form (time as a function of CPU count, data volume, and sky-model size), describes the fitting method applied to the controlled-test data, and reports the resulting coefficients. revision: yes
-
Referee: [Validation section] Production-validation section: the comparison with six months of LoTSS runs is retrospective and demonstrates consistency only for the observed load patterns; it does not test whether the functional forms remain predictive under different contention regimes or new parameter combinations, which is load-bearing for the claim that the model can be used for future production scheduling.
Authors: The validation is retrospective and reflects only the contention patterns present during the six-month LoTSS production period. We accept that this does not constitute a test of the functional forms under substantially different regimes or new parameter combinations. In revision we will expand the discussion to state these limitations explicitly and qualify the forward-looking claims about scheduling use, while retaining the value of the existing consistency check under observed conditions. revision: partial
-
Referee: [Calibration-quality results] Calibration-quality claim: the statement that smaller sky models do not significantly degrade results lacks reported quantitative metrics (e.g., residual statistics, source counts, or statistical tests) and therefore does not support the 'no significant degradation' assertion at the level required for the secondary claim.
Authors: The original text relied on qualitative assessment of calibration outputs. We agree that quantitative metrics are needed to support the claim at the required level. In the revised manuscript we will add comparisons of residual-image statistics (RMS noise) and source-detection counts across the tested sky-model sizes, together with any available statistical summary, to substantiate the assertion of no significant degradation. revision: yes
Circularity Check
No significant circularity; empirical model grounded in measurements and externally validated
full rationale
The paper constructs its scalability model directly from controlled experimental runs that measure completion time while varying CPU count, data volume, and calibration sky-model size. These measurements constitute independent input data. The resulting functional forms are then compared against six months of separate production-run logs on the shared cluster, providing an external benchmark that is not part of the fitting process. No equation or claim reduces by construction to a prior fit, self-citation, or renamed input; the validation step supplies falsifiable grounding outside the original test data. The derivation is therefore self-contained against external benchmarks.
Axiom & Free-Parameter Ledger
free parameters (1)
- model coefficients for CPU, data size, and sky model scaling
axioms (1)
- domain assumption Pipeline runtime scales predictably and continuously with the tested parameters across the full range needed for LoTSS.
Reference graph
Works this paper leans on
-
[1]
doi: https://doi.org/10.1016/j.future.2013.07
ISSN 0167-739X. doi: https://doi.org/10.1016/j.future.2013.07
-
[2]
URL https://doi.org/10.5281/zenodo.1487962. H. Intema, P. Jagannathan, K. Mooley, and D. Frail. The GMRT 150 MHz all-sky radio survey-first alternative data release TGSS ADR1. Astronomy & Astrophysics , 598:A78,
-
[3]
E. Jones, T. Oliphant, P. Peterson, et al. SciPy: Open source sci- entific tools for Python, 2001–. URL http://www.scipy.org/. [Online; accessed June 28, 2019]. S. Kavulya, J. Tan, R. Gandhi, and P. Narasimhan. An anal- ysis of traces from a production mapreduce cluster. In 2010 10th IEEE/ACM International Conference on Cluster, Cloud and Grid Computing , ...
work page 2001
-
[4]
doi: 10.1109/ CCGRID.2010.112. S. Kazemi, S. Yatawatta, S. Zaroubi, P. Lampropoulos, A. De Bruyn, L. Koopmans, and J. Noordam. Radio interferometric calibration using the sage algorithm. Monthly Notices of the Royal Astro- nomical Society, 414(2):1656–1666,
work page 2010
- [5]
-
[6]
A. Mechev, J. B. R. Oonk, A. Danezi, T. W. Shimwell, C. Schrijvers, H. Intema, A. Plaat, and H. J. A. Rottgering. An Automated Scalable Framework for Distributing Radio Astronomy Process- ing Across Clusters and Clouds. In Proceedings of the Interna- tional Symposium on Grids and Clouds (ISGC) 2017, held 5-10 March, 2017 at Academia Sinica, Taipei, Taiwan...
work page 2017
-
[7]
doi: 10.1093/mnras/stu1368. H. Sanjay and S. Vadhiyar. Performance modeling of parallel appli- cations for grid scheduling. Journal of Parallel and Distributed Computing, 68(8):1135 – 1145,
-
[8]
doi: https://doi.org/10.1016/j.jpdc.2008.02.006
ISSN 0743-7315. doi: https://doi.org/10.1016/j.jpdc.2008.02.006. URL http://www. sciencedirect.com/science/article/pii/S0743731508000464. T. Shimwell, H. R¨ ottgering, P. N. Best, W. Williams, T. Dijkema, F. De Gasperin, M. Hardcastle, G. Heald, D. Hoang, A. Horneffer, et al. The LOFAR Two-metre Sky Survey-I. Survey description and preliminary data release...
-
[9]
T. W. Shimwell, C. Tasse, M. J. Hardcastle, A. P. Mechev, W. L. Williams, P. N. Best, H. J. A. R¨ ottgering, J. R. Callingham, T. J. Dijkema, F. de Gasperin, D. N. Hoang, B. Hugo, M. Mirmont, J. B. R. Oonk, I. Prandoni, D. Rafferty, J. Sabater, O. Smirnov, R. J. van Weeren, G. J. White, M. Atemkeng, L. Bester, E. Bon- nassieux, M. Br¨ uggen, G. Brunetti, K...
work page internal anchor Pith review Pith/arXiv arXiv
-
[10]
J. Templon and J. Bot. The dutch national e-infrastructure. To ap- pear in Proceedings of Science edition of the International Sym- posium on Grids and Clouds (ISGC) 2016 13-18 March 2016, Academia Sinica, Taipei, Taiwan, Oct
work page 2016
-
[11]
URL https://doi. org/10.5281/zenodo.163537. G. van Diepen and T. J. Dijkema. DPPP: Default Pre-Processing Pipeline. Astrophysics Source Code Library, Apr
-
[12]
URL http://lofar.ie/wp-content/ uploads/2018/03/station_data_cookbook_v1.2.pdf. W. Williams, R. Van Weeren, H. R¨ ottgering, P. Best, T. Dijkema, F. de Gasperin, M. Hardcastle, G. Heald, I. Prandoni, J. Sabater, et al. LOFAR 150-MHz observations of the Bo¨ otes field: catalogue and source counts. Monthly Notices of the Royal Astronomical Society, 460(3):2385–2412,
work page 2018
-
[13]
C. Witt, M. Bux, W. Gusew, and U. Leser. Predictive performance modeling for distributed computing using black-box monitoring and machine learning. CoRR, abs/1805.11877,
work page internal anchor Pith review Pith/arXiv arXiv
-
[14]
doi: https://doi.org/ 10.1006/jpdc.1996.0151
ISSN 0743-7315. doi: https://doi.org/ 10.1006/jpdc.1996.0151. URL http://www.sciencedirect.com/ science/article/pii/S0743731596901513. L. T. Yang, X. Ma, and F. Mueller. Cross-platform performance prediction of parallel applications using partial execution. In Pro- 16 ceedings of the 2005 ACM/IEEE conference on Supercomputing , page
discussion (0)
Sign in with ORCID, Apple, or X to comment. Anyone can read and Pith papers without signing in.