REVIEW 2 major objections 7 minor 10 references
Object detection on aerial imagery using CenterNet
T0 review · 2 major / 7 minor · reviewed 2026-08-14 · deepseek-v4-flash
Pith's one-line read CenterNet, a keypoint-estimation detector that models each object as its bounding-box center, achieves 58.03 validation mAP on VisDrone2019 and places 7th on the image-detection track and 5th on the video-detection track.
desk verdict The paper's per-class APs don't average to its headline mAP, so the central numbers are internally inconsistent; still a plausible benchmark data point. read the letter →
The pith
A machine-rendered reading of the paper's core claim, the machinery that carries it, and where it could break.
The reading
What carries the argument
The load-bearing object is CenterNet's keypoint-estimation head: a fully convolutional network predicts a heatmap of object center locations and regresses the bounding-box size and a small offset for each center; no anchor boxes or region proposals are enumerated. The HourGlass-104 backbone provides repeated down- and up-sampling that preserves spatial detail for small objects. The inference setup—resizing to 2048x2048 and averaging predictions over scales 0.5, 0.75, 1, 1.25, 1.5 and a horizontal flip—is what carries the final numbers.
What would settle it
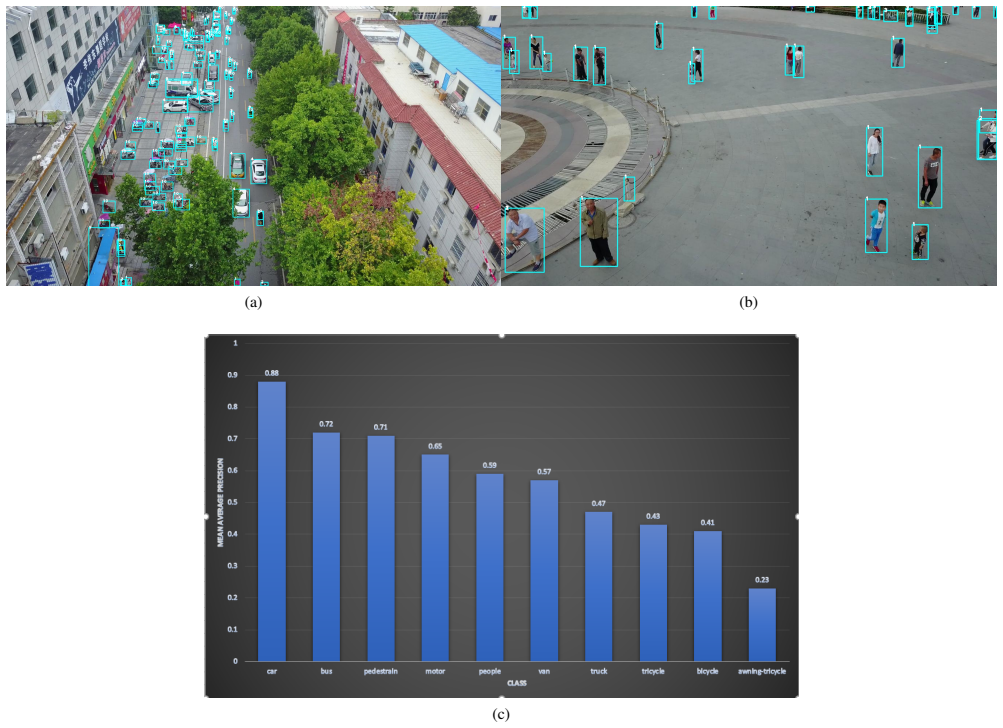
Compute the same training and inference pipeline on several held-out subsets of VisDrone2019 (for instance, the 528-image subset shown in the class-wise figure versus the 548-image table) and compare class-wise mAP; if the validation composition shifts the 58.03 result by more than the 1–2 points attributed to test-time augmentation, the reported gain is partly a property of the chosen sample rather than the method.
Extended reading notes
Core claim
The central claim is that modeling an object as a single point—its bounding-box center—is sufficient for competitive detection in aerial imagery, provided the input resolution is high enough and inference uses the right scales. The authors report that HourGlass-104 beats ResNet-18 and DLA-34 backbones, that horizontal flip adds about one percentage point, and that at 2048x2048 the scale range 0.5–1.5 outperforms 1–2, yielding 58.03 validation mAP. On the VisDrone2019 challenge test set the same model reaches 27.83 AP on images and 21.58 AP on videos, and it is the top entry at 500 detections per image on the image track.
Load-bearing premise
The headline validation number rests on the assumption that the particular set of validation images used to pick the 2048-pixel, 0.5–1.5 scale settings is representative of the hidden challenge test set; the paper lists 548 validation images in one place and 528 in another, and reports no error bars.
Editorial extensions
If this is right
- Keypoint-based detection is a viable alternative to anchor-based detectors for dense small-object scenes such as drone footage.
- Input resolution and scale range matter more than backbone choice for aerial images: resolution is what lets small objects survive feature extraction.
- Multi-scale test-time averaging plus horizontal flip is worth roughly 2–3 mAP points at 2048 resolution; removing the flip drops mAP by about one point.
- The same image-trained model transfers to video frames without fine-tuning and still ranks 5th, so temporal redundancy is not needed for a competitive video result.
Reading between the lines
- Taken together, the 512-vs-2048 results imply that effective object resolution, not raw input size, drives the gain; a tiling or cropping strategy on native-resolution imagery might capture most of the 58.03 result at lower memory cost.
- The paper does not ablate backbone capacity at 2048 input; if the resolution jump is the dominant factor, a smaller backbone at 2048 could approach HourGlass-104 performance much faster.
- For the video track, adding temporal linking or tube aggregation across frames could plausibly push the 21.58 video AP closer to the image-track 27.83, since the detector alone already transfers without retraining.
Signed reviews
Editorial analysis
A structured set of objections, weighed in public.
Referee Report
Summary. The paper evaluates CenterNet, a keypoint-based single-stage detector, on the VisDrone2019 aerial object detection benchmark. It compares three backbones (ResNet-18, DLA-34, Hourglass-104) at 512x512 input and reports validation mAP, then studies test-time augmentation (horizontal flip) and multi-scale inference at different input resolutions. Based on these experiments, the authors select a 2048x2048 input with scales 0.5-1.5 and horizontal flip, and report 58.03 mAP on the validation set. On the challenge test set, they report 7th place on Track 1 with overall mAP 27.83 and 5th place on Track 2 with mAP 21.58, using the same model without fine-tuning. The paper concludes that CenterNet is competitive for small-object detection in aerial imagery.
Significance. If the reported leaderboard results are accurate, this paper provides useful empirical evidence that CenterNet, originally designed for general object detection, can rank competitively on a challenging aerial benchmark with dense small objects. The external evaluation by the challenge organizers is a strength, as it reduces concerns about self-reported test-set numbers. However, the internal inconsistency between the class-wise APs in Table 6 and the overall APs in Tables 4/5, together with the conflicting validation set sizes in Table 1 and Fig. 2, substantially undermine confidence in the reported quantitative claims. No code or detailed evaluation protocol is provided, which limits reproducibility. The scientific value is therefore contingent on correcting and verifying the reported numbers.
major comments (2)
- [§4.5, Tables 4, 5, and 6] The class-wise APs in Table 6 do not average to the overall APs reported for the same runs. Averaging the ten Track 1 values (31.05, 12.99, 9.08, 51.92, 38.33, 31.14, 24.24, 21.06, 40.94, 20.35) gives 28.11, not 27.83 as reported in Table 4; averaging the ten Track 2 values (27.86, 6.59, 12.47, 33.92, 29.91, 40.55, 13.99, 12.91, 24.48, 6.98) gives 20.97, not 21.58 as reported in Table 5. The discrepancies are in opposite directions, so a single systematic explanation (e.g., maxDets or ignore-region handling) cannot reconcile them. Since Tables 4 and 5 are the paper's headline quantitative claims, at least one set of numbers is incorrect or computed under a different metric than stated. Please provide the exact evaluation protocol and correct the tables accordingly.
- [§3.2.1, Table 1, Fig. 2] The size of the validation set is reported as 548 images in Table 1 and §4.2 but as 528 images in the caption of Fig. 2. This discrepancy affects the reproducibility of the validation mAP numbers in Tables 1-3, which in turn motivate the choice of input resolution, scale range, and flip augmentation used for the leaderboard submission. Please state the exact number of validation images used in each experiment and explain the source of the difference.
minor comments (7)
- [§3.1] The sentence "We use the VisDrone2019 DET dataset for object detection in videos" appears to be a typo; the DET benchmark is for image detection, while the VID dataset is for video detection. Please correct.
- [§4.2] The sentence "The performance of the evaluated on a variety of data-set" is grammatically incomplete and should be revised.
- [Tables 4 and 5] The captions state that red entries denote the best performance, but the tables are printed in black in the PDF. Please add color or otherwise indicate the best entries in the text.
- [§4.4] The claim that scaling beyond 2048 (e.g., to 4096) does not improve performance is not supported by any reported experiment in Table 3. Please include the result or qualify the statement as an observation from unreported experiments.
- [§4.3, Table 2] The gain from horizontal flip is described as "1 %" in the text; please clarify whether this is an absolute or relative improvement (the table shows 31.97 to 32.99).
- [§4.4] The paper does not describe how multi-scale predictions and the flipped predictions are fused (e.g., NMS across scales or averaging of heatmaps). Please add a sentence describing the inference post-processing.
- [§4.2, Table 1] The comparison to YOLOv3 uses a different input resolution (416x416 for YOLOv3 vs 512x512 for CenterNet), which confounds the claimed advantage over YOLOv3. Please report YOLOv3 at 512x512 or explicitly state that the comparison is not controlled for input resolution.
Circularity Check
No significant circularity: the paper reports empirical benchmark results against the external VisDrone2019 challenge and contains no derivation chain that reduces to its own inputs.
full rationale
This paper is an empirical evaluation, not a derivation or prediction from fitted first principles. The central claims are measured mAP values on the VisDrone2019 challenge data, reported in Tables 4 and 5, and class-wise AP values in Table 6. These numbers are obtained by running CenterNet with a fixed backbone and inference settings on an externally provided benchmark, so there is no fitted parameter that is renamed as a prediction and no quantity that is defined in terms of another claimed output. The choice of input resolution, multi-scale testing ranges, and horizontal flip is tuned on validation data, but that is standard model selection practice and does not make the test-set or leaderboard results circular. The paper cites prior work for CenterNet and standard detectors, but none of those citations is load-bearing in a way that makes the reported empirical results equivalent to an input. The reader's noted internal inconsistency between the class-wise AP averages and the stated overall mAP values is a potential correctness or reporting issue, not a circularity issue, because the overall mAP is not defined as the arithmetic mean of the listed class APs and no derivation is being made. Consequently, no circular step can be exhibited, and the appropriate score is 0.
Assumptions & free parameters
free parameters (4)
- Backbone network =
Hourglass-104
- Inference input resolution =
2048x2048
- Multi-scale range =
0.5, 0.75, 1, 1.25, 1.5
- Horizontal flip test-time augmentation =
Enabled; +1.02 mAP at 512, +1.15 at 2048
assumptions (4)
- domain assumption VisDrone2019 ground-truth annotations are accurate and the official evaluation metric is used as reported.
- domain assumption COCO-pretrained CenterNet weights transfer to aerial imagery after fine-tuning on VisDrone.
- domain assumption The validation set, listed as 548 or 528 images, is representative of the hidden challenge test set.
- domain assumption The model was trained on the official VisDrone training split and not on the validation or test splits.
Cite this review
Pith. "Pith review of Object detection on aerial imagery using CenterNet." pith.science (2026). https://pith.science/paper/35C7SXTO
@misc{pith2026190808244,
  author       = {Pith},
  title        = {Pith review of: Object detection on aerial imagery using CenterNet},
  year         = {2026},
  howpublished = {\url{https://pith.science/paper/35C7SXTO}},
  note         = {Machine review of arXiv:1908.08244}
}
read the original abstract
Detection and classification of objects in aerial imagery have several applications like urban planning, crop surveillance, and traffic surveillance. However, due to the lower resolution of the objects and the effect of noise in aerial images, extracting distinguishing features for the objects is a challenge. We evaluate CenterNet, a state of the art method for real-time 2D object detection, on the VisDrone2019 dataset. We evaluate the performance of the model with different backbone networks in conjunction with varying resolutions during training and testing.
Figures

Reference graph
Works this paper leans on
-
[1]
write newline
" write newline "" before.all 'output.state := FUNCTION fin.entry add.period write newline FUNCTION new.block output.state before.all = 'skip after.block 'output.state := if FUNCTION new.sentence output.state after.block = 'skip output.state before.all = 'skip after.sentence 'output.state := if if FUNCTION not #0 #1 if FUNCTION and 'skip pop #0 if FUNCTIO...
-
[2]
J. Deng, W. Dong, R. Socher, L.-J. Li, K. Li, and L. Fei-Fei. Imagenet: A large-scale hierarchical image database. In 2009 IEEE conference on computer vision and pattern recognition , pages 248--255. Ieee, 2009
work page 2009
- [3]
-
[4]
D. P. Kingma and J. Ba. Adam: A method for stochastic optimization. arXiv preprint arXiv:1412.6980 , 2014
arXiv 2014
-
[5]
T.-Y. Lin, P. Goyal, R. Girshick, K. He, and P. Doll \'a r. Focal loss for dense object detection. In Proceedings of the IEEE international conference on computer vision , pages 2980--2988, 2017
work page 2017
-
[6]
T.-Y. Lin, M. Maire, S. Belongie, J. Hays, P. Perona, D. Ramanan, P. Doll \'a r, and C. L. Zitnick. Microsoft coco: Common objects in context. In European conference on computer vision , pages 740--755. Springer, 2014
work page 2014
-
[7]
W. Liu, D. Anguelov, D. Erhan, C. Szegedy, S. Reed, C.-Y. Fu, and A. C. Berg. Ssd: Single shot multibox detector. In European conference on computer vision , pages 21--37. Springer, 2016
work page 2016
-
[8]
J. Redmon and A. Farhadi. Yolov3: An incremental improvement. arXiv preprint arXiv:1804.02767 , 2018
arXiv 2018
Show all 10 references
-
[9]
S. Ren, K. He, R. Girshick, and J. Sun. Faster r-cnn: Towards real-time object detection with region proposal networks. In Advances in neural information processing systems , pages 91--99, 2015
2015
-
[10]
a henb \
X. Zhou, D. Wang, and P. Kr \"a henb \"u hl. Objects as points. In arXiv preprint arXiv:1904.07850 , 2019
1904 arXiv
Reviewed August 14, 2026 · model on record in the stance chip above.
Discussion (0). Continue with ORCID to comment.