REVIEW 3 major objections 4 minor 11 references
Spectroscopic study of argon electroluminescence light with a wavelength-sensitive particle detector
T0 review · 3 major / 4 minor · reviewed 2026-08-04 · deepseek-v4-flash
Pith's one-line read This paper shows that argon electroluminescence is not a single 128 nm line but includes a fast, longer-wavelength component at about 10% of the VUV yield.
desk verdict A useful first look at argon EL beyond 128 nm, with the fast UV3 component solid but the 10% ratio still hostage to unmeasured spectral corrections. read the letter →
The pith
A machine-rendered reading of the paper's core claim, the machinery that carries it, and where it could break.
The reading
What carries the argument
The quantitative core is the convolution identity U_UV2(t) = A [U_UV3 ⊗ I_UV2](t − Δt), where I_UV2 is the excimer response function containing singlet/triplet fractions and formation/decay time constants. This identity converts the measured fast UV3 waveform into a prediction for the slow VUV waveform, and its success is the main evidence that UV3 tracks the electron drift while UV2 is shaped by excimer kinetics. The experimental machinery is the pair of PMT channels—CsI photocathode sensitive to [110,160] nm (UV2) and bialkali photocathode sensitive to [160,650] nm (UV3)—read simultaneously through MgF₂ windows, allowing the two spectral bands to be compared event by event.
What would settle it
A direct spectral measurement of the 160–650 nm EL band that, after weighting by the actual PMT response, gave a photon fraction well below 10% of the VUV yield, or a measurement showing that the UV3 pulses are not synchronized with the calculated electron transit time across the EL gap, would falsify the paper's central claim.
Extended reading notes
Core claim
The central discovery is that argon electroluminescence is spectrally composite: in addition to the dominant second-continuum VUV emission at ~128 nm, a prompt emission in the 160–650 nm band contributes a UV3/UV2 photon-yield ratio of 9.8 ± 2.9% at 1 bar and 10.0 ± 3.0% at 3 bar for the EL-correlated component, with a larger 20.0 ± 6.1% when the full 3-bar UV3 waveform is integrated. The UV3 signal develops almost simultaneously with electron transit through the EL region, while UV2 is delayed by excimer formation and dominated by triplet decay. The paper demonstrates that the UV2 waveform is quantitatively reproduced by convolving the UV3 waveform with the excimer response of Eq. (2), esta
Load-bearing premise
The reported UV3/UV2 ratio is obtained by correcting a broadband (160–650 nm) signal using quantum efficiencies and window transmissions quoted at single reference wavelengths, so if the true UV3 spectrum differs substantially from the assumed reference shape, the measured 10% ratio would shift.
Editorial extensions
If this is right
- Argon EL-TPC optical models must treat the emission as multi-component; a ~10% longer-wavelength contribution changes photon transport and detection-efficiency estimates.
- A UV3-sensitive channel provides a less time-smeared signal for the passage of electrons through the EL gap, which can improve longitudinal charge reconstruction and separate overlapping S2 pulses.
- Wavelength-resolved readout can separate primary scintillation (S1) from electroluminescence (S2) when they overlap in time, because the two processes have different spectral and temporal signatures.
- At 3 bar, the full UV3 integral is ~20% of UV2, but the EL-correlated component remains ~10%; the extra early component is not yet assigned to a mechanism and needs dedicated study.
Reading between the lines
- Editorial inference: if the UV3 channel indeed tracks electron transit with nanosecond precision, dual-phase TPCs could gain z-position resolution by reading EL light with a UV3-sensitive photodetector rather than integrating all wavelengths; this is a testable prediction.
- Editorial inference: the ~10% ratio may depend on reduced electric field and gas purity; measuring UV3/UV2 versus E/P would test whether the fast component scales with the EL yield or arises from a separate excitation channel.
- Editorial inference: the unexplained early UV3 component at 3 bar, if real rather than instrumental, could contaminate S2 signals near the cathode in large detectors with distorted edge fields; a larger chamber with uniform fields would discriminate.
- Editorial inference: if the UV3/UV2 ratio differs between alpha and beta ionization, as the authors' earlier scintillation work suggests, the EL spectral ratio could become a particle-discrimination tag rather than only a timing channel.
Editorial analysis
A structured set of objections, weighed in public.
Referee Report
Summary. The paper reports a wavelength- and time-resolved study of argon electroluminescence in a small TPC using two PMT types: UV2 (CsI photocathode, nominal 110–160 nm) and UV3 (bialkali photocathode, nominal 160–650 nm). After subtracting drift-field-only waveforms from both-fields-on waveforms and applying a geometric/topological event selection, the authors measure at 1 bar a UV3/UV2 photon-yield ratio of 9.8 ± 2.9%, and at 3 bar a ratio of 20.0 ± 6.1% for the full UV3 waveform, reducing to 10.0 ± 3.0% when only the second Gaussian component is used. They also show that the 1-bar UV2 pulse shape can be reproduced by convolving the measured UV3 waveform with an excimer formation/decay response (Eqs. 1–2). The central claim is that argon EL is not quasi-monochromatic at 128 nm and contains a significant, fast, longer-wavelength component that tracks electron transit through the EL gap.
Significance. If the quantitative result is robust, it challenges the standard assumption of quasi-monochromatic 128-nm argon EL and has direct consequences for optical models, S2 timing, and pile-up reconstruction in argon TPCs. The paper's strengths are the clean differential BF-minus-DF measurement, the explicit event selection, the simultaneous UV2/UV3 readout, and the honest caveats about the unknown early component at 3 bar. The 1-bar convolution demonstration is a useful phenomenological consistency check. However, the headline UV3/UV2 ratio depends on spectral corrections that are not adequately quantified, and the 3-bar temporal validation is partly self-referential. The qualitative existence and fast-timing nature of the UV3 EL component are much more robust than the exact 10% value.
major comments (3)
- [Sec. IV and Table II] The UV3/UV2 ratio is computed by dividing integrated photoelectrons and correcting with single-reference-wavelength quantum efficiencies (0.15 at 128 nm for UV2, 0.18 at 200 nm for UV3) and MgF2 window transmission values (approx. 33% at 128 nm and 95% above 180 nm). Because the UV3 response covers 160–650 nm and no EL spectrum or filter scan is shown, this correction is only valid if QE×T is constant over the emitted band, which is not the case for a bialkali photocathode and a window with an 180-nm cutoff. The correct conversion is R = (N3/N2) × [∫ε2(λ)S2(λ)dλ] / [∫ε3(λ)S3(λ)dλ], and the paper does not provide a sensitivity estimate over plausible UV3 spectral shapes. The quoted ±2.9% and ±3.0% are therefore statistical/fit uncertainties, not the dominant systematic. I request a sensitivity study or dedicated spectral characterization before the quantitative claim can be considered est
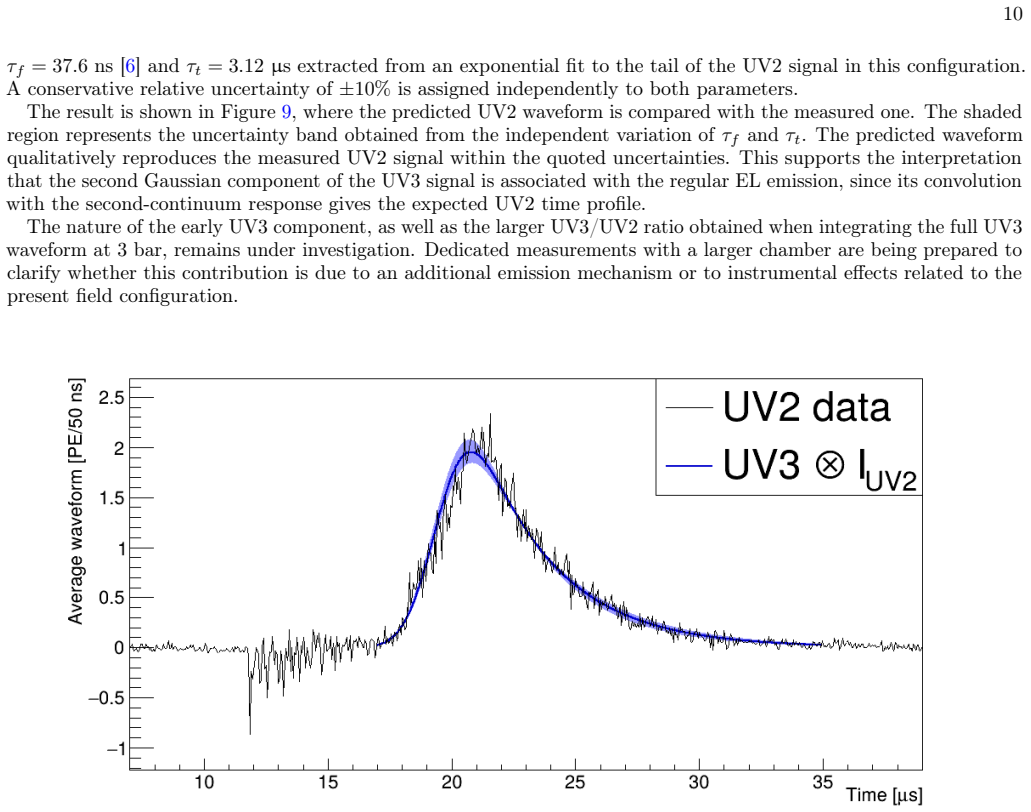
- [Sec. V, Fig. 9, Eq. (2)] At 3 bar, the triplet decay time τt = 3.12 μs is extracted from an exponential fit to the tail of the measured UV2 waveform, and this same waveform is then used to validate the convolution prediction built from the second Gaussian component of UV3. Thus the tail region of the predicted UV2 is partly self-referential; the independent content is the reproduction of the rise and peak. The two-Gaussian decomposition is explicitly phenomenological, with the first component's origin 'under investigation', so the 10.0 ± 3.0% value depends on the choice of decomposition as well as on the QE/window issue. Please either use a independently fixed τt (e.g., from a separate scintillation measurement) or fit the UV2 waveform with all parameters free and show the resulting uncertainties and residuals, including variation of the Gaussian-decomposition range.
- [Sec. IV, Eqs. (1)–(2)] The 1-bar convolution fit is presented as strong support for the interpretation that UV3 drives UV2, but no fit parameters, parameter uncertainties, or goodness-of-fit statistics are reported. The model has at least f_s, f_t, τs, τt, τf, A, and Δt as free or effectively free quantities, so degeneracies are expected. This does not invalidate the paper's central claim, but the current presentation does not allow the reader to assess the stability of the fit or the uniqueness of the f_s ≈ 0 result. A parameter table and residual plot would make the claim quantitative.
minor comments (4)
- [Sec. III, Eq. (3)] The asymmetry parameter is printed as 'AUV i' with broken subscript formatting; please ensure all subscripts render correctly.
- [Sec. II] The values 'P < 5 × 10⁻⁴ mbar' and '9×10⁻⁵ mbar' should include units consistently and a brief explanation of how pressure is measured in the PMT enclosures.
- [Sec. IV, Table II] The 3-bar row lists '20.0±6.1%' and '(10.0±3.0%)' without a note that the second value uses only the second Gaussian component; add a table footnotes to avoid confusion.
- [Sec. V] The uncertainty of ±10% assigned to τf and τt is called 'conservative' but no basis is given; please justify or reduce it.
Circularity Check
Main UV3/UV2 ratio is an independent measurement; the 3-bar temporal 'prediction' is partly self-referential because τt is extracted from the very UV2 waveform it is used to predict.
-
fitted input called prediction
[Section V, 'Preliminary study of the electroluminescence signal at 3 bar' (around Fig. 9)]
"The values of τf and τt are fixed independently, with τf = 37.6 ns [6] and τt = 3.12 µs extracted from an exponential fit to the tail of the UV2 signal in this configuration. ... The result is shown in Figure 9, where the predicted UV2 waveform is compared with the measured one."
The 'predicted' UV2 waveform is constructed by convolving the second UV3 Gaussian component with an excimer response whose long decay time τt is obtained by fitting the tail of the same UV2 waveform being predicted. An exponential tail of any convolved input is controlled by the exponential decay constant; fixing τt from that tail guarantees the predicted waveform will reproduce the measured tail by construction. Thus the agreement in Fig. 9 is not an independent validation of the temporal model, although the early part of the waveform still depends on the Gaussian shape and τf from the authors' prior work [6].
full rationale
The paper's headline quantitative claim — a UV3/UV2 photon-yield ratio of about 10% (9.8±2.9% at 1 bar; 10.0±3.0% for the selected 3-bar component) — is a direct integrated-photoelectron measurement corrected by quoted QE and window-transmission values. It does not reduce to a fit or to a self-citation chain, so the central claim has independent experimental grounding. The 1-bar convolution exercise is a fit to the UV2 waveform using the measured UV3 signal as input; it is not presented as a prediction and thus is not circular in the strict sense, though it is a consistency test rather than a standalone proof. The 3-bar comparison, however, is explicitly called a 'predicted UV2 waveform' while one of its key parameters, τt, is fitted from the tail of the same UV2 signal; that step is partly self-referential. The single-wavelength QE/transmission correction for the broadband UV3 signal is a legitimate systematic-uncertainty concern, but it is a calibration issue, not circularity. No uniqueness theorem is imported, and the authors' self-citation for τf and QE values is not load-bearing for the main ratio because the ratio is measured with their own PMTs and could be recomputed with other calibration data. Overall, one partial reduction in a supporting temporal argument; the central measured result stands independent.
Assumptions & free parameters
free parameters (6)
- f_s, f_t (singlet/triplet fractions) =
f_s compatible with zero; f_t ~ 1
- tau_f (excimer formation time) =
37.6 ns fixed from [6] at 3 bar; fitted at 1 bar
- tau_t (triplet decay time) =
3.12 us at 3 bar
- tau_s (singlet decay time) =
not quoted numerically
- A and dt (amplitude and time offset, Eq. 1) =
not quoted
- 3-bar UV3 Gaussian decomposition =
two Gaussians, parameters not tabulated
assumptions (5)
- domain assumption UV2 emission is the radiative decay of argon excimers to the dissociative ground state, with singlet/triplet channels and a formation time (Eq. 2)
- domain assumption The UV3 signal is prompt and proportional to the instantaneous electron flux in the EL region, so it can serve as the source function in the convolution (Eq. 1)
- domain assumption The two PMT channels cleanly separate the spectral regions below and above 160 nm
- domain assumption The drift and EL transit times (7.9 us and 1.2 us) from the MATLAB field solver and Nakamura-Kurachi drift velocities are accurate enough to anchor the timing interpretation
- standard math Convolution and superposition: the UV2 signal is a linear, time-invariant response to the UV3 source
Cite this review
Pith. "Pith review of Spectroscopic study of argon electroluminescence light with a wavelength-sensitive particle detector." pith.science (2026). https://pith.science/paper/3FMDAPML
@misc{pith2026260801842,
  author       = {Pith},
  title        = {Pith review of: Spectroscopic study of argon electroluminescence light with a wavelength-sensitive particle detector},
  year         = {2026},
  howpublished = {\url{https://pith.science/paper/3FMDAPML}},
  note         = {Machine review of arXiv:2608.01842}
}
read the original abstract
We present a spectroscopic study of argon electroluminescence (EL) light in a gaseous time projection chamber (TPC). Using a compact detector equipped with photomultiplier tubes with different spectral sensitivities, we measure the light emission in two nominal wavelength regions, approximately [110, 160] nm and [160, 650] nm, at different gas pressures. In addition to the well-known 128 nm emission of the second continuum, significant emission is observed in the [160, 650] nm band, with a prompt, nanosecond-scale response indicating that photon production closely follows the transit of drifting electrons across the high-field EL region. In contrast, the [110, 160] nm emission displays a markedly slower time evolution, dominated by excimer formation and de-excitation dynamics, with the light output governed primarily by the long-lived triplet component of the argon second continuum emission. We demonstrate that the full VUV pulse shape can be reproduced by convolving the fast UV3 response with excimer formation and decay functions, providing a coherent phenomenological interpretation of the observed signals. Our results provide new insights into the spectral and temporal properties of argon electroluminescence and have direct implications for the design and optimization of next-generation rare-event detectors based on gaseous TPCs. Further studies are underway to characterize this emission more precisely and to investigate its potential for particle discrimination.
Figures


Figures from the paper (6 more)


Reference graph
Works this paper leans on
-
[1]
and Sanchez Garcia, E
Santorelli, R. and Sanchez Garcia, E. and Abia, P. Garcia and Gonz\'alez-D\'. Spectroscopic analysis of the gaseous argon scintillation with a wavelength sensitive particle detector , journal =. 2021 , doi =
2021
-
[2]
and S\'anchez Garc\'
Leardini, S. and S\'anchez Garc\'. Time and band-resolved scintillation in time projection chambers based on gaseous xenon , journal =. 2022 , doi =
2022
-
[3]
and others , collaboration =
Calvo, J. and others , collaboration =. Backgrounds and pulse shape discrimination in the ArDM liquid argon TPC , journal =. 2018 , doi =
2018
-
[4]
and others , collaboration =
Agnes, P. and others , collaboration =. Low-Mass Dark Matter Search with the DarkSide-50 Experiment , journal =. 2018 , doi =
2018
-
[5]
Aalseth, C. E. and others , collaboration =. DarkSide-20k: A 20 tonne two-phase LAr TPC for direct dark matter detection at LNGS , journal =. 2018 , doi =
2018
-
[6]
First Indication of Solar
Aprile, Elena and others , collaboration =. First Indication of Solar. Phys. Rev. Lett. , volume =. 2024 , doi =
2024
-
[7]
and others , collaboration =
Acerbi, F. and others , collaboration =. DarkSide-20k sensitivity to light dark matter particles , journal =. 2024 , doi =
2024
-
[8]
and others , collaboration =
Agnes, P. and others , collaboration =. Constraints on Sub-GeV Dark-Matter--Electron Scattering from the DarkSide-50 Experiment , journal =. 2018 , doi =
2018
Show all 11 references
-
[9]
and Kurachi, M
Nakamura, Y. and Kurachi, M. , title =. J. Phys. D: Appl. Phys. , volume =. 1988 , doi =
1988
-
[10]
Amsler, Claude and Boccone, V. and B. Luminescence quenching of the triplet excimer state by air traces in gaseous argon , journal =. 2008 , doi =
2008
-
[11]
Monteiro, C. M. B. and Lopes, J. A. M. and Veloso, J. F. C. A. and dos Santos, J. M. F. , title =. Physics Letters B , volume =. 2008 , doi =
2008
Reviewed August 4, 2026 · model on record in the stance chip above.
Discussion (0). Continue with ORCID to comment.