REVIEW 4 major objections 5 minor 27 references
Hermitian matrices for clustering directed graphs: insights and applications
T0 review · 4 major / 5 minor · reviewed 2026-08-14 · deepseek-v4-flash
Pith's one-line read Direction-only clusters yield to a complex adjacency matrix.
desk verdict Hermitian clustering is promising and the theorem is likely fixable, but the printed proof has a sqrt(n) scale error that must be addressed. read the letter →
The pith
A machine-rendered reading of the paper's core claim, the machinery that carries it, and where it could break.
The reading
What carries the argument
The load-bearing object is the Hermitian adjacency matrix $A$, defined by $A_{uv}=\mathrm{i}$ when $u\to v$ and $A_{vu}=-\mathrm{i}$; because it is Hermitian, its eigenvalues are real even though it encodes directed edges through $\mathrm{i}$. The second ingredient is the meta-graph matrix $F$ and its derived matrix $\tilde F=(2F-\mathbf{1}_{k\times k})\mathrm{i}$; $\tilde F$ has a $\theta$-distinguishing image when the projection rows for different clusters are at least $\theta$ apart, and its spectral gap $\tilde\rho$ measures how far its nonzero eigenvalues are from zero. The argument uses concentration of $A$ around its expectation, a bound on how much the projection onto leading eigenspaces shifts under this perturbation, and a $k$-means cost argument showing that well-separated rows force most vertices to be assigned to the correct cluster.
What would settle it
Take a DSBM with $p=q$, a cyclic meta-graph with $k=5$, $n=1000$, $\eta=0.2$, and $p$ above the theorem's lower bound; if the number of misclassified vertices does not match $O(k^4\log n/((1-2\eta)^2p))$ over many trials, or if on the migration data the recovered clusters correlate only with geography and not with any county economic indicators, the central claims would be in doubt.
Extended reading notes
Core claim
The central discovery is that the direction-only cluster structure of a digraph is carried by the low-rank meta-graph matrix $F$, and that this structure is visible in the top eigenspaces of the Hermitian matrix $A=(M-M^{\top})\mathrm{i}$. For a graph from the DSBM with $p=q$, the expected matrix $\mathbb{E}A$ is block-constant on clusters, and Algorithm 1's projection $P$ is close to the ideal projection $P_{\mathrm{Im}(\tilde F)}\otimes \tfrac{1}{n}\mathbf{1}_{n\times n}$. Because $\tilde F=(2F-\mathbf{1}_{k\times k})\mathrm{i}$ has a $\theta$-distinguishing image, rows of the ideal projection belonging to different clusters are separated by at least $\theta$; perturbation control then leaves a separation of $\theta/2$ in the computed embedding, and $k$-means misclassifies only the stated number of vertices. The same logic makes $A$ implicitly weight pairs of vertices by their common parents and offspring while penalizing mismatched directional relations, which is why the method surfaces asymmetric flow between clusters rather than internally dense communities.
Load-bearing premise
The guarantee assumes every cluster has the same size, every vertex has the same expected degree, and all cluster information lives in edge directions ($p=q$), so real digraphs with heterogeneous degrees or cluster sizes do not directly inherit the theorem.
Editorial extensions
If this is right
- Clusters that are invisible to degrees, because every vertex has the same expected in- and out-degree, become recoverable through the Hermitian eigenspace.
- In the cyclic block model, the misclassification bound is $O(k^4\log n/((1-2\eta)^2p))$ once $p=\omega(k^3\log n/((1-2\eta)^2n))$, giving concrete parameter thresholds for guaranteed recovery.
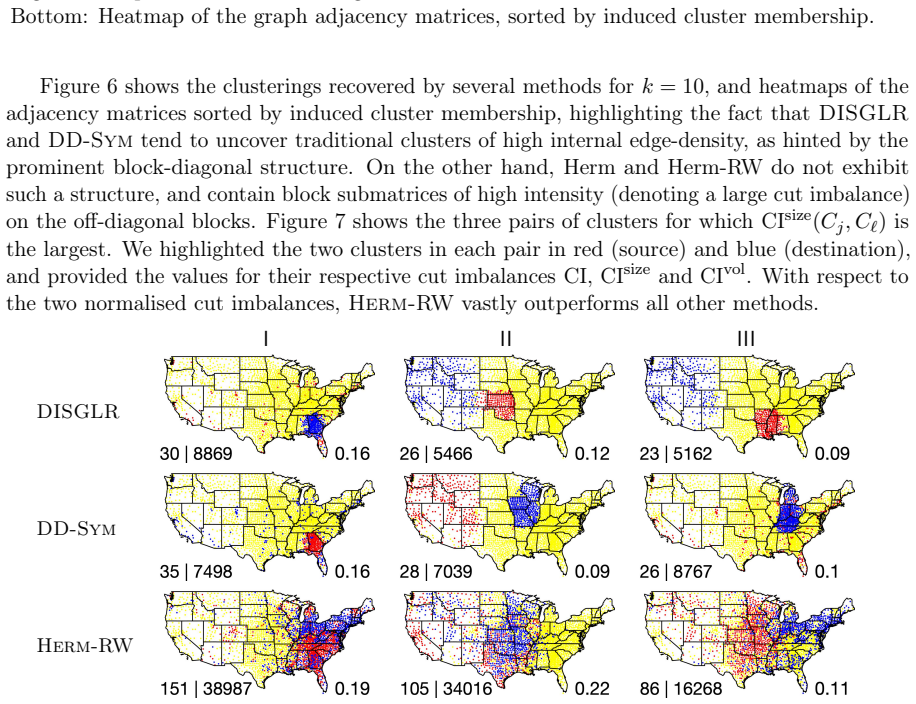
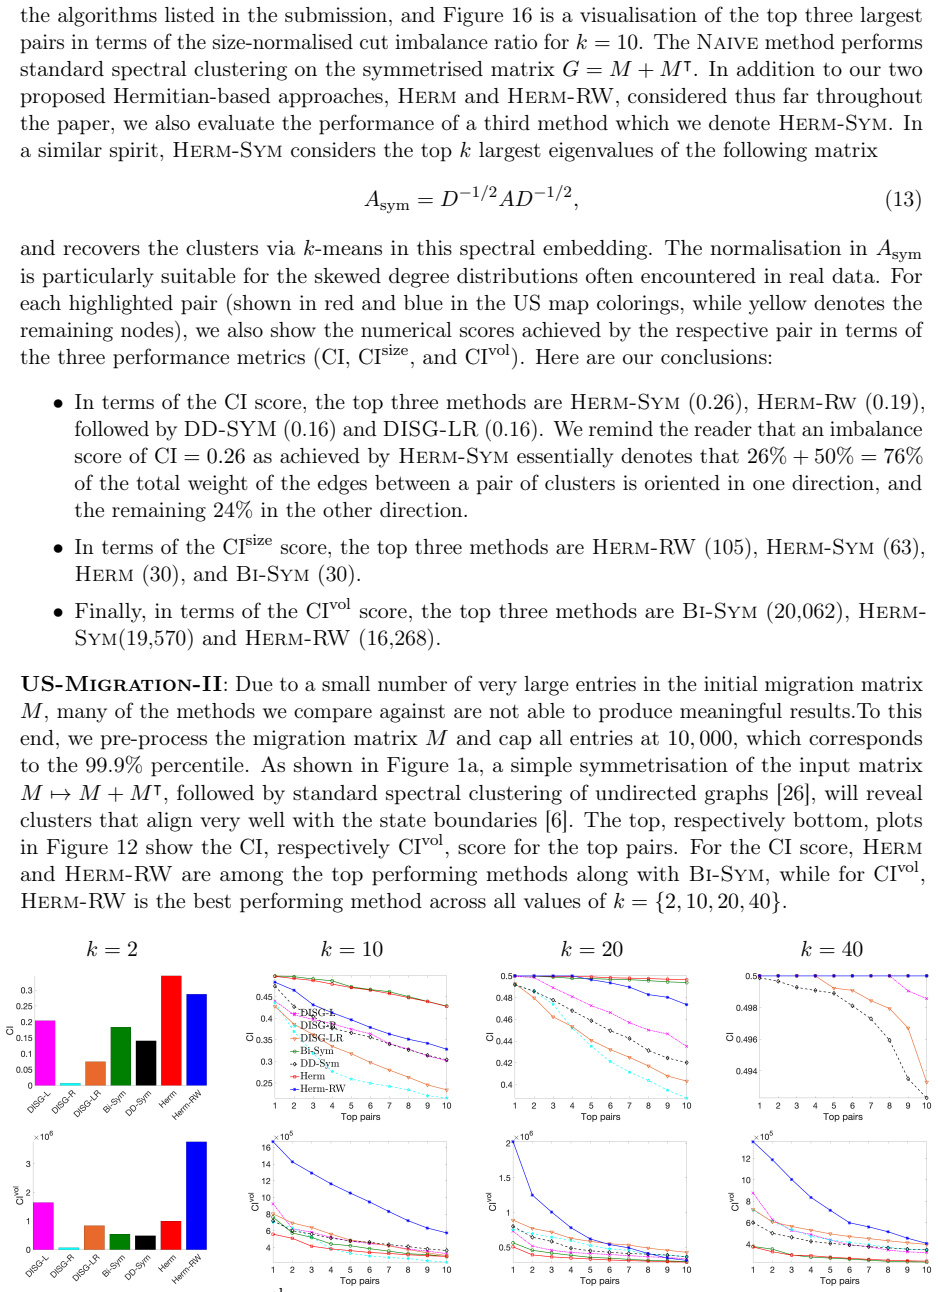
- The cut-imbalance ratio $\mathrm{CI}(X,Y)$ gives a quantitative, direction-aware objective for pairs of clusters, so the method can name which pairs exchange asymmetric flow.
- On migration networks the clusters trace flows from rural to urbanized areas, so the same pipeline can be applied to other origin-destination flow data to expose asymmetric exchange.
- Using $A$ avoids forming $M^{\top}M+MM^{\top}$, so directional information is captured without expensive matrix multiplications.
Reading between the lines
- A natural extension is to prove a normalized version of Theorem 2 for $A_{\mathrm{rw}}=D^{-1}A$; the experiments suggest it works better on skewed data, but the paper's guarantee only covers the unnormalized setting.
- The $\theta$-distinguishing-image condition could be checked in practice by estimating the eigenvalues of $\tilde F$ from the outliers of the empirical spectrum, giving a data-driven way to choose the number of clusters $k$.
- Because the core object is the skew-symmetric part of a weighted matrix, the same approach could apply to pairwise comparison and tournament data where cycles of dominance, not density, define the structure.
- The socio-economic interpretation of the US migration clusters is an inference from the recovered partition; a direct validation would regress cluster membership on county income and urbanization covariates.
Signed reviews
Editorial analysis
A structured set of objections, weighed in public.
Referee Report
Summary. This paper proposes a spectral clustering algorithm for directed graphs based on a complex-valued Hermitian adjacency matrix whose off-diagonal entries are ±i according to edge direction. The algorithm computes the projection onto the eigenspace of the eigenvalues with absolute value above a threshold and applies k-means to the rows of this projection. The authors introduce a directed stochastic block model (DSBM) in which cluster structure is encoded primarily in edge orientations through a matrix F, and they prove a misclassification bound for the algorithm under a spectral gap condition when p=q (Theorem 2). The paper also reports experiments on synthetic DSBM graphs and on US migration and political blog networks, arguing that the Hermitian method uncovers cut-imbalance structures that symmetrized spectral methods miss. An appendix contains the proof of Theorem 2 and additional experiments.
Significance. If the proof is corrected, the paper makes a useful contribution: it gives a spectral method that targets orientation-based cluster structure rather than density-based structure, and it provides a model in which this signal is theoretically identifiable. The explicit DSBM, the use of concentration and Davis-Kahan perturbation arguments, and the breadth of the experimental comparison are strengths. A correct recovery guarantee for a directed clustering algorithm with a non-symmetric objective would be a real advance. However, the proof as printed contains two compensating scaling errors, and the real-data evaluation is built on a score aligned with the method's own objective, so the empirical conclusions need additional support before the claims can be accepted.
major comments (4)
- [Appendix A.1, proof of Theorem 2, Eqs. (10) and (11)] The proof of Theorem 2 misstates the scale of the row separation of Q. Since Q = (1/n) U P_{Im(\tilde F)} U^T, the Euclidean distance between the rows of Q for vertices in clusters j and l is ||P_{Im(\tilde F)}(j,·) - P_{Im(\tilde F)}(l,·)|| / sqrt(n) = theta / sqrt(n), not theta as claimed in the text before Eq. (10). Consequently Eq. (10) overestimates the separation by a factor sqrt(n). Eq. (11) then upper-bounds the k-means cost by ||P-Q||^2 · kn, whereas the correct rank-based bound is ||P-Q||_F^2 ≤ 2k ||P-Q||^2, which is smaller by a factor n. These two errors compensate: replacing both by their correct values preserves the stated O(k^2 log n / (\tilde\rho^2 \theta^2 p)) bound. The proof therefore needs to be rewritten with the correct scales; as printed it does not establish the theorem.
- [Section 3 and Appendix A.1, Lemma 7] The parameter epsilon is defined inconsistently. Section 3 states epsilon = 10 sqrt(pn log(pn)), while Lemma 7 and the proof of Theorem 2 use epsilon = 20 sqrt(pkn log n). Since Lemma 6 gives ||A - EA|| ≤ 10 sqrt(pkn log n), the Davis-Kahan argument in Lemma 7 requires epsilon to exceed this noise level. The main-text value does not match the analysis and also depends on pn rather than pkn. The authors should use a single consistent definition and state explicitly which threshold is used in Algorithm 1 and in the theorem.
- [Section 5, Eqs. (6)-(8)] The real-data comparison is circular. The cut-imbalance scores CI, CIsize, and CIvol measure precisely the type of directed imbalance that the Hermitian method is designed to expose and that the DSBM encodes. Comparing against algorithms that optimize symmetrized density-based objectives on this metric is favorable to the proposed method by construction. The socio-economic interpretation in the abstract and Section 1 is not supported by quantitative external data; no county-level economic variables are used to validate the claim that recovered clusters share similar socio-economic profiles. For the BLOG network, party labels are available and the paper could report external accuracy (e.g., ARI or NMI against Conservative/Liberal labels) rather than relying only on the method-specific score.
- [Section 4, Theorem 2, and Section 5] The theoretical guarantee in Theorem 2 assumes p=q and equal cluster sizes, but all real-world networks considered in Section 5 violate these assumptions (e.g., the US migration network has heterogeneous edge densities and cluster sizes). The paper should explicitly acknowledge this gap between the theory and the real-data experiments, and ideally add a robustness study, such as DSBM simulations with p≠q or with unbalanced cluster sizes, to indicate whether the method's performance degrades gracefully outside the theorem's regime.
minor comments (5)
- [Appendix A.1, proof of Theorem 2] The same symbol c_j is used both for a row of Q and for the mean of the rows of P restricted to cluster C_j. Please use distinct notation (for example, q_j and μ_j) to avoid confusion.
- [Section 2, example] The text refers to Figure 2 for the cyclic flow structure, but the figure is not visible in the manuscript version provided. Please verify that the figure is included in the compiled PDF.
- [Eq. (4) and surrounding text] The matrix A_rw = D^{-1} A is not itself Hermitian; the statement that it 'has N real eigenvalues' should be phrased as 'is similar to a Hermitian matrix and therefore has real eigenvalues and a complete set of eigenvectors.'
- [Section 5, Figure 4] The text states that Figure 4 reports the ARI of 'a randomly generated graph,' while Figures 3 and 11 report averages over 10 runs. Please clarify whether Figure 4 is a single instance or an average, and if it is a single instance, add error bars or a note on variability.
- [Section 3, Algorithm 1] In Algorithm 1, the threshold epsilon is an input parameter, but the subsequent paragraph recommends a specific value. Please state explicitly whether the theoretical guarantees require the specific value or hold for any epsilon above the noise bound.
Circularity Check
No circularity found: the DSBM guarantee is derived from an external model and independent perturbation bounds; self-citations are contextual, not load-bearing.
full rationale
Theorem 2 is derived from the DSBM G(k,n,p,q,F) with p=q: the expectation EA = p U \tilde F U^T, the projection Q = P_{Im(EA)}, the concentration bound ||A-EA|| <= 10 sqrt(pkn log n) (Lemma 6), and the Davis-Kahan bound (Lemma 7) are all proven in-paper or drawn from external standard results, with no fitted parameter. The assumption of a theta-distinguishing image and spectral gap (5) is a stated identifiability condition, not an input re-derived as output; the misclassification bound follows from perturbation analysis. No prediction in the paper is the result of fitting a parameter to the quantity being predicted. The real-data CI/CIsize/CIvol scores are evaluation metrics defined after clustering; although they are aligned with the directed-imbalance structure the Hermitian method targets, the paper does not claim these scores were derived from the model, and choosing a metric aligned with the method is not a circular derivation. Self-citations ([5],[6],[7]) concern ranking and synchronization background and state-boundary observations; they are not the load-bearing justification for Theorem 2. The Appendix A.1 proof of Theorem 2 appears to state that rows of Q corresponding to different clusters are at least theta apart, while under the paper's own expression Q = P_{Im(EA)} and EA = p U \tilde F U^T with U^T U = nI, the row distance is theta/sqrt(n); this is a possible scaling/rigor error in the proof, but it is a correctness concern, not a circularity, because the theorem is not assumed in its own proof. Therefore no pattern in the enumerated circularity taxonomy is exhibited.
Assumptions & free parameters
free parameters (2)
- Eigenvector threshold epsilon =
10 sqrt(pn log pn) in Section 3; 20 sqrt(pkn log n) in Lemma 7
- Number of eigenvectors l =
rank(F) theoretically; k in practice
assumptions (3)
- domain assumption Graphs are generated from the DSBM (k,n,p,q,F) with p=q
- standard math k-means achieves a constant approximation ratio
- standard math Davis-Kahan theorem and matrix concentration inequality (Theorem 5 from [4])
Cite this review
Pith. "Pith review of Hermitian matrices for clustering directed graphs: insights and applications." pith.science (2026). https://pith.science/paper/3GKFAOCE
@misc{pith2026190802096,
  author       = {Pith},
  title        = {Pith review of: Hermitian matrices for clustering directed graphs: insights and applications},
  year         = {2026},
  howpublished = {\url{https://pith.science/paper/3GKFAOCE}},
  note         = {Machine review of arXiv:1908.02096}
}
read the original abstract
Graph clustering is a basic technique in machine learning, and has widespread applications in different domains. While spectral techniques have been successfully applied for clustering undirected graphs, the performance of spectral clustering algorithms for directed graphs (digraphs) is not in general satisfactory: these algorithms usually require symmetrising the matrix representing a digraph, and typical objective functions for undirected graph clustering do not capture cluster-structures in which the information given by the direction of the edges is crucial. To overcome these downsides, we propose a spectral clustering algorithm based on a complex-valued matrix representation of digraphs. We analyse its theoretical performance on a Stochastic Block Model for digraphs in which the cluster-structure is given not only by variations in edge densities, but also by the direction of the edges. The significance of our work is highlighted on a data set pertaining to internal migration in the United States: while previous spectral clustering algorithms for digraphs can only reveal that people are more likely to move between counties that are geographically close, our approach is able to cluster together counties with a similar socio-economical profile even when they are geographically distant, and illustrates how people tend to move from rural to more urbanised areas.
Figures


Figures from the paper (12 more)






Reference graph
Works this paper leans on
-
[1]
The political blogosphere and the 2004 US election: divided they blog
Lada A Adamic and Natalie Glance. The political blogosphere and the 2004 US election: divided they blog. InProceedings of the 3rd international workshop on Link discovery, pages 36–43, 2005
work page 2004
-
[2]
k-means++: the advantages of careful seeding
David Arthur and Sergei Vassilvitskii. k-means++: the advantages of careful seeding. In Proceedings of the Eighteenth Annual ACM-SIAM Symposium on Discrete Algorithms, SODA 2007, pages 1027–1035, 2007
work page 2007
-
[3]
U. S. Census Bureau, 2002. www.census.gov/population/www.cen2000/ctytoctyflow/ index.html
work page 2002
-
[4]
On the spectra of general random graphs.Electronic Journal of Combinatorics, 18(1), 2011
Fan Chung and Mary Radcliffe. On the spectra of general random graphs.Electronic Journal of Combinatorics, 18(1), 2011
work page 2011
- [5]
-
[6]
M. Cucuringu, V. Blondel, and P. Van Dooren. Extracting spatial information from networks with low order eigenvectors.Physical Review E, 87, 2013
work page 2013
-
[7]
M. Cucuringu, Y. Lipman, and A. Singer. Sensor network localization by eigenvector synchronization over the Euclidean group.ACM Transactions on Sensor Networks, 8(3):19:1– 19:42, 2012
work page 2012
-
[8]
C. Davis and W. M. Kahan. The rotation of eigenvectors by a perturbation. III.SIAM Journal on Numerical Analysis, 7:1–46, 1970
work page 1970
Show all 27 references
-
[9]
Internal migration: detailed estimates by origin and destination local authorities, age and sex, 2018
Office for National Statistics. Internal migration: detailed estimates by origin and destination local authorities, age and sex, 2018
2018
-
[10]
Gates and Yong-Yeol Ahn
Alexander J. Gates and Yong-Yeol Ahn. The impact of random models on clustering similarity. Journal of Machine Learning Research, 18(87):1–28, 2017
2017
-
[11]
Hermitian adjacency matrix of digraphs and mixed graphs
Krystal Guo and Bojan Mohar. Hermitian adjacency matrix of digraphs and mixed graphs. Journal of Graph Theory, 85(1):217–248, 2017
2017
-
[12]
Stochasticblockmodels: first steps.Social Networks, 5(2):109–137, 1983
PaulW.Holland, KathrynBlackmondLaskey, andSamuelLeinhardt. Stochasticblockmodels: first steps.Social Networks, 5(2):109–137, 1983. 10
1983
-
[13]
A simple linear time (1+ε)-approximation algorithm fork-means clustering in any dimensions
Amit Kumar, Yogish Sabharwal, and Sandeep Sen. A simple linear time (1+ε)-approximation algorithm fork-means clustering in any dimensions. InProceedings of the 45th Symposium on Foundations of Computer Science, pages 454–462, 2004
2004
-
[14]
Lee, Shayan Oveis Gharan, and Luca Trevisan
James R. Lee, Shayan Oveis Gharan, and Luca Trevisan. Multiway spectral partitioning and higher-order Cheeger inequalities.Journal of the ACM, 61(6), 2014
2014
-
[15]
Consistency of spectral clustering in stochastic block models
Jing Lei and Alessandro Rinaldo. Consistency of spectral clustering in stochastic block models. The Annals of Statistics, 43(1):215–237, 2015
2015
-
[16]
SNAP Datasets: Stanford large network dataset collection
Jure Leskovec and Andrej Krevl. SNAP Datasets: Stanford large network dataset collection. http://snap.stanford.edu/data, June 2014
2014
-
[17]
Malliaros and Michalis Vazirgiannis
Fragkiskos D. Malliaros and Michalis Vazirgiannis. Clustering and community detection in directed networks: A survey.Physics Reports, 533(4):95–142, 2013
2013
-
[18]
Iterative ranking from pair-wise comparisons
Sahand Negahban, Sewoong Oh, and Devavrat Shah. Iterative ranking from pair-wise comparisons. In Advances in Neural Information Processing Systems 25, pages 2474–2482, 2012
2012
-
[19]
A. Y. Ng, M. I. Jordan, and Y. Weiss. On spectral clustering: Analysis and an algorithm. In Advances in Neural Information Processing Systems, pages 849–856, 2001
2001
-
[20]
M. J. Perry. State-to-State Migration Flows: 1995 to 2000.Census 2000 Special Reports, 2003
1995
-
[21]
W.M. Rand. Objective criteria for the evaluation of clustering methods.Journal of the American Statistical Association, 66(336):846–850, 1971
1971
-
[22]
Co-clustering directed graphs to discover asymmetries and directional communities.Proceedings of the National Academy of Sciences, 113(45):12679– 12684, 2016
Karl Rohe, Tai Qin, and Bin Yu. Co-clustering directed graphs to discover asymmetries and directional communities.Proceedings of the National Academy of Sciences, 113(45):12679– 12684, 2016
2016
-
[23]
Symmetrizations for clustering directed graphs
Venu Satuluri and Srinivasan Parthasarathy. Symmetrizations for clustering directed graphs. In Proceedings of the 14th International Conference on Extending Database Technology, pages 343–354, 2011
2011
-
[24]
Shi and J
J. Shi and J. Malik. Normalized cuts and image segmentation.IEEE Transactions on Pattern Analysis and Machine Intelligence, 22(8):888–905, 2000
2000
-
[25]
Singer and H
A. Singer and H. T. Wu. Vector diffusion maps and the connection Laplacian.Communica- tions on Pure and Applied Mathematics, 2012
2012
-
[26]
A tutorial on spectral clustering.Statistics and Computing, 17(4):395– 416, 2007
Ulrike von Luxburg. A tutorial on spectral clustering.Statistics and Computing, 17(4):395– 416, 2007
2007
-
[27]
White, E
J.G. White, E. Southgate, J. N. Thomson, and S. Brenner. The structure of the nervous system of the nematode c. elegans.Philosophical transactions Royal Society London, 314:1– 340, 1986. 11 A Appendix In this appendix, we present a more detailed analysis of our algorithm and i...
1986
Reviewed August 14, 2026 · model on record in the stance chip above.
Discussion (0). Continue with ORCID to comment.