REVIEW 3 major objections 6 minor 45 references
Look a Group at Once: Multi-Slide Modeling for Survival Prediction
T0 review · 3 major / 6 minor · reviewed 2026-08-12 · deepseek-v4-flash
Pith's one-line read Modeling a group of six whole-slide images as one sample improves cancer survival prediction, with a reported mean concordance index of 0.737 across five TCGA datasets.
desk verdict Promising group-level modeling idea with an honest discussion, but the 'significantly outperforms' claim is not supported by the statistics, and the under-specified grouping protocol could leak across cross-validation folds. read the letter →
The pith
A machine-rendered reading of the paper's core claim, the machinery that carries it, and where it could break.
The reading
What carries the argument
The central object is GPAMamba, a block that combines graph convolutions with a position-and-attention scanning layer (PAMamba) built on Mamba, a linear-time state-space sequence model. In each block, every slide is a fixed graph whose nodes are patches and edges connect nearby patches; graph-convolution layers exchange local information. PAMamba then flattens the group's patches into one long sequence and scans it twice, once in spatial order and once reordered by learned prognostic-attention weights, before merging the two aligned scans. The sequence is split back into per-slide graphs and convolved again, an intra-inter-intra alternation. After graph pooling, a second Mamba module scans the ordered slide representations, and a dual-head predictor maps them to a risk score and an interval survival-probability vector. This machinery is what lets one slide's representation borrow evidence from other slides in the group.
What would settle it
A re-run of the five-fold evaluations in which every group is built from slides belonging to a single fold, and no patient's slides appear in both a training and a validation group, would settle the claim: if the mean C-index falls back to the one-slide baseline, the reported 0.737 is inflated by cross-split leakage rather than produced by cross-slide modeling.
Extended reading notes
Core claim
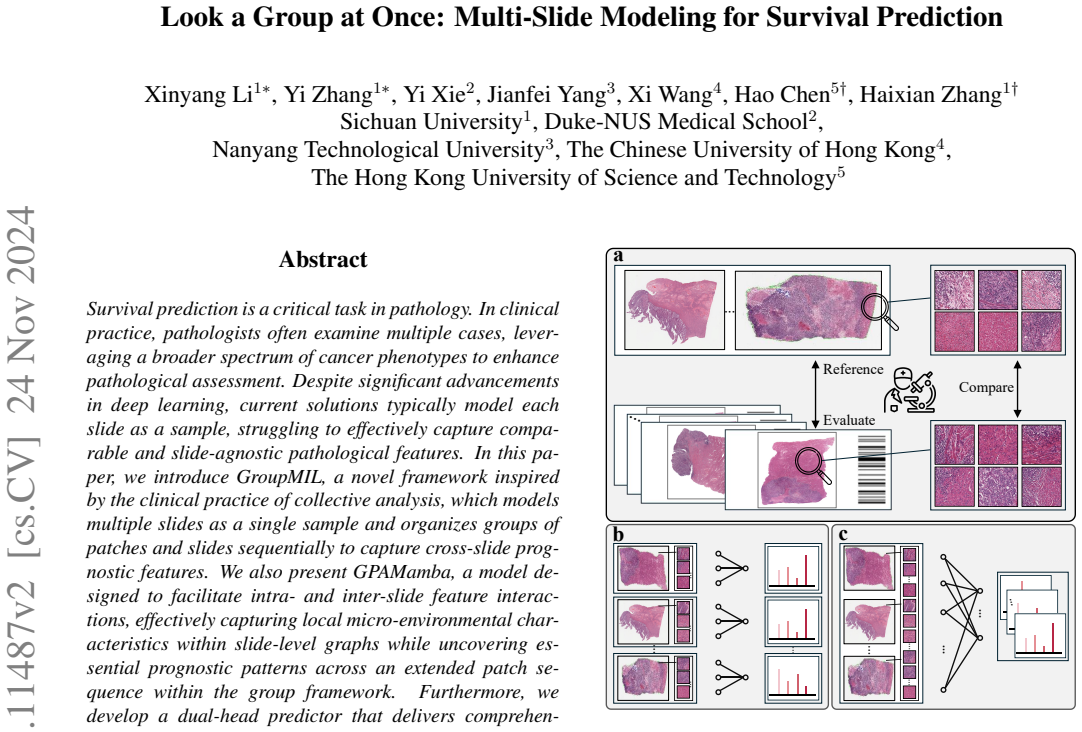
The paper's central claim is that survival prediction improves when a model reads several whole-slide images together. It argues that existing one-slide-at-a-time pipelines cannot capture slide-agnostic phenotypes, whereas a group exposes comparable prognostic features across patients. GroupMIL forms a group of six same-cancer slides, treats it as one sample, and runs GPAMamba, which alternates graph convolutions over each slide's patch graph with two long-sequence scans of the concatenated patches; the resulting slide representations are scanned again to add cross-slide context. The dual-head predictor then combines a risk score with discretized survival probabilities into a single composite risk. The paper reports a mean concordance index (C-index), a standard rank-agreement metric for survival predictions, of 0.737 over five TCGA datasets, compared with 0.710 for MambaMIL, and interprets the gain as evidence that collective analysis works.
Load-bearing premise
The central assumption is that forming random six-slide groups from the same cancer type, across training and validation, is a clean experiment rather than a leaky one; the paper does not state that groups are confined within folds or that a patient's slides never appear in both training and validation groups.
Editorial extensions
If this is right
- Survival models can stop treating slides as isolated samples; each patient's risk can be informed by comparable slides from other patients with the same cancer.
- Combining a risk head with a discrete-time survival-probability head yields a composite risk score that the paper reports stratifies patients significantly on all five datasets.
- Attention orderings in the model highlight tumor and necrotic patches over normal stroma and muscle, giving pathologists a visual check consistent with their own assessment.
- Because the Mamba-based long-sequence module is reported to beat a comparable Transformer with lower FLOPs and memory, group-scale patch sequences remain computationally feasible.
- The group-size ablation shows stable performance for groups of 4, 6, or 8 slides, so the framework is not tightly tuned to exactly six slides.
Reading between the lines
- Group modeling behaves like a transferable wrapper: the paper's batch-versus-group comparison shows several tested baselines improve when their slides are grouped, so the collective-analysis mechanism is not tied only to GPAMamba's specific internals.
- Group composition is currently random and within one cancer type; grouping by age, stage, or molecular subtype is a natural next experiment, and the authors explicitly flag it as future work.
- A deployment caution follows from the paper's silence on whether groups respect fold boundaries: any practitioner adopting group modeling should construct groups within patient-level splits to keep validation honest.
Signed reviews
Editorial analysis
A structured set of objections, weighed in public.
Referee Report
Summary. The manuscript proposes GroupMIL, a survival prediction framework that departs from single-slide processing by modeling a group of whole-slide images as a single sample. The method introduces PAMamba for long patch-sequence modeling, GPAMamba for alternating intra-slide graph convolution and inter-slide sequence scanning, and a dual-head predictor combining Cox and discrete-time losses. Experiments on five TCGA cancer datasets report mean C-index values around 0.737, outperforming ten baseline methods, with additional ablation studies, attention visualizations, and Kaplan-Meier stratification analyses. The central claim is that GroupMIL significantly outperforms state-of-the-art approaches.
Significance. If the reported results hold under a rigorously controlled protocol, the group-based modeling idea is a meaningful conceptual contribution to computational pathology: it is clinically motivated, technically novel in combining Mamba with graph convolutions, and the dual-head predictor is a sensible integration of two standard survival losses. The paper also includes useful ablations and a discussion that candidly raises the question of whether gains are merely due to larger batch size. The main value is in opening a new axis of modeling—cross-slide context—that could generalize to other whole-slide-image tasks. However, the significance is currently contingent on the evaluation protocol being leak-free and statistically sound, which the manuscript does not yet establish.
major comments (3)
- [Sec. 4.3 and Sec. 3.2] The group construction protocol is under-specified with respect to cross-validation and patient boundaries. Section 3.2 defines a group as 'every B random WSIs' of the same cancer type, and Section 4.3 states only that 'during model training and validation, we treat every 6 slides as a group.' The manuscript never states whether groups are formed separately within each fold, whether the underlying split is at the patient/case level rather than the slide level, or whether a patient's slides can appear in both training and validation groups. Because GPAMamba propagates information across slides within a group (Algorithm 1, lines 5-11) before the predictor emits per-slide risk, a validation slide whose group contains training-fold slides could have its prediction influenced by slides whose survival labels were used to fit the model. This would inflate the reported C-index gains in Table 1 relative to any deployable single-patient protocol. The authors must specify the grouping procedure relative to folds and patients, and re-run the evaluation with groups constrained to be within each validation fold and with patient-level splits if not already used.
- [Abstract and Sec. 4.4, Table 1] The claim that GroupMIL 'significantly outperforms' state-of-the-art approaches is not supported by any statistical significance test. Table 1 reports only the mean and standard deviation of the C-index over five folds, and for several datasets the standard deviations overlap between GroupMIL and the best baseline (e.g., BRCA: 0.713 ± 0.052 vs. MambaMIL 0.654 ± 0.042; UCEC: 0.760 ± 0.047 vs. 0.743 ± 0.055). With five folds, such overlapping intervals cannot justify the word 'significantly.' The authors should add paired significance tests (e.g., Wilcoxon signed-rank or permutation tests across folds) or temper the claim in the abstract and Section 4.4.
- [Sec. 4.5 and Sec. 5] All architectural and hyperparameter choices—group size, number of graph neighbors, loss weight α, gradient accumulation steps, and interval count—are selected based on the same five TCGA datasets used for the final evaluation. This creates a risk of selection bias and optimistic performance estimates, since the model is tuned on the test data. The ablation tables (Tables 2 and 3) report performance for different choices but do not use nested cross-validation or a held-out tuning set. The authors should either provide a nested cross-validation analysis or explicitly state that the reported numbers are tuning-selected and therefore should be interpreted as potentially optimistic.
minor comments (6)
- [Sec. 4.4, Table 1] The reported standard deviation for TransMIL on UCEC is 0.751, which is implausibly large compared to all other entries in the table and is likely a typo for 0.071 or 0.075; please correct.
- [Sec. 3.4] The sentence 'To harness the rich information withing′' contains a typo: it should be 'within g′'.
- [Sec. 3.2] The symbol B is used to denote group size without formal definition in Section 3.2; it is only later clarified as 6 in Section 4.3. Please define B when first introduced.
- [Sec. 3.3, Eq. (3)] The notation in Eq. (3), ϕ(x) = S(σ(C(L(x)))) + σ(L(x)), is confusing because L, C, σ, and S are not dimensionally specified. Please clarify the shapes and the order of operations, or add a sentence describing the role of each operator.
- [Sec. 5, Table 4] The batch-size/group-size comparison in Table 4 is presented without any significance testing; the conclusion that 'there is no strong correlation between batch size and model performance' is based on overlapping means and standard deviations. Please add a statistical comparison or soften the claim.
- [Sec. 2, References] Some references appear incomplete or informal, e.g., reference [13] cites 'Mamba: Linear-time sequence modeling with selective state spaces' as an arXiv preprint without a year in the citation. Please verify all references for completeness.
Circularity Check
No significant circularity: the reported C-index gains are empirical comparisons against held-out survival labels, and no derivational claim reduces to a fitted parameter or self-citation.
full rationale
The paper's central claim is an empirical performance comparison: GroupMIL is trained with standard Cox and discrete-time survival losses (Eqs. 1, 2, 5) on five TCGA datasets and evaluated by five-fold cross-validated C-index (Sec. 4.2, 4.4, Table 1). Survival labels are not used to construct the model's equations; the dual-head combination rule in Eq. 4 is a fixed additive fusion of the risk and probability heads, not a fit to the results. The components (GPAMamba, PAMamba, dual-head predictor) are architectural proposals whose contributions are tested by ablations (Sec. 4.5), not derived from the outcome metric. Citations to Mamba [13] and to MambaMIL [38], where a co-author overlaps, are used as prior architecture and as a baseline, not as an argument that forces the paper's design or conclusions. The possible grouping ambiguity noted in Sec. 3.2 and Sec. 5 (groups of six random slides formed across the dataset without explicit fold/patient-level isolation) is a potential evaluation-leakage concern, but it does not make any stated result equivalent to its inputs by construction. No fitted input is renamed as a prediction, and no uniqueness theorem or self-citation carries the derivation. Therefore the circularity score is 0.
Assumptions & free parameters
free parameters (5)
- group_size =
6
- survival_intervals =
4
- graph_neighbors =
24
- loss_alpha =
0.5
- gradient_accumulation_steps =
32
assumptions (3)
- domain assumption Collective analysis of multiple slides by pathologists improves prognostic assessment.
- ad hoc to paper Randomly grouping same-cancer slides is a valid proxy for clinical multi-slide review.
- domain assumption Mamba state space models and graph convolutions preserve prognostic signal across gigapixel pathology images.
Cite this review
Pith. "Pith review of Look a Group at Once: Multi-Slide Modeling for Survival Prediction." pith.science (2026). https://pith.science/paper/3SU6DNKV
@misc{pith2026241111487,
  author       = {Pith},
  title        = {Pith review of: Look a Group at Once: Multi-Slide Modeling for Survival Prediction},
  year         = {2026},
  howpublished = {\url{https://pith.science/paper/3SU6DNKV}},
  note         = {Machine review of arXiv:2411.11487}
}
read the original abstract
Survival prediction is a critical task in pathology. In clinical practice, pathologists often examine multiple cases, leveraging a broader spectrum of cancer phenotypes to enhance pathological assessment. Despite significant advancements in deep learning, current solutions typically model each slide as a sample, struggling to effectively capture comparable and slide-agnostic pathological features. In this paper, we introduce GroupMIL, a novel framework inspired by the clinical practice of collective analysis, which models multiple slides as a single sample and organizes groups of patches and slides sequentially to capture cross-slide prognostic features. We also present GPAMamba, a model designed to facilitate intra- and inter-slide feature interactions, effectively capturing local micro-environmental characteristics within slide-level graphs while uncovering essential prognostic patterns across an extended patch sequence within the group framework. Furthermore, we develop a dual-head predictor that delivers comprehensive survival risk and probability assessments for each patient. Extensive empirical evaluations demonstrate that our model significantly outperforms state-of-the-art approaches across five datasets from The Cancer Genome Atlas.
Figures


Figures from the paper (5 more)


Reference graph
Works this paper leans on
-
[1]
J Martin Bland and Douglas G Altman. The logrank test. Bmj, 328(7447):1073, 2004. 7
work page 2004
-
[2]
Richard J Chen, Ming Y Lu, Muhammad Shaban, Chengkuan Chen, Tiffany Y Chen, Drew FK Williamson, and Faisal Mahmood. Whole slide images are 2d point clouds: Context-aware survival prediction using patch-based graph convolutional networks. In Medical Image Computing and Computer Assisted Intervention–MICCAI 2021: 24th In- ternational Conference, Strasbourg,...
work page 2021
-
[3]
Multimodal co-attention transformer for survival prediction in gigapixel whole slide images
Richard J Chen, Ming Y Lu, Wei-Hung Weng, Tiffany Y Chen, Drew FK Williamson, Trevor Manz, Maha Shady, and Faisal Mahmood. Multimodal co-attention transformer for survival prediction in gigapixel whole slide images. In Pro- ceedings of the IEEE/CVF international conference on com- puter vision, pages 4015–4025, 2021. 5
work page 2021
-
[4]
Scaling vision transformers to gigapixel images via hierarchical self-supervised learning
Richard J Chen, Chengkuan Chen, Yicong Li, Tiffany Y Chen, Andrew D Trister, Rahul G Krishnan, and Faisal Mahmood. Scaling vision transformers to gigapixel images via hierarchical self-supervised learning. In Proceedings of the IEEE/CVF Conference on Computer Vision and Pattern Recognition, pages 16144–16155, 2022. 1, 2
work page 2022
-
[5]
Regression models and life-tables
David R Cox. Regression models and life-tables. Journal of the Royal Statistical Society: Series B (Methodological) , 34 (2):187–202, 1972. 2, 3
work page 1972
-
[6]
Imagenet: A large-scale hierarchical image database
Jia Deng, Wei Dong, Richard Socher, Li-Jia Li, Kai Li, and Li Fei-Fei. Imagenet: A large-scale hierarchical image database. In 2009 IEEE conference on computer vision and pattern recognition, pages 248–255. Ieee, 2009. 5
2009
-
[7]
Pathology-and-genomics multimodal transformer for survival outcome prediction
Kexin Ding, Mu Zhou, Dimitris N Metaxas, and Shaoting Zhang. Pathology-and-genomics multimodal transformer for survival outcome prediction. In International Conference on Medical Image Computing and Computer-Assisted Interven- tion, pages 622–631. Springer, 2023. 2
work page 2023
-
[8]
An image is worth 16x16 words: Transformers for image recognition at scale
Alexey Dosovitskiy. An image is worth 16x16 words: Transformers for image recognition at scale. arXiv preprint arXiv:2010.11929, 2020. 2
arXiv 2010
Show all 45 references
-
[9]
Learning visual features by colorization for slide-consistent survival prediction from whole slide images
Lei Fan, Arcot Sowmya, Erik Meijering, and Yang Song. Learning visual features by colorization for slide-consistent survival prediction from whole slide images. In Medi- cal Image Computing and Computer Assisted Intervention– MICCAI 2021: 24th International Conference, Strasbo...
2021
-
[10]
Cancer survival prediction from whole slide images with self-supervised learning and slide consistency
Lei Fan, Arcot Sowmya, Erik Meijering, and Yang Song. Cancer survival prediction from whole slide images with self-supervised learning and slide consistency. IEEE Trans- actions on Medical Imaging, 2022. 2, 3
2022
-
[11]
Structured state space models for multiple instance learning in digital pathol- ogy
Leo Fillioux, Joseph Boyd, Maria Vakalopoulou, Paul-Henry Courn`ede, and Stergios Christodoulidis. Structured state space models for multiple instance learning in digital pathol- ogy. In International Conference on Medical Image Com- puting and Computer-Assisted Intervention, ...
2023
-
[12]
The immune contexture in cancer prognosis and treatment
Wolf H Fridman, Laurence Zitvogel, Catherine Saut `es- Fridman, and Guido Kroemer. The immune contexture in cancer prognosis and treatment. Nature reviews Clinical on- cology, 14(12):717–734, 2017. 1
2017
-
[13]
Mamba: Linear-time sequence modeling with selective state spaces
Albert Gu and Tri Dao. Mamba: Linear-time sequence modeling with selective state spaces. arXiv preprint arXiv:2312.00752, 2023. 2, 3, 4
2023 arXiv
-
[14]
Deep residual learning for image recognition
Kaiming He, Xiangyu Zhang, Shaoqing Ren, and Jian Sun. Deep residual learning for image recognition. In Proceed- ings of the IEEE conference on computer vision and pattern recognition, pages 770–778, 2016. 5
2016
-
[15]
Gaussian error linear units (gelus)
Dan Hendrycks and Kevin Gimpel. Gaussian error linear units (gelus). arXiv preprint arXiv:1606.08415, 2016. 4
2016 arXiv
-
[16]
Multi-scope analysis driven hierarchical graph transformer for whole slide image based cancer survival prediction
Wentai Hou, Yan He, Bingjian Yao, Lequan Yu, Rongshan Yu, Feng Gao, and Liansheng Wang. Multi-scope analysis driven hierarchical graph transformer for whole slide image based cancer survival prediction. In International Confer- ence on Medical Image Computing and Computer-Assi...
2023
-
[17]
Attention-based deep multiple instance learning
Maximilian Ilse, Jakub Tomczak, and Max Welling. Attention-based deep multiple instance learning. In Inter- national conference on machine learning, pages 2127–2136. PMLR, 2018. 5, 6
2018
-
[18]
Mutational landscape and significance across 12 major cancer types
Cyriac Kandoth, Michael D McLellan, Fabio Vandin, Kai Ye, Beifang Niu, Charles Lu, Mingchao Xie, Qunyuan Zhang, Joshua F McMichael, Matthew A Wyczalkowski, et al. Mutational landscape and significance across 12 major cancer types. Nature, 502(7471):333–339, 2013. 5
2013
-
[19]
Nonparametric estima- tion from incomplete observations
Edward L Kaplan and Paul Meier. Nonparametric estima- tion from incomplete observations. Journal of the American statistical association, 53(282):457–481, 1958. 7
1958
-
[20]
Adam: A method for stochastic opti- mization
Diederik P Kingma. Adam: A method for stochastic opti- mization. arXiv preprint arXiv:1412.6980, 2014. 5
2014 arXiv
-
[21]
Elsevier Health Sciences, 2012
Vinay Kumar, Abul K Abbas, and Jon C Aster.Robbins basic pathology e-book. Elsevier Health Sciences, 2012. 1, 3
2012
-
[22]
Dual-stream multiple instance learning network for whole slide image classifica- tion with self-supervised contrastive learning
Bin Li, Yin Li, and Kevin W Eliceiri. Dual-stream multiple instance learning network for whole slide image classifica- tion with self-supervised contrastive learning. In Proceed- ings of the IEEE/CVF conference on computer vision and pattern recognition, pages 14318–14328, 2021. 5, 6
2021
-
[23]
Graph cnn for survival analysis on whole slide pathological images
Ruoyu Li, Jiawen Yao, Xinliang Zhu, Yeqing Li, and Jun- zhou Huang. Graph cnn for survival analysis on whole slide pathological images. In International Conference on Med- ical Image Computing and Computer-Assisted Intervention , pages 174–182. Springer, 2018. 1, 2, 5, 6, 8
2018
-
[24]
Survival prediction via hierarchical multimodal co- attention transformer: A computational histology-radiology solution
Zhe Li, Yuming Jiang, Mengkang Lu, Ruijiang Li, and Yong Xia. Survival prediction via hierarchical multimodal co- attention transformer: A computational histology-radiology solution. IEEE Transactions on Medical Imaging , 42(9): 2678–2689, 2023. 2
2023
-
[25]
An integrated tcga pan-cancer clinical data resource to drive high-quality survival outcome analyt- ics
Jianfang Liu, Tara Lichtenberg, Katherine A Hoadley, Laila M Poisson, Alexander J Lazar, Andrew D Cherniack, Albert J Kovatich, Christopher C Benz, Douglas A Levine, Adrian V Lee, et al. An integrated tcga pan-cancer clinical data resource to drive high-quality survival outcom...
2018
-
[26]
Data-efficient and weakly supervised computational pathology on whole- slide images
Ming Y Lu, Drew FK Williamson, Tiffany Y Chen, Richard J Chen, Matteo Barbieri, and Faisal Mahmood. Data-efficient and weakly supervised computational pathology on whole- slide images. Nature biomedical engineering, 5(6):555–570,
-
[27]
Neural graph modelling of whole slide images for survival ranking
Callum Christopher Mackenzie, Muhammad Dawood, Si- mon Graham, Mark Eastwood, et al. Neural graph modelling of whole slide images for survival ranking. In Learning on Graphs Conference, pages 48–1. PMLR, 2022. 2
2022
-
[28]
Amigo: Sparse multi-modal graph transformer with shared-context processing for representation learning of giga-pixel images
Ramin Nakhli, Puria Azadi Moghadam, Haoyang Mi, Hos- sein Farahani, Alexander Baras, Blake Gilks, and Ali Bashashati. Amigo: Sparse multi-modal graph transformer with shared-context processing for representation learning of giga-pixel images. arXiv preprint arXiv:2303.00865, 2023. 3
2023 arXiv
-
[29]
Searching for activation functions
Prajit Ramachandran, Barret Zoph, and Quoc V Le. Searching for activation functions. arXiv preprint arXiv:1710.05941, 2017. 4
2017 arXiv
-
[30]
Weakly supervised deep ordinal cox model for survival prediction from whole-slide pathological im- ages
Wei Shao, Tongxin Wang, Zhi Huang, Zhi Han, Jie Zhang, and Kun Huang. Weakly supervised deep ordinal cox model for survival prediction from whole-slide pathological im- ages. IEEE Transactions on Medical Imaging, 40(12):3739– 3747, 2021. 1, 2
2021
-
[31]
Transmil: Transformer based correlated multiple instance learning for whole slide image classification
Zhuchen Shao, Hao Bian, Yang Chen, Yifeng Wang, Jian Zhang, Xiangyang Ji, et al. Transmil: Transformer based correlated multiple instance learning for whole slide image classification. Advances in neural information processing systems, 34:2136–2147, 2021. 5, 6, 8
2021
-
[32]
Hvtsurv: Hierarchical vision transformer for patient-level survival prediction from whole slide image
Zhuchen Shao, Yang Chen, Hao Bian, Jian Zhang, Guojun Liu, and Yongbing Zhang. Hvtsurv: Hierarchical vision transformer for patient-level survival prediction from whole slide image. In Proceedings of the AAAI Conference on Ar- tificial Intelligence, pages 2209–2217, 2023. 1, 2...
2023
-
[33]
On ranking in sur- vival analysis: Bounds on the concordance index
Harald Steck, Balaji Krishnapuram, Cary Dehing-Oberije, Philippe Lambin, and Vikas C Raykar. On ranking in sur- vival analysis: Bounds on the concordance index. Advances in neural information processing systems, 20, 2007. 5
2007
-
[34]
Modeling discrete time-to-event data
Gerhard Tutz, Matthias Schmid, et al. Modeling discrete time-to-event data. Springer, 2016. 3
2016
-
[35]
Attention is all you need
Ashish Vaswani, Noam Shazeer, Niki Parmar, Jakob Uszko- reit, Llion Jones, Aidan N Gomez, Łukasz Kaiser, and Illia Polosukhin. Attention is all you need. Advances in neural information processing systems, 30, 2017. 2, 6
2017
-
[36]
An explainable coarse-to- fine survival analysis method on multi-center whole slide images
Han Wang, Dan Jiang, Haixian Zhang, Yujue Wang, Li Yang, David J Kerr, and Yi Zhang. An explainable coarse-to- fine survival analysis method on multi-center whole slide images. IEEE Transactions on Artificial Intelligence , 5(3): 1316–1327, 2023. 2
2023
-
[37]
Hierarchical graph pathomic network for progression free survival prediction
Zichen Wang, Jiayun Li, Zhufeng Pan, Wenyuan Li, An- thony Sisk, Huihui Ye, William Speier, and Corey W Arnold. Hierarchical graph pathomic network for progression free survival prediction. In Medical Image Computing and Computer Assisted Intervention–MICCAI 2021: 24th Inter- ...
2021
-
[38]
Mambamil: En- hancing long sequence modeling with sequence reordering in computational pathology
Shu Yang, Yihui Wang, and Hao Chen. Mambamil: En- hancing long sequence modeling with sequence reordering in computational pathology. arXiv preprint arXiv:2403.06800,
-
[39]
Deep multi- instance learning for survival prediction from whole slide images
Jiawen Yao, Xinliang Zhu, and Junzhou Huang. Deep multi- instance learning for survival prediction from whole slide images. In Medical Image Computing and Computer As- sisted Intervention–MICCAI 2019: 22nd International Con- ference, Shenzhen, China, October 13–17, 2019, Proce...
2019
-
[40]
Whole slide images based cancer survival prediction using attention guided deep multi- ple instance learning networks
Jiawen Yao, Xinliang Zhu, Jitendra Jonnagaddala, Nicholas Hawkins, and Junzhou Huang. Whole slide images based cancer survival prediction using attention guided deep multi- ple instance learning networks. Medical Image Analysis, 65: 101789, 2020. 1, 3, 5, 6
2020
-
[41]
Bias in cross- entropy-based training of deep survival networks
Shekoufeh Gorgi Zadeh and Matthias Schmid. Bias in cross- entropy-based training of deep survival networks. IEEE transactions on pattern analysis and machine intelligence , 43(9):3126–3137, 2020. 2, 3
2020
-
[42]
A practical guide to whole slide imaging: a white paper from the digital pathology association
Mark D Zarella, Douglas Bowman, Famke Aeffner, Navid Farahani, Albert Xthona, Syeda Fatima Absar, Anil Par- wani, Marilyn Bui, and Douglas J Hartman. A practical guide to whole slide imaging: a white paper from the digital pathology association. Archives of pathology & laborat...
2019
-
[43]
Dtfd- mil: Double-tier feature distillation multiple instance learn- ing for histopathology whole slide image classification
Hongrun Zhang, Yanda Meng, Yitian Zhao, Yihong Qiao, Xiaoyun Yang, Sarah E Coupland, and Yalin Zheng. Dtfd- mil: Double-tier feature distillation multiple instance learn- ing for histopathology whole slide image classification. In Proceedings of the IEEE/CVF conference on comp...
2022
-
[44]
Deep con- volutional neural network for survival analysis with patho- logical images
Xinliang Zhu, Jiawen Yao, and Junzhou Huang. Deep con- volutional neural network for survival analysis with patho- logical images. In 2016 IEEE International Conference on Bioinformatics and Biomedicine (BIBM) , pages 544–547. IEEE, 2016. 2
2016
-
[45]
Wsisa: Making survival prediction from whole slide histopathological images
Xinliang Zhu, Jiawen Yao, Feiyun Zhu, and Junzhou Huang. Wsisa: Making survival prediction from whole slide histopathological images. In Proceedings of the IEEE con- ference on computer vision and pattern recognition , pages 7234–7242, 2017. 1
2017
Reviewed August 12, 2026 · model on record in the stance chip above.
Discussion (0). Continue with ORCID to comment.