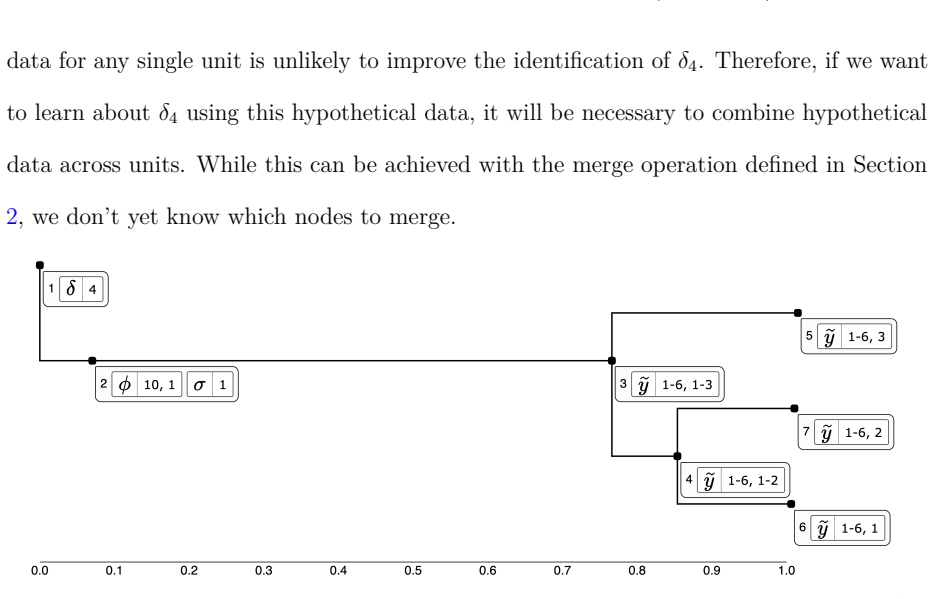
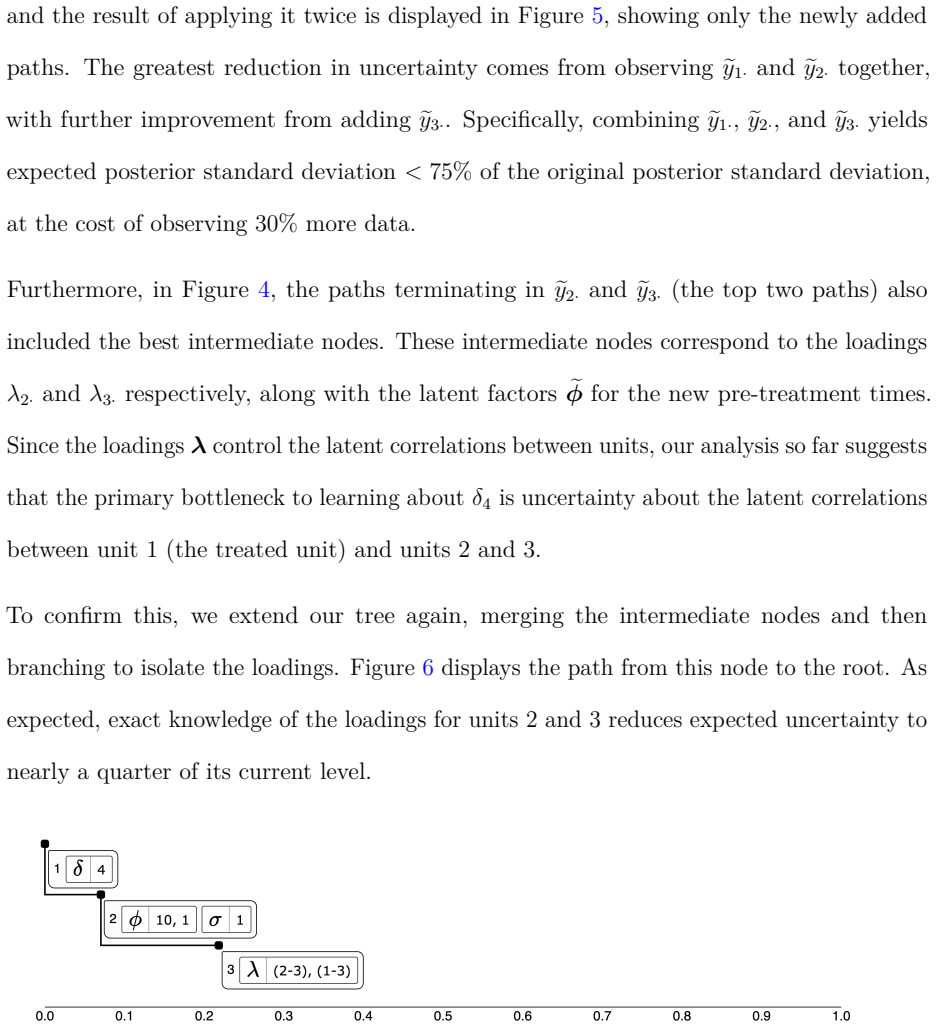
Variance Deltas for Visualizing and Explaining Posterior Uncertainty
Pith reviewed 2026-06-26 01:18 UTC · model grok-4.3
The pith
Variance deltas build trees of unobserved model subsets to explain what is missing from Bayesian posteriors.
A machine-rendered reading of the paper's core claim, the machinery that carries it, and where it could break.
Core claim
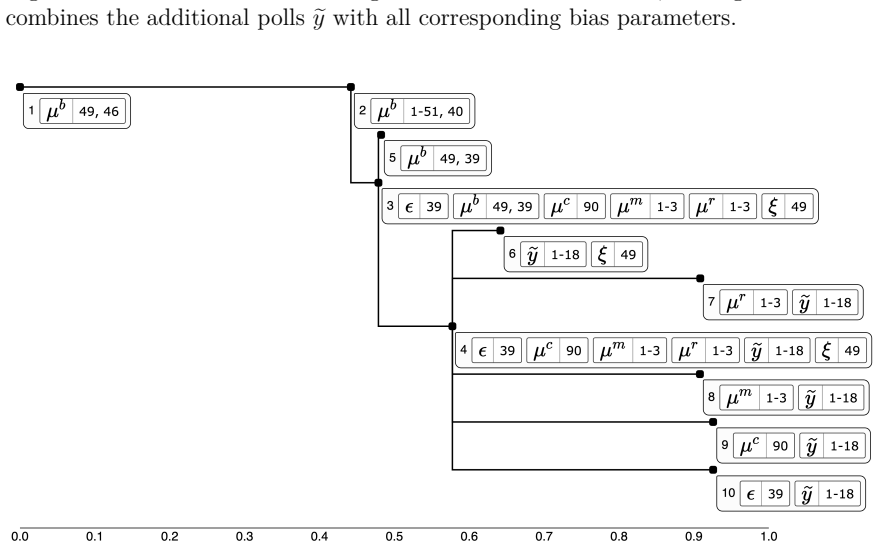
Variance deltas represent missing information as subsets of unobserved model quantities, arranged in a tree according to how much each subset accounts for uncertainty about the quantity of interest, and provide interactive operations to refine those subsets from a Bayesian posterior.
What carries the argument
The variance deltas tree, which ranks subsets of unobserved quantities by their power to explain posterior uncertainty and supports interactive division and combination.
If this is right
- The system can surface nonobvious drivers of uncertainty about a treatment effect in causal models.
- It can isolate sources of bias affecting a population proportion estimate in polling data.
- Automated subset construction plus interactive refinement allows efficient exploration without exhaustive manual specification.
- The tree structure directly links explanatory power to concrete unobserved quantities rather than abstract sensitivity measures.
Where Pith is reading between the lines
- The approach could guide targeted data collection by highlighting which additional observations would most reduce uncertainty.
- It may apply to sequential decision problems where new measurements are chosen to shrink posterior variance on a policy parameter.
- Integration with existing Bayesian software would let analysts apply the tree view to models they already fit.
Load-bearing premise
The posterior already contains the structure needed to decompose missing information into ranked subsets without extra modeling assumptions.
What would settle it
A simulation in which the highest-ranked subset in the variance deltas tree produces little or no actual reduction in posterior variance when its quantities are observed.
Figures
read the original abstract
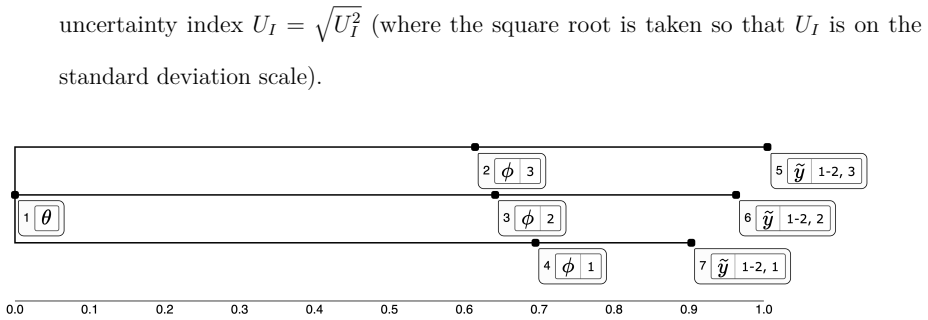
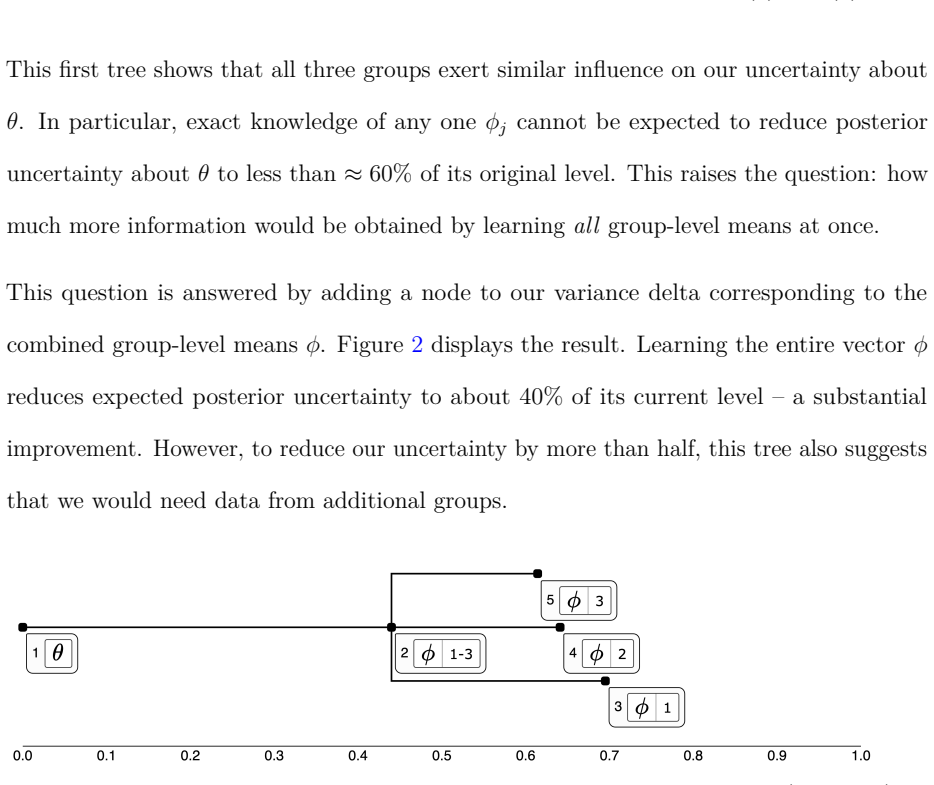
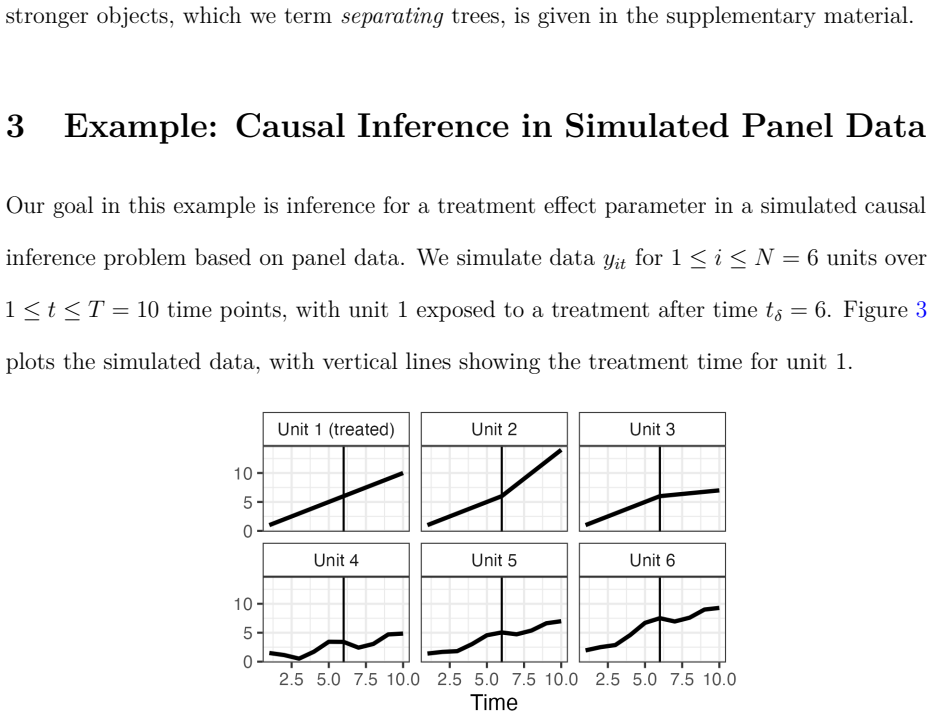
In observational settings, where the data generating process and possibly the sample size are not controlled, it is typically impossible to guarantee a priori that quantities of interest will be estimated with sufficient precision. However, even when the data do not determine the quantities of interest, they may still allow determination of what is missing -- unobserved information which, if observed, would meaningfully reduce uncertainty. We propose an interactive visualization system, termed variance deltas, to enable the discovery of such missing information from a Bayesian posterior distribution. This system, which we provide as a software package, represents missing information as subsets of unobserved model quantities, organized into a tree based on how well each subset explains uncertainty about the quantity of interest. This system both automates the construction of candidate subsets from minimal user input and implements interactive operations for the division and combination of subsets, allowing the efficient discovery of interesting and useful explanations. We demonstrate this system by using it to discover nonobvious explanations of uncertainty for (1) a treatment effect parameter in a simulated causal inference problem and (2) a population proportion in a forecasting model of real polling data with many sources of bias.
Editorial analysis
A structured set of objections, weighed in public.
Referee Report
Summary. The manuscript proposes 'variance deltas', an interactive visualization system for discovering missing information in Bayesian posteriors. It represents uncertainty-reducing subsets of unobserved model quantities as nodes in a tree, ranked by explanatory power, with automated construction from minimal user input and interactive subset division/combination operations. The system is implemented as open software and demonstrated on (1) a simulated causal inference model for treatment effect uncertainty and (2) a real polling dataset for population proportion uncertainty with multiple bias sources.
Significance. If the tree construction and ranking reliably surface non-obvious, actionable explanations of posterior uncertainty, the tool could support exploratory analysis in observational settings where a priori precision guarantees are unavailable. The provision of a software package is a clear strength for reproducibility. The work is primarily methodological and exploratory rather than providing formal statistical guarantees.
major comments (2)
- [§3] §3 (tree construction): The manuscript states that subsets are organized 'based on how well each subset explains uncertainty' via a tree metric, but provides no derivation or invariance result showing that the ranking is robust to posterior sampling variability or the choice of MCMC approximation; this is load-bearing for the claim that the automated construction discovers meaningful explanations.
- [§4.2] §4.2 (polling data demonstration): The surfaced explanations for bias sources are presented as non-obvious, yet the section reports no quantitative measure (e.g., actual conditional variance reduction) or comparison against a baseline such as random subset selection or expert-identified sources, weakening the claim that the interface enables efficient discovery beyond manual inspection.
minor comments (2)
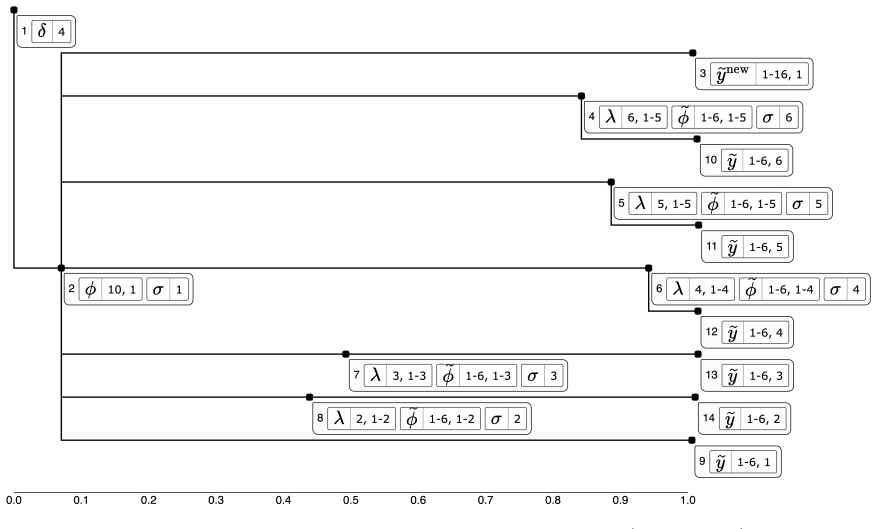
- [Figure 3] Figure 3: Axis labels and color scale for variance delta values are not fully described in the caption, making it difficult to interpret the magnitude of explanatory power.
- The software package is referenced but the manuscript does not include a link or DOI in the main text or reproducibility statement.
Simulated Author's Rebuttal
We thank the referee for the positive assessment and constructive comments on our manuscript. We address the major comments point by point below and will make the indicated revisions to strengthen the presentation.
read point-by-point responses
-
Referee: [§3] §3 (tree construction): The manuscript states that subsets are organized 'based on how well each subset explains uncertainty' via a tree metric, but provides no derivation or invariance result showing that the ranking is robust to posterior sampling variability or the choice of MCMC approximation; this is load-bearing for the claim that the automated construction discovers meaningful explanations.
Authors: We acknowledge that the manuscript provides no formal derivation or invariance result establishing robustness of the ranking to posterior sampling variability or MCMC choice. The tree metric is defined directly from empirical conditional variances computed on the available posterior samples, and the construction is intended as a practical, exploratory heuristic rather than a procedure with theoretical guarantees. In the revision we will add an explicit discussion of this point in §3, noting that the metric is invariant to affine transformations of the posterior samples and that stability can be assessed by recomputing the tree on independent MCMC chains; we will also include a brief empirical check using the simulated example to illustrate sensitivity. revision: yes
-
Referee: [§4.2] §4.2 (polling data demonstration): The surfaced explanations for bias sources are presented as non-obvious, yet the section reports no quantitative measure (e.g., actual conditional variance reduction) or comparison against a baseline such as random subset selection or expert-identified sources, weakening the claim that the interface enables efficient discovery beyond manual inspection.
Authors: We agree that the polling demonstration would be strengthened by quantitative evidence. In the revised §4.2 we will report the actual conditional variance reductions (as fractions of the marginal variance) for each surfaced subset and will add a simple baseline comparison: the variance reductions obtained by 100 randomly chosen subsets of comparable cardinality drawn from the same pool of unobserved quantities. This will allow readers to see that the tree-guided selections achieve larger reductions than random selection on average, supporting the claim that the interface aids discovery beyond unaided manual inspection. revision: yes
Circularity Check
No significant circularity
full rationale
The paper proposes an interactive visualization system (variance deltas) that decomposes posterior uncertainty over subsets of unobserved quantities into a tree structure. No formal derivation, theorem, or prediction is presented that reduces by construction to fitted parameters, self-citations, or ansatzes. The method is described as a software layer operating on an existing Bayesian posterior, with demonstrations on simulated and real data serving as exploratory illustrations rather than load-bearing claims. No equations or self-referential steps appear in the provided text that would trigger any of the enumerated circularity patterns.
Axiom & Free-Parameter Ledger
Reference graph
Works this paper leans on
-
[1]
Matematicheskoe modelirovanie , volume=
On sensitivity estimation for nonlinear mathematical models , author=. Matematicheskoe modelirovanie , volume=. 1990 , publisher=
1990
-
[2]
Ivanova and Freddie Bickford Smith , title =
Tom Rainforth and Adam Foster and Desi R. Ivanova and Freddie Bickford Smith , title =. Statistical Science , number =. 2024 , doi =
2024
-
[3]
Journal of Statistical Software , author=
ranger: A Fast Implementation of Random Forests for High Dimensional Data in C++ and R , volume=. Journal of Statistical Software , author=. 2017 , pages=. doi:10.18637/jss.v077.i01 , number=
-
[4]
A Review on Global Sensitivity Analysis Methods , bookTitle=
Iooss, Bertrand and Lema. A Review on Global Sensitivity Analysis Methods , bookTitle=. 2015 , publisher=
2015
-
[5]
Quantum marginal inequalities and the conjectured entropic inequalities
Stijn Hawinkel and Willem Waegeman and Steven Maere , title =. The American Statistician , volume =. 2024 , publisher =. doi:10.1080/00031305.2023.2216252 , URL =
work page internal anchor Pith review Pith/arXiv arXiv doi:10.1080/00031305.2023.2216252 2024
-
[6]
Statistical Science , number =
Sander Greenland , title =. Statistical Science , number =. 2009 , doi =
2009
-
[7]
Journal of the Royal Statistical Society: Series A (Statistics in Society) , volume =
Greenland, Sander , title =. Journal of the Royal Statistical Society: Series A (Statistics in Society) , volume =. doi:https://doi.org/10.1111/j.1467-985X.2004.00349.x , url =. https://rss.onlinelibrary.wiley.com/doi/pdf/10.1111/j.1467-985X.2004.00349.x , year =
-
[8]
and Lee, Su-In , title =
Lundberg, Scott M. and Lee, Su-In , title =. Proceedings of the 31st International Conference on Neural Information Processing Systems , pages =. 2017 , isbn =
2017
-
[9]
, title =
Owen, Art B. , title =. SIAM/ASA Journal on Uncertainty Quantification , volume =. 2014 , doi =
2014
-
[10]
Journal of the American Statistical Association , volume =
Alberto Abadie and Alexis Diamond and Jens Hainmueller , title =. Journal of the American Statistical Association , volume =. 2010 , publisher =. doi:10.1198/jasa.2009.ap08746 , URL =
-
[11]
A Bayesian Alternative to Synthetic Control for Comparative Case Studies , volume=. Political Analysis , author=. 2022 , pages=. doi:10.1017/pan.2021.22 , number=
-
[12]
Entropy , VOLUME =
Linardatos, Pantelis and Papastefanopoulos, Vasilis and Kotsiantis, Sotiris , TITLE =. Entropy , VOLUME =. 2021 , NUMBER =
2021
-
[13]
Elliott , journal =
Heidemanns, Merlin and Gelman, Andrew and Morris, G. Elliott , journal =. An. 2020 , month =
2020
-
[14]
Journal of Business & Economic Statistics , volume =
Jushan Bai and Peng Wang , title =. Journal of Business & Economic Statistics , volume =. 2015 , publisher =. doi:10.1080/07350015.2014.941467 , URL =
-
[15]
2022 , note =
shinystan: Interactive Visual and Numerical Diagnostics and Posterior Analysis for Bayesian Models , author =. 2022 , note =
2022
-
[16]
2025 , eprint=
Explanations are a means to an end , author=. 2025 , eprint=
2025
-
[17]
Designing for
Hullman, Jessica and Gelman, Andrew , journal =. Designing for. 2021 , month =
2021
-
[18]
VMC: A Grammar for Visualizing Statistical Model Checks , volume=. IEEE Transactions on Visualization and Computer Graphics , author=. 2025 , month=jan, pages=. doi:10.1109/TVCG.2024.3456402 , number=
-
[19]
Visualizing Variable Importance and Variable Interaction Effects in Machine Learning Models , url=
Inglis, Alan and Parnell, Andrew and Hurley, Catherine , year=. Visualizing Variable Importance and Variable Interaction Effects in Machine Learning Models , url=. doi:10.48550/arXiv.2108.04310 , note=
-
[20]
Visualizing the Consequences of Evidence in Bayesian Networks
Champion, Clifford and Elkan, Charles , year=. Visualizing the Consequences of Evidence in Bayesian Networks , url=. doi:10.48550/arXiv.1707.00791 , note=
work page internal anchor Pith review Pith/arXiv arXiv doi:10.48550/arxiv.1707.00791
-
[21]
Addressing the unmet need for visualizing conditional random fields in biological data , volume=. BMC Bioinformatics , author=. 2014 , month=july, pages=. doi:10.1186/1471-2105-15-202 , number=
-
[22]
2024 , eprint=
Sensitivity of MCMC-based analyses to small-data removal , author=. 2024 , eprint=
2024
-
[23]
Friedman and Werner Stuetzle , title =
Jerome H. Friedman and Werner Stuetzle , title =. The Annals of Statistics , number =. 2002 , doi =
2002
-
[24]
2025 , eprint=
Open Problems in Mechanistic Interpretability , author=. 2025 , eprint=
2025
-
[25]
2020 , publisher=
Handbook of Graphical Models , author=. 2020 , publisher=
2020
-
[26]
Stan User's Guide , year=
-
[27]
A visual analytics workflow for probabilistic modeling , journal =
Julien Klaus and Mark Blacher and Andreas Goral and Philipp Lucas and Joachim Giesen , keywords =. A visual analytics workflow for probabilistic modeling , journal =. 2023 , issn =. doi:https://doi.org/10.1016/j.visinf.2023.05.001 , url =
-
[28]
2020 , eprint=
Bayesian Workflow , author=. 2020 , eprint=
2020
-
[29]
2025 , note =
bayesplot: Plotting for Bayesian Models , author =. 2025 , note =
2025
-
[30]
Tukey , title =
John W. Tukey , title =. Statistical Science , number =. 1990 , doi =
1990
-
[31]
Sensitivity analysis in presence of model uncertainty and correlated inputs , journal =
Julien Jacques and Christian Lavergne and Nicolas Devictor , keywords =. Sensitivity analysis in presence of model uncertainty and correlated inputs , journal =. 2006 , note =. doi:https://doi.org/10.1016/j.ress.2005.11.047 , url =
-
[32]
2016 , eprint=
Global sensitivity metrics from active subspaces , author=. 2016 , eprint=
2016
-
[33]
Martins and Leonhard Held and H
Małgorzata Roos and Thiago G. Martins and Leonhard Held and H. Bayesian Analysis , number =. 2015 , doi =
2015
-
[34]
Detecting and diagnosing prior and likelihood sensitivity with power-scaling , volume=
Kallioinen, Noa and Paananen, Topi and Bürkner, Paul-Christian and Vehtari, Aki , year=. Detecting and diagnosing prior and likelihood sensitivity with power-scaling , volume=. Statistics and Computing , publisher=. doi:10.1007/s11222-023-10366-5 , number=
-
[35]
Felli and Gordon B
James C. Felli and Gordon B. Hazen , title =. Medical Decision Making , volume =. 1998 , doi =
1998
-
[36]
Skinny gibbs: A consistent and scalable gibbs sampler for model selection
Christopher Jackson and Anne Presanis and Stefano Conti and Daniela De Angelis , title =. Journal of the American Statistical Association , volume =. 2019 , publisher =. doi:10.1080/01621459.2018.1562932 , URL =
discussion (0)
Sign in with ORCID, Apple, or X to comment. Anyone can read and Pith papers without signing in.