High-Resolution Flood Mapping With Sentinel-1 and Sentinel-2 via Misalignment-Robust Cross-Sensor Learning and Generative Despeckling
Pith reviewed 2026-06-30 06:31 UTC · model grok-4.3
The pith
A shift-invariant loss and CVAE despeckling let optical labels train accurate SAR flood maps despite misalignment and speckle.
A machine-rendered reading of the paper's core claim, the machinery that carries it, and where it could break.
Core claim
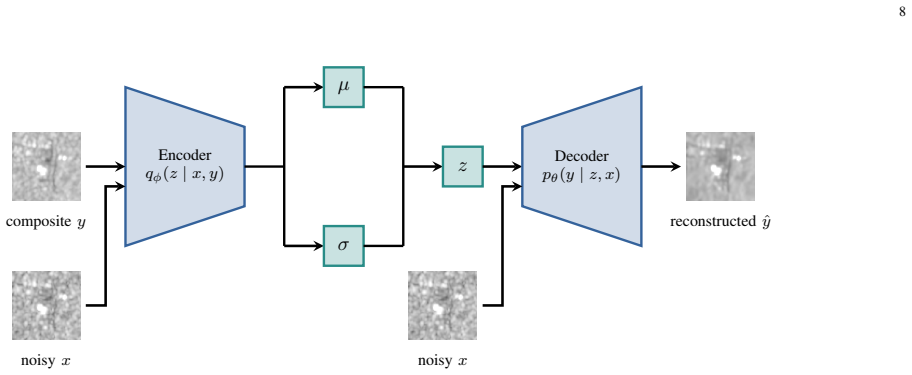
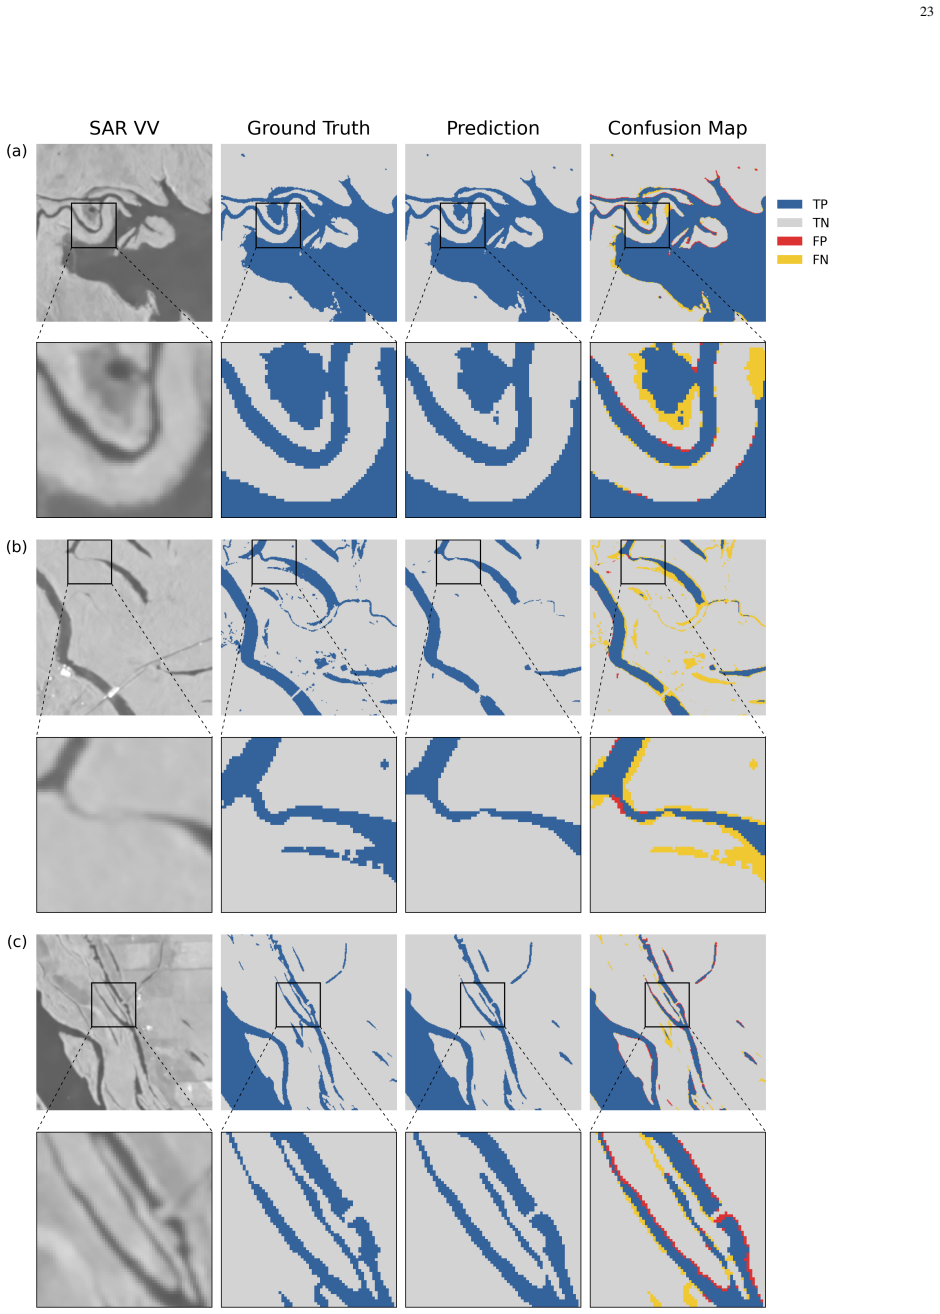
High-quality Sentinel-2 water masks can be transferred to Sentinel-1 imagery through temporally coincident acquisitions; a shift-invariant loss tolerates residual co-registration error during training; and a Conditional Variational Autoencoder trained on multitemporal SAR composites suppresses speckle while preserving spatial structure needed for flood delineation. When these components are combined in standard segmentation architectures, SAR flood mapping improves measurably over baselines that use classical speckle filters.
What carries the argument
The shift-invariant loss that tolerates residual geolocation uncertainty between SAR imagery and optical-derived labels, together with the Conditional Variational Autoencoder (CVAE) trained on multitemporal SAR composites for generative despeckling.
If this is right
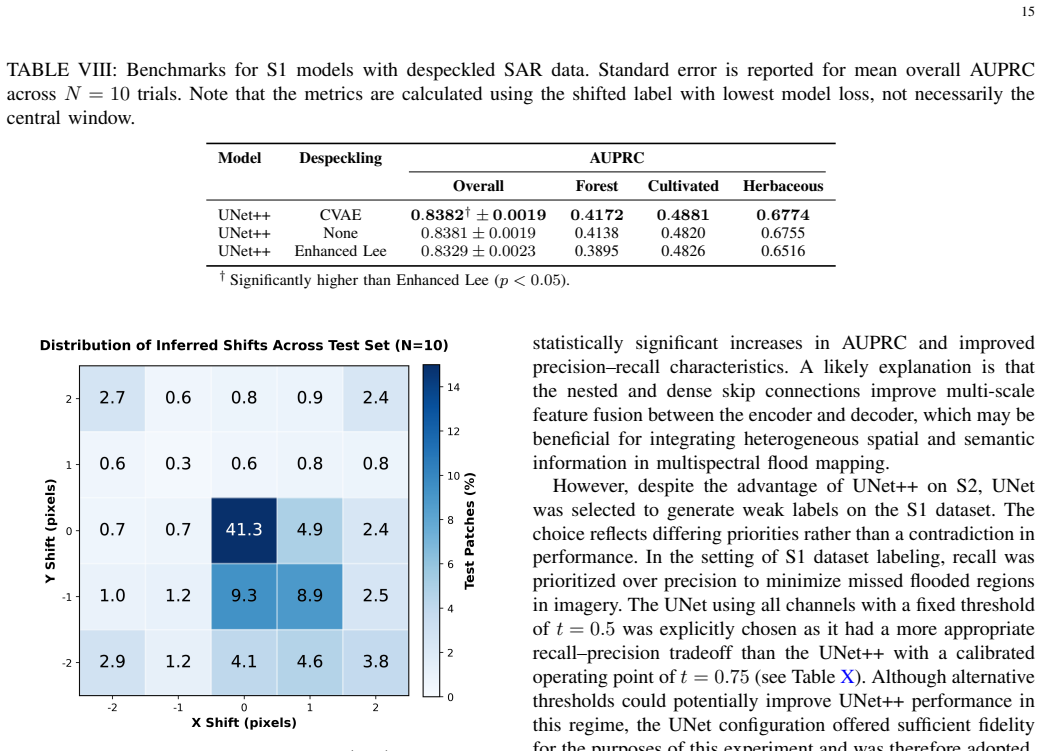
- Multispectral segmentation reaches AUPRC values up to 0.956 on the new dataset.
- SAR flood mapping exhibits statistically significant gains when shift-invariant loss and CVAE despeckling are used instead of classical filters.
- The dataset supplies pixel-accurate 10 m labels for challenging urban and cloudy scenes that prior benchmarks under-represent.
- The overall pipeline demonstrates viability for operational high-resolution flood mapping from SAR.
Where Pith is reading between the lines
- The same label-transfer and misalignment-robust training strategy could be tested on other SAR tasks such as building damage assessment where optical labels are easier to obtain.
- Generative despeckling that preserves flood-relevant structure may also reduce noise in multitemporal change detection without explicit flood supervision.
- If the transferred labels prove robust, the method supplies a scalable route to enlarge training sets for any SAR application that currently lacks dense ground truth.
Load-bearing premise
High-quality Sentinel-2 annotations transferred to Sentinel-1 imagery via weakly labeled temporally coincident acquisitions remain sufficiently accurate for training despite differences in sensor physics, timing, and residual geolocation uncertainty.
What would settle it
An independent set of flood events with field-validated or higher-resolution reference masks, collected after model training, on which the shift-invariant-plus-CVAE pipeline shows no statistically significant AUPRC gain over the same architecture trained with classical speckle filters.
Figures
read the original abstract
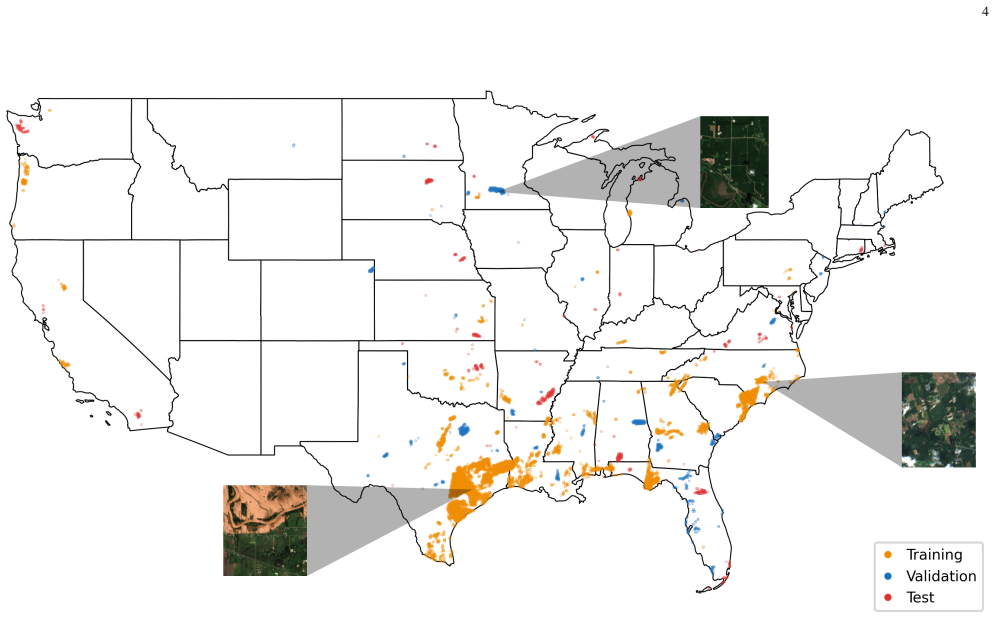
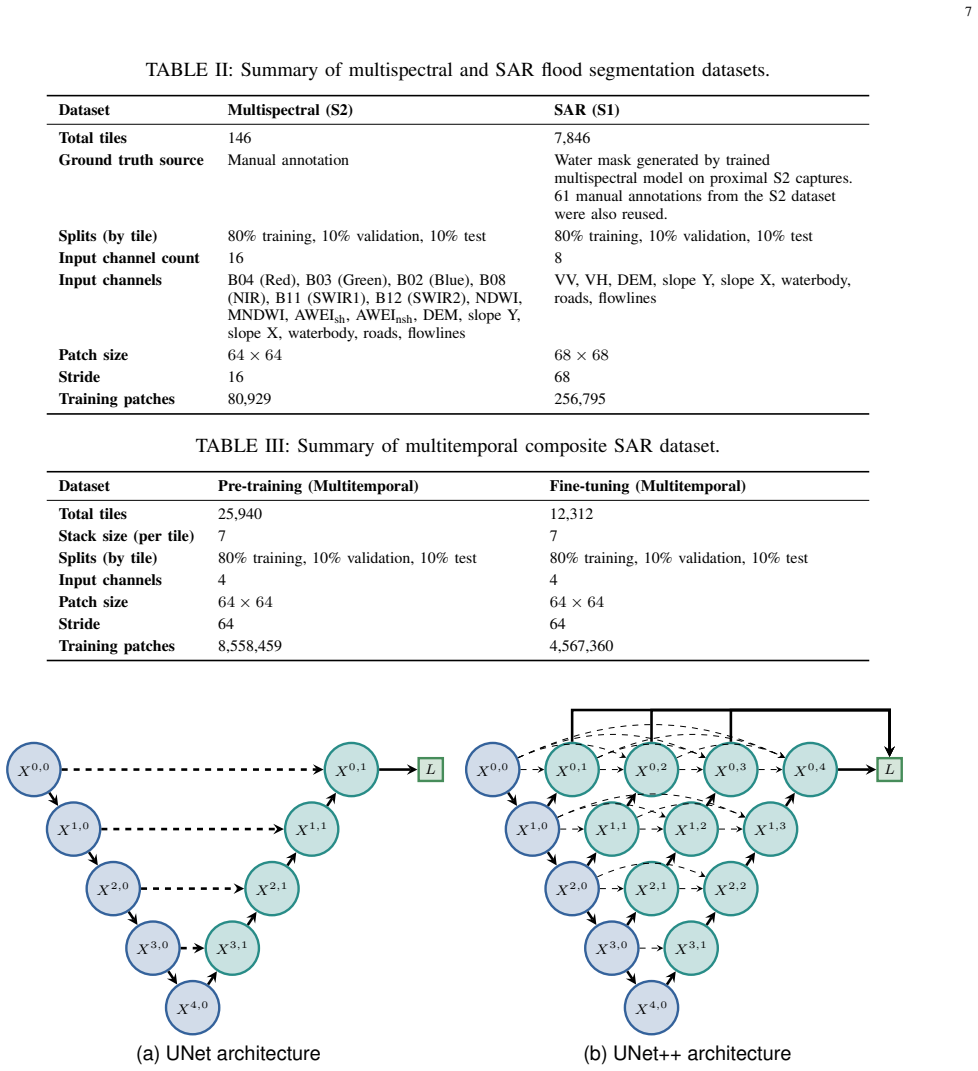
Reliable high-resolution flood extent mapping from satellite imagery remains constrained by limited data fidelity and sensor-specific artifacts. Multispectral optical imagery is degraded by clouds, shadows, and urban confounders, while synthetic aperture radar (SAR) imagery is affected by speckle noise and sensor co-registration uncertainty. This work presents an integrated flood mapping framework that jointly addresses these limitations through curated datasets and novel learning strategies. We introduce a new Sentinel-2 (S2) and Sentinel-1 (S1) dataset covering the contiguous United States, featuring pixel-accurate 10 m water masks with emphasis on challenging weather conditions and urban environments that are underrepresented in existing benchmarks. High-quality S2 annotations are manually produced using rigorous geospatial labeling protocols and transferred to SAR imagery through weakly labeled temporally coincident acquisitions. To address SAR-specific artifacts, a shift-invariant loss function is employed to tolerate residual geolocation uncertainty between SAR imagery and optical-derived labels, and a Conditional Variational Autoencoder (CVAE) is trained on multitemporal SAR composites to suppress speckle while preserving flood-relevant spatial structure. Experiments using UNet and UNet++ architectures demonstrate strong multispectral performance (AUPRC up to 0.956) and statistically significant improvements in SAR flood mapping when using shift-invariant loss and CVAE-based despeckling compared to classical filters. These results underscore the importance of dataset fidelity, misalignment-robust training, and demonstrate the viability of generative despeckling for operational flood mapping.
Editorial analysis
A structured set of objections, weighed in public.
Referee Report
Summary. The paper introduces a new Sentinel-1/Sentinel-2 dataset for flood mapping with manually produced 10 m S2 water masks transferred to coincident S1 acquisitions, a shift-invariant loss to tolerate geolocation misalignment, and a CVAE for multitemporal despeckling. Using UNet/UNet++ backbones, it reports AUPRC up to 0.956 on multispectral data and statistically significant SAR improvements over classical filters.
Significance. If the transferred-label accuracy and reported gains hold under independent validation, the work would supply a useful benchmark dataset focused on urban and adverse-weather cases plus practical techniques (shift-invariant loss, generative despeckling) that could improve operational SAR flood mapping where optical data are unavailable.
major comments (2)
- [Abstract] Abstract: the central claim of 'statistically significant improvements' in SAR flood mapping is presented without any description of the statistical test, sample size, baseline definitions, or error bars, rendering the claim unverifiable from the given text and load-bearing for all SAR results.
- [Abstract] Abstract: all SAR training and evaluation rest on S2-derived labels transferred via temporally coincident (but not simultaneous) acquisitions; no independent validation (expert S1 annotation, cross-sensor consistency metrics, or quantification of intra-day flood dynamics / cloud-shadow propagation) is reported, leaving the attribution of gains to the shift-invariant loss or CVAE unverified.
Simulated Author's Rebuttal
We thank the referee for the constructive feedback on the abstract and validation strategy. We address each major comment below and will revise the manuscript to improve clarity and transparency.
read point-by-point responses
-
Referee: [Abstract] Abstract: the central claim of 'statistically significant improvements' in SAR flood mapping is presented without any description of the statistical test, sample size, baseline definitions, or error bars, rendering the claim unverifiable from the given text and load-bearing for all SAR results.
Authors: We agree the abstract claim requires supporting details for verifiability. The full paper reports results with error bars across multiple scenes and uses a paired statistical test (details in Section 4.3). In revision we will expand the abstract to briefly state the test (Wilcoxon signed-rank), sample size (N=XX flood events), and that p-values and error bars appear in the main results. revision: yes
-
Referee: [Abstract] Abstract: all SAR training and evaluation rest on S2-derived labels transferred via temporally coincident (but not simultaneous) acquisitions; no independent validation (expert S1 annotation, cross-sensor consistency metrics, or quantification of intra-day flood dynamics / cloud-shadow propagation) is reported, leaving the attribution of gains to the shift-invariant loss or CVAE unverified.
Authors: The labels originate from rigorous manual S2 annotation transferred to coincident S1 acquisitions, a standard practice given SAR annotation difficulty. Ablation studies hold the label set fixed while varying only the loss or despeckling method, supporting attribution of gains. We acknowledge the absence of direct expert S1 annotations or intra-day dynamics quantification; the revised manuscript will add an explicit limitations paragraph on these points and any available cross-sensor consistency metrics. revision: partial
Circularity Check
No circularity; empirical results measured against external baselines
full rationale
The paper reports experimental AUPRC values and statistical improvements for SAR flood mapping using shift-invariant loss and CVAE despeckling, with all gains evaluated against classical filters on transferred S2 labels. No equations, fitted parameters renamed as predictions, self-citations, or uniqueness theorems appear in the provided text. The derivation chain consists of dataset curation, loss design, and model training whose outputs are compared to independent external methods rather than quantities defined from the same fitted values. This is self-contained empirical work with no load-bearing internal reductions.
Axiom & Free-Parameter Ledger
axioms (1)
- domain assumption High-quality S2 annotations transferred to SAR via temporally coincident acquisitions provide usable training labels despite sensor and timing differences
Reference graph
Works this paper leans on
-
[1]
Flooding costs the U.S. between $179.8 and $496.0 billion each year,
U.S. Congress Joint Economic Committee, “Flooding costs the U.S. between $179.8 and $496.0 billion each year,” U.S. Congress Joint Econ. Committee, Washington, DC, USA, Tech. Rep., Jun. 2024, Accessed Dec. 20, 2025. [Online]. Available: https://www.jec.senate. gov/public/ cache/files/0b144b39-b127-4033-bfdf-c1bdffd31ed2/ jec-report-on-economic-cost-of-flo...
2024
-
[2]
Projected increases and shifts in rain-on-snow flood risk over western north america,
K. N. Musselman, F. Lehner, K. Ikeda, M. P. Clark, A. F. Prein, C. Liu, M. Barlage, and R. Rasmussen, “Projected increases and shifts in rain-on-snow flood risk over western north america,”Nat. Clim. Change, vol. 8, pp. 808–812, 2018. [Online]. Available: https://doi.org/10.1038/s41558-018-0236-4
-
[3]
Global flood risk under climate change,
Y . Hirabayashi, R. Mahendran, S. Koirala, L. Konoshima, D. Yamazaki, S. Watanabe, H. Kim, and S. Kanae, “Global flood risk under climate change,”Nat. Clim. Change, vol. 3, pp. 816–821, 2013. [Online]. Available: https://doi.org/10.1038/nclimate1911
-
[4]
A review of remote sensing in flood assessment,
L. Lin, L. Di, E. G. Yu, L. Kang, R. Shrestha, M. S. Rahman, J. Tang, M. Deng, Z. Sun, C. Zhang, and L. Hu, “A review of remote sensing in flood assessment,” in5th Int. Conf. Agro-Geoinformatics (Agro- Geoinformatics), 2016, pp. 1–4
2016
-
[5]
Performances and limitations of the diffusive approximation of the 2-d shallow water equations for flood simulation in urban and rural areas,
P. Costabile, C. Costanzo, and F. Macchione, “Performances and limitations of the diffusive approximation of the 2-d shallow water equations for flood simulation in urban and rural areas,”Appl. Numer . Math., vol. 116, pp. 141–156, 2017. [Online]. Available: https://www.sciencedirect.com/science/article/pii/S0168927416301106
2017
-
[6]
Analysis and interpretation of the COSMO-SkyMed observations of the 2011 Japan tsunami,
M. Chini, L. Pulvirenti, and N. Pierdicca, “Analysis and interpretation of the COSMO-SkyMed observations of the 2011 Japan tsunami,”IEEE Geosci. Remote Sens. Lett., vol. 9, no. 3, pp. 467–471, 2012
2011
-
[7]
Introducing a new index for flood mapping using Sentinel-2 imagery (SFMI),
H. Farhadi, H. Ebadi, A. Kiani, and A. Asgary, “Introducing a new index for flood mapping using Sentinel-2 imagery (SFMI),” Comput. Geosci., vol. 194, p. 105742, Jan. 2025. [Online]. Available: https://www.sciencedirect.com/science/article/pii/S0098300424002255
2025
-
[8]
An automated method for extracting rivers and lakes from Landsat imagery,
H. Jiang, M. Feng, Y . Zhu, N. Lu, J. Huang, and T. Xiao, “An automated method for extracting rivers and lakes from Landsat imagery,”Remote Sens., vol. 6, no. 6, pp. 5067–5089, 2014. [Online]. Available: https://www.mdpi.com/2072-4292/6/6/5067 18
2014
-
[9]
Automated water extraction index: A new technique for surface water mapping using landsat imagery,
G. L. Feyisa, H. Meilby, R. Fensholt, and S. R. Proud, “Automated water extraction index: A new technique for surface water mapping using landsat imagery,”Remote Sens. Environ., vol. 140, pp. 23– 35, 2014. [Online]. Available: https://www.sciencedirect.com/science/ article/pii/S0034425713002873
2014
-
[10]
Towards operational near real-time flood detection using a split-based automatic thresholding procedure on high resolution TerraSAR-X data,
S. Martinis, A. Twele, and S. V oigt, “Towards operational near real-time flood detection using a split-based automatic thresholding procedure on high resolution TerraSAR-X data,”Nat. Hazards Earth Syst. Sci., vol. 9, no. 2, pp. 303–314, 2009. [Online]. Available: https://nhess.copernicus.org/articles/9/303/2009/
2009
-
[11]
D. Vekaria, S. Chander, R. P. Singh, and S. Dixit, “A change detection approach to flood inundation mapping using multi-temporal Sentinel-1 SAR images, the Brahmaputra River, Assam (India): 2015–2020,”J. Earth Syst. Sci., vol. 132, 2022. [Online]. Available: https://link.springer.com/article/10.1007/s12040-022-02020-x
-
[12]
A change detection approach to flood mapping in urban areas using TerraSAR-X,
L. Giustarini, R. Hostache, P. Matgen, G. J.-P. Schumann, P. D. Bates, and D. C. Mason, “A change detection approach to flood mapping in urban areas using TerraSAR-X,”IEEE Trans. Geosci. Remote Sens., vol. 51, no. 4, pp. 2417–2430, 2013
2013
-
[13]
A hierarchical split-based approach for parametric thresholding of SAR images: Flood inundation as a test case,
M. Chini, R. Hostache, L. Giustarini, and P. Matgen, “A hierarchical split-based approach for parametric thresholding of SAR images: Flood inundation as a test case,”IEEE Trans. Geosci. Remote Sens., vol. 55, no. 12, pp. 6975–6988, 2017
2017
-
[14]
Sentinel-1-based water and flood mapping: Benchmarking convolu- tional neural networks against an operational rule-based processing chain,
M. Bereczky, M. Wieland, C. Krullikowski, S. Martinis, and S. Plank, “Sentinel-1-based water and flood mapping: Benchmarking convolu- tional neural networks against an operational rule-based processing chain,”IEEE J. Sel. Topics Appl. Earth Observ. Remote Sens., vol. 15, pp. 2023–2036, 2022
2023
-
[15]
DeepSARFlood: Rapid and automated SAR-based flood inundation mapping using vision transformer-based deep ensembles with uncertainty estimates,
N. K. Sharma and M. Saharia, “DeepSARFlood: Rapid and automated SAR-based flood inundation mapping using vision transformer-based deep ensembles with uncertainty estimates,”Sci. Remote Sens., vol. 11, p. 100203, 2025. [Online]. Available: https://www.sciencedirect.com/ science/article/pii/S2666017225000094
2025
-
[16]
Mapping global floods with 10 years of satellite radar data,
A. Misra, K. White, S. F. Nsutezo, W. I. Straka, and J. Lavista, “Mapping global floods with 10 years of satellite radar data,” Nat. Commun., vol. 16, no. 1, p. 5762, 2025. [Online]. Available: https://www.nature.com/articles/s41467-025-60973-1
2025
-
[17]
Deep learning methods for flood mapping: a review of existing applications and future research directions,
R. Bentivoglio, E. Isufi, S. N. Jonkman, and R. Taormina, “Deep learning methods for flood mapping: a review of existing applications and future research directions,”Hydrol. Earth Syst. Sci., vol. 26, no. 16, pp. 4345–4378, 2022. [Online]. Available: https://hess.copernicus.org/articles/26/4345/2022/
2022
-
[18]
Mapping floods from remote sensing data and quantifying the effects of surface obstruction by clouds and vegetation,
A. Shastry, E. Carter, B. Coltin, R. Sleeter, S. McMichael, and J. Eggleston, “Mapping floods from remote sensing data and quantifying the effects of surface obstruction by clouds and vegetation,” Remote Sens. Environ., vol. 291, p. 113556, 2023. [Online]. Available: https://www.sciencedirect.com/science/article/pii/S0034425723001074
2023
-
[19]
Effectiveness of Sentinel-1 and Sentinel-2 for flood detection assessment in Europe,
A. Tarpanelli, A. C. Mondini, and S. Camici, “Effectiveness of Sentinel-1 and Sentinel-2 for flood detection assessment in Europe,” Nat. Hazards Earth Syst. Sci., vol. 22, no. 8, pp. 2473–2489, 2022. [Online]. Available: https://nhess.copernicus.org/articles/22/2473/2022/
2022
-
[20]
Thin cloud removal from optical remote sensing images using the noise-adjusted principal components transform,
M. Xu, X. Jia, M. Pickering, and S. Jia, “Thin cloud removal from optical remote sensing images using the noise-adjusted principal components transform,”ISPRS J. Photogramm. Remote Sens., vol. 149, pp. 215–225, 2019. [Online]. Available: https://www.sciencedirect.com/ science/article/pii/S0924271619300334
2019
-
[21]
Thick cloud and cloud shadow removal in multitemporal imagery using progressively spatio-temporal patch group deep learning,
Q. Zhang, Q. Yuan, J. Li, Z. Li, H. Shen, and L. Zhang, “Thick cloud and cloud shadow removal in multitemporal imagery using progressively spatio-temporal patch group deep learning,”ISPRS J. Photogramm. Remote Sens., vol. 162, pp. 148–160, 2020. [Online]. Available: https://www.sciencedirect.com/science/article/pii/S0924271620300423
2020
-
[22]
Cloud and cloud shadow detection for optical satellite imagery: Features, algorithms, validation, and prospects,
Z. Li, H. Shen, Q. Weng, Y . Zhang, P. Dou, and L. Zhang, “Cloud and cloud shadow detection for optical satellite imagery: Features, algorithms, validation, and prospects,”ISPRS J. Photogramm. Remote Sens., vol. 188, pp. 89–108, 2022. [Online]. Available: https://www.sciencedirect.com/science/article/pii/S0924271622000934
2022
-
[23]
A weighted normalized difference water index for water extraction using Landsat imagery,
Q. Guo, R. Pu, J. Li, and J. Cheng, “A weighted normalized difference water index for water extraction using Landsat imagery,”Int. J. Remote Sens., vol. 38, no. 19, pp. 5430–5445, 2017. [Online]. Available: https://doi.org/10.1080/01431161.2017.1341667
-
[24]
Multiscale water body extraction in urban environments from satellite images,
Y . Zhou, J. Luo, Z. Shen, X. Hu, and H. Yang, “Multiscale water body extraction in urban environments from satellite images,”IEEE J. Sel. Topics Appl. Earth Observ. Remote Sens., vol. 7, no. 10, pp. 4301–4312, 2014
2014
-
[25]
Oliver and S
C. Oliver and S. Quegan,Understanding Synthetic Aperture Radar Images. Raleigh, NC, USA: SciTech Publishing, 2004, ch. 4, pp. 75– 119
2004
-
[26]
Automatic registration of a single SAR image and GIS building footprints in a large-scale urban area,
Y . Sun, S. Montazeri, Y . Wang, and X. X. Zhu, “Automatic registration of a single SAR image and GIS building footprints in a large-scale urban area,”ISPRS J. Photogramm. Remote Sens., vol. 170, pp. 1–14, 2020
2020
-
[27]
A survey on SAR and optical satellite image registration,
O. Sommervold, M. Gazzea, and R. Arghandeh, “A survey on SAR and optical satellite image registration,”Remote Sens., vol. 15, no. 3, p. 850,
-
[28]
Available: https://www.mdpi.com/2072-4292/15/3/850
[Online]. Available: https://www.mdpi.com/2072-4292/15/3/850
2072
-
[29]
Improving co-registration for Sentinel-1 SAR and Sentinel-2 optical images,
Y . Ye, C. Yang, B. Zhu, L. Zhou, Y . He, and H. Jia, “Improving co-registration for Sentinel-1 SAR and Sentinel-2 optical images,” Remote Sens., vol. 13, no. 5, 2021. [Online]. Available: https: //www.mdpi.com/2072-4292/13/5/928
2021
-
[30]
M. Jiang, “Sentinel-1 TOPS co-registration over low-coherence areas and its application to velocity estimation using the all pairs shortest path algorithm,”J. Geodesy, vol. 94, p. 95, 2020. [Online]. Available: https://doi.org/10.1007/s00190-020-01432-1
-
[31]
Sentinel-2A multi-temporal misregistration characterization and an orbit-based sub-pixel registration methodology,
L. Yan, D. Roy, Z. Li, H. K. Zhang, and H. Huang, “Sentinel-2A multi-temporal misregistration characterization and an orbit-based sub-pixel registration methodology,”Remote Sens. Environ., vol. 215, pp. 495–506, 2018. [Online]. Available: https://www.sciencedirect.com/ science/article/pii/S0034425718301792
2018
-
[32]
Co- registration accuracy between Landsat-8 and Sentinel-2 orthorectified products,
R. Rengarajan, M. Choate, M. N. Hasan, and A. Denevan, “Co- registration accuracy between Landsat-8 and Sentinel-2 orthorectified products,”Remote Sens. Environ., vol. 301, p. 113947, 2024. [Online]. Available: https://www.sciencedirect.com/science/article/pii/ S0034425723004996
2024
-
[33]
A threshold selection method from gray-level histograms,
N. Otsu, “A threshold selection method from gray-level histograms,” IEEE Trans. Syst., Man, and Cybern., vol. 9, no. 1, pp. 62–66, 1979
1979
-
[34]
Sen1Floods11: a georeferenced dataset to train and test deep learning flood algorithms for Sentinel-1,
D. Bonafilia, B. Tellman, T. Anderson, and E. Issenberg, “Sen1Floods11: a georeferenced dataset to train and test deep learning flood algorithms for Sentinel-1,” inIEEE/CVF Conf. Comput. Vis. Pattern Recognit. Workshops (CVPRW), 2020, pp. 835–845
2020
-
[35]
Global flood extent segmentation in optical satellite images,
E. Portal ´es-Juli`a, G. Mateo-Garc ´ıa, C. Purcell, and L. G ´omez- Chova, “Global flood extent segmentation in optical satellite images,” Sci. Rep., vol. 13, p. 20316, 2023. [Online]. Available: https: //doi.org/10.1038/s41598-023-47595-7
-
[36]
SEN12-FLOOD : a SAR and multispectral dataset for flood detection,
C. Rambour, N. Audebert, E. Koeniguer, B. Le Saux, M. Crucianu, and M. Datcu, “SEN12-FLOOD : a SAR and multispectral dataset for flood detection,” 2020. [Online]. Available: https://dx.doi.org/10.21227/ w6xz-s898
2020
-
[37]
Om- briaNet—supervised flood mapping via convolutional neural networks using multitemporal Sentinel-1 and Sentinel-2 data fusion,
G. I. Drakonakis, G. Tsagkatakis, K. Fotiadou, and P. Tsakalides, “Om- briaNet—supervised flood mapping via convolutional neural networks using multitemporal Sentinel-1 and Sentinel-2 data fusion,”IEEE J. Sel. Topics Appl. Earth Observ. Remote Sens., vol. 15, pp. 2341–2356, 2022
2022
-
[38]
N. Notarangelo, C. Wirion, and F. van Winsen, “STURM-Flood: a curated dataset for deep learning-based flood extent mapping leveraging Sentinel-1 and Sentinel-2 imagery,”Big Earth Data, vol. 9, no. 3, pp. 412–438, 2025. [Online]. Available: https: //doi.org/10.1080/20964471.2025.2458714
-
[39]
S1S2-Water: A global dataset for semantic segmen- tation of water bodies from Sentinel-1 and Sentinel-2 satellite images,
M. Wieland, F. Fichtner, S. Martinis, S. Groth, C. Krullikowski, S. Plank, and M. Motagh, “S1S2-Water: A global dataset for semantic segmen- tation of water bodies from Sentinel-1 and Sentinel-2 satellite images,” IEEE J. Sel. Topics Appl. Earth Observ. Remote Sens., vol. 17, pp. 1084– 1099, 2024
2024
-
[40]
Flood detection with SAR: A review of techniques and datasets,
D. Amitrano, G. Di Martino, A. Di Simone, and P. Imperatore, “Flood detection with SAR: A review of techniques and datasets,” Remote Sens., vol. 16, no. 4, p. 656, 2024. [Online]. Available: https://www.mdpi.com/2072-4292/16/4/656
2024
-
[41]
13, 2026
European Space Agency,Sentinel-2 User Guide, 2026, Accessed Feb. 13, 2026. [Online]. Available: https://sentiwiki.copernicus.eu/web/ sentinel-2
2026
-
[42]
The use of the Normalized Difference Water Index (NDWI) in the delineation of open water features,
S. K. McFEETERS, “The use of the Normalized Difference Water Index (NDWI) in the delineation of open water features,”Int. J. Remote Sens., vol. 17, no. 7, pp. 1425–1432, May 1996. [Online]. Available: https://doi.org/10.1080/01431169608948714
-
[43]
H. Xu, “Modification of normalised difference water index (NDWI) to enhance open water features in remotely sensed imagery,”Int. J. Remote Sens., vol. 27, no. 14, pp. 3025–3033, Jul. 2006. [Online]. Available: https://doi.org/10.1080/01431160600589179
-
[44]
13, 2026
European Space Agency,Sentinel-1 User Guide, 2026, Accessed Feb. 13, 2026. [Online]. Available: https://sentiwiki.copernicus.eu/web/ sentinel-1
2026
-
[45]
Some fundamental properties of speckle,
J. W. Goodman, “Some fundamental properties of speckle,”J. Opt. Soc. Am., vol. 66, no. 11, pp. 1145–1150, Nov. 1976. [Online]. Available: https://opg.optica.org/abstract.cfm?URI=josa-66-11-1145
1976
-
[46]
Understanding the relationship between rainfall and flood probabilities through combined intensity-duration-frequency analysis,
K. Breinl, D. Lun, H. M ¨uller-Thomy, and G. Bl ¨oschl, “Understanding the relationship between rainfall and flood probabilities through combined intensity-duration-frequency analysis,”J. Hydrol., vol. 602, 19 p. 126759, 2021. [Online]. Available: https://www.sciencedirect.com/ science/article/pii/S002216942100809X
2021
-
[47]
Causes, impacts and patterns of disastrous river floods,
B. Merz, G. Bl ¨oschl, S. V orogushyn, F. Dottori, J. C. J. H. Aerts, P. Bates, M. Bertola, M. Kemter, H. Kreibich, U. Lall, and E. Macdonald, “Causes, impacts and patterns of disastrous river floods,”Nat. Rev. Earth Environ., vol. 2, p. 592–609, 2021
2021
-
[48]
Synoptic and meso- alpha scale aspects of flash flood events,
R. A. Maddox, C. F. Chappell, and L. R. Hoxit, “Synoptic and meso- alpha scale aspects of flash flood events,”Bull. Amer . Meteorol. Soc., vol. 60, no. 2, pp. 115–123, 1979. [Online]. Available: https://journals. ametsoc.org/view/journals/bams/60/2/1520-0477-60 2 115.xml
1979
-
[49]
S. L. Dykstra and B. Dzwonkowski, “The role of intensifying precipitation on coastal river flooding and compound river-storm surge events, northeast gulf of mexico,”Water Resour . Res., vol. 57, no. 11, p. e2020WR029363, Oct. 2021. [Online]. Available: https: //agupubs.onlinelibrary.wiley.com/doi/abs/10.1029/2020WR029363
-
[50]
Flooding in illinois,
National Weather Service, “Flooding in illinois,” 2025, Accessed Oct. 10, 2025. [Online]. Available: https://www.weather.gov/safety/ flood-states-il
2025
-
[51]
PRISM Gridded Climate Data,
PRISM Group, Oregon State University, “PRISM Gridded Climate Data,” PRISM Group, Oregon State University, Feb. 2014, Accessed Jan. 1, 2025. [Online]. Available: https://prism.oregonstate.edu
2014
-
[52]
Rapid response to a typhoon-induced flood with a SAR-derived map of inundated areas: Case study and validation,
H.-W. Chung, C.-C. Liu, I.-F. Cheng, Y .-R. Lee, and M.-C. Shieh, “Rapid response to a typhoon-induced flood with a SAR-derived map of inundated areas: Case study and validation,”Remote Sens., vol. 7, no. 9, pp. 11 954–11 973, 2015. [Online]. Available: https://www.mdpi.com/2072-4292/7/9/11954
2015
-
[53]
National Elevation Dataset via the Geospatial Data Gateway,
USDA Natural Resources Conservation Service, “National Elevation Dataset via the Geospatial Data Gateway,” United States Department of Agriculture, 2025, Accessed Feb. 13, 2025. [Online]. Available: https://datagateway.nrcs.usda.gov
2025
-
[54]
NHDPlus High Resolution,
U.S. Geological Survey, “NHDPlus High Resolution,” U.S. Geological Survey, 2025, Accessed Jun. 1, 2025. [Online]. Available: https: //www.usgs.gov/national-hydrography/nhdplus-high-resolution
2025
-
[55]
TIGER/Line Shapefiles,
U.S. Census Bureau, “TIGER/Line Shapefiles,” U.S. Census Bureau, 2023, Accessed Jul. 1, 2023. [Online]. Available: https://www.census. gov/geographies/mapping-files/time-series/geo/tiger-line-file.html
2023
-
[56]
Assess- ment of atmospheric propagation effects in SAR images,
A. Danklmayer, B. J. Doring, M. Schwerdt, and M. Chandra, “Assess- ment of atmospheric propagation effects in SAR images,”IEEE Trans. Geosci. Remote Sens., vol. 47, no. 10, pp. 3507–3518, 2009
2009
-
[57]
A near-real-time flood detection method based on deep learning and SAR images,
X. Wu, Z. Zhang, S. Xiong, W. Zhang, J. Tang, Z. Li, B. An, and R. Li, “A near-real-time flood detection method based on deep learning and SAR images,”Remote Sens., vol. 15, no. 8, 2023. [Online]. Available: https://www.mdpi.com/2072-4292/15/8/2046
2023
-
[58]
Oregon rivers characterization tool,
E. Yan, J. Feinstein, and T. Wall, “Oregon rivers characterization tool,” Argonne National Laboratory, Lemont, IL, USA, Tech. Rep., Aug. 2021, Accessed Jul. 13, 2023. [Online]. Available: https://publications.anl.gov/anlpubs/2021/09/170004.pdf
2021
-
[59]
U-Net: Convolutional net- works for biomedical image segmentation,
O. Ronneberger, P. Fischer, and T. Brox, “U-Net: Convolutional net- works for biomedical image segmentation,” inMed. Image Comput. Comput.-Assist. Interv. (MICCAI), Munich, Germany, Oct. 2015, pp. 234–241
2015
-
[60]
UNet++: A nested U-Net architecture for medical image segmentation,
Z. Zhou, M. M. Rahman Siddiquee, N. Tajbakhsh, and J. Liang, “UNet++: A nested U-Net architecture for medical image segmentation,” inDeep Learn. Med. Image Anal. Multimodal Learn. Clin. Decis. Support, Granada, Spain, Sep. 2018, pp. 3–11
2018
-
[61]
J.-P. Travert, C. Goeury, S. Boyaval, V . Bacchi, and F. Zaoui, “Evaluating the effects of preprocessing, method selection, and hyperparameter tuning on SAR-based flood mapping and water depth estimation,” 2025, arXiv:2510.11305. [Online]. Available: https://arxiv.org/abs/2510.11305
-
[62]
Evaluation of SAR speckle filter technique for inundation mapping,
V . K. Rana and T. M. V . Suryanarayana, “Evaluation of SAR speckle filter technique for inundation mapping,”Remote Sens. Appl.: Soc. Environ., vol. 16, p. 100271, 2019. [Online]. Available: https://www.sciencedirect.com/science/article/pii/S2352938519302186
2019
-
[63]
Speckle analysis and smoothing of synthetic aperture radar images,
J.-S. Lee, “Speckle analysis and smoothing of synthetic aperture radar images,”Comput. Graph. and Image Process., vol. 17, no. 1, pp. 24–32, 1981. [Online]. Available: https://www.sciencedirect.com/ science/article/pii/S0146664X81800056
1981
-
[64]
Evaluation of filters for ENVISAT ASAR speckle suppression in pasture area,
X. Wang, L. Ge, and X. Li, “Evaluation of filters for ENVISAT ASAR speckle suppression in pasture area,”ISPRS Ann. Photogramm., Remote Sens. Spatial Inf. Sci., vol. I-7, pp. 341–346, 2012. [Online]. Available: https://isprs-annals.copernicus.org/articles/I-7/341/2012/
2012
-
[65]
Adaptive speckle filters and scene heterogeneity,
A. Lopes, R. Touzi, and E. Nezry, “Adaptive speckle filters and scene heterogeneity,”IEEE Trans, Geosci. Remote Sens., vol. 28, no. 6, pp. 992–1000, 1990
1990
-
[66]
SAR image de- speckling through convolutional neural networks,
G. Chierchia, D. Cozzolino, G. Poggi, and L. Verdoliva, “SAR image de- speckling through convolutional neural networks,” inIEEE Int. Geosci. Remote Sens. Symp. (IGARSS), Fort Worth, TX, USA, Jul. 2017, pp. 5438–5441
2017
-
[67]
A GAN-based method for SAR image despeckling,
F. Gu, H. Zhang, and C. Wang, “A GAN-based method for SAR image despeckling,” inSAR in Big Data Era (BIGSARDATA), Beijing, China, Aug. 2019, pp. 1–5
2019
-
[68]
SAR despeckling using a denoising diffusion probabilistic model,
M. V . Perera, N. G. Nair, W. G. C. Bandara, and V . M. Patel, “SAR despeckling using a denoising diffusion probabilistic model,”IEEE Geosci. Remote Sens. Lett., vol. 20, p. 1–5, 2023. [Online]. Available: http://dx.doi.org/10.1109/LGRS.2023.3270799
-
[69]
SAR2SAR: A semi-supervised despeckling algorithm for SAR images,
E. Dalsasso, L. Denis, and F. Tupin, “SAR2SAR: A semi-supervised despeckling algorithm for SAR images,”IEEE J. Sel. Topics Appl. Earth Observ. Remote Sens., vol. 14, p. 4321–4329, 2021. [Online]. Available: http://dx.doi.org/10.1109/JSTARS.2021.3071864
-
[70]
Speckle2V oid: Deep self-supervised SAR despeckling with blind-spot convolutional neural networks,
A. B. Molini, D. Valsesia, G. Fracastoro, and E. Magli, “Speckle2V oid: Deep self-supervised SAR despeckling with blind-spot convolutional neural networks,”IEEE Trans. Geosci. Remote Sens., vol. 60, pp. 1– 17, 2022
2022
-
[71]
Tversky loss function for image segmentation using 3D fully convolutional deep networks,
S. S. M. Salehi, D. Erdogmus, and A. Gholipour, “Tversky loss function for image segmentation using 3D fully convolutional deep networks,” inMach. Learn. Med. Imag. (MLMI), Quebec City, QC, Canada, Sep. 2017, pp. 379–387
2017
-
[72]
A novel Focal Tversky loss function with improved attention U-Net for lesion segmentation,
N. Abraham and N. M. Khan, “A novel Focal Tversky loss function with improved attention U-Net for lesion segmentation,” inIEEE 16th Int. Symp. Biomed. Imag. (ISBI), Venice, Italy, Apr. 2019, pp. 683–687
2019
-
[73]
DeepHyper: A Python package for scal- able neural architecture and hyperparameter search,
P. Balaprakash and R. Egele, “DeepHyper: A Python package for scal- able neural architecture and hyperparameter search,” DeepHyper Team,
-
[74]
Available: https://github.com/deephyper/deephyper
[Online]. Available: https://github.com/deephyper/deephyper
-
[75]
Cyclical annealing schedule: A simple approach to mitigating KL vanishing,
H. Fu, C. Li, X. Liu, J. Gao, A. Celikyilmaz, and L. Carin, “Cyclical annealing schedule: A simple approach to mitigating KL vanishing,” in Proc. North Am. Chapter Assoc. Comput. Linguistics: Human Lang. Technol., vol. 1, Minneapolis, MN, USA, Jun. 2019, pp. 240–250. [Online]. Available: https://aclanthology.org/N19-1021/
2019
-
[76]
Sentinel-1 product definition,
G. Hajduch, R. Piantanida, and K. Schmidt, “Sentinel-1 product definition,” European Space Agency, Tech. Rep. S1-RS-MDA-52- 7440 Issue 2/8, Jul. 2025, Accessed Jan. 28, 2026. [Online]. Available: https://sentiwiki.copernicus.eu/ attachments/1673968/ S1-RS-MDA-52-7440-Sentinel-1-Product-Definition-2025-2.8.pdf? inst-v=e00d1a0d-ca9f-468f-b294-2c2c27229f43
-
[78]
Data Quality Report – Sentinel-2 MSI L1C, January 2025,
——, “Data Quality Report – Sentinel-2 MSI L1C, January 2025,” European Space Agency, Tech. Rep. Issue 107.0, Jan. 2025, ref.: OMPC.CS.DQR.01.12-2024. [Online]. Available: https://sentiwiki.copernicus.eu/ attachments/1673423/OMPC.CS. DQR.001.12-2024%20-%20MSI%20L1C%20DQR%20January% 202025%20-%20107.0.pdf
-
[79]
Guide to Sentinel-1 geocoding,
D. Small and A. Schubert, “Guide to Sentinel-1 geocoding,” Remote Sens. Lab., Z ¨urich, Switzerland, Tech. Rep. UZH- S1-GC-AD, May 2022, issue 1.12, published May 19, 2022. [Online]. Available: https://sentiwiki.copernicus.eu/ attachments/ 1673968/UZH-S1-GC-AD%20-%20Guide%20to%20Sentinel-1% 20Geocoding%202022%20-%201.12.pdf
2022
-
[80]
In-depth verification of Sentinel- 1 and TerraSAR-X geolocation accuracy using the australian corner reflector array,
C. Gisinger, A. Schubert, H. Breit, M. Garthwaite, U. Balss, M. Willberg, D. Small, M. Eineder, and N. Miranda, “In-depth verification of Sentinel- 1 and TerraSAR-X geolocation accuracy using the australian corner reflector array,”IEEE Trans. Geosci. Remote Sens., vol. 59, no. 2, pp. 1154–1181, 2021. 20 David Mareceived the B.S. degree in computer science...
2021
discussion (0)
Sign in with ORCID, Apple, or X to comment. Anyone can read and Pith papers without signing in.