REVIEW 3 major objections 4 minor 8 references
Odderon Exchange in Elastic Proton-Proton and Proton-Antiproton Scattering at TeV Energies
T0 review · 3 major / 4 minor · reviewed 2026-08-07 · deepseek-v4-flash
Pith's one-line read The dissertation claims that a model-dependent analysis of TeV-energy elastic proton-proton and proton-antiproton differential cross sections closes the energy gap between the two channels and reveals t-channel odderon exchange at…
desk verdict A careful, candid dissertation that consolidates an already-published model-dependent odderon claim; the evidence is real but the discovery-level language outruns the assumptions. read the letter →
The pith
A machine-rendered reading of the paper's core claim, the machinery that carries it, and where it could break.
The reading
What carries the argument
The load-bearing object is the ReBB model, an s-channel eikonal construction in which the inelastic overlap function is built from all single and multiple binary quark–diquark collisions following the diffractive multiple-scattering approach, and the elastic amplitude is reconstructed from $s$-channel unitarity. The model's four free parameters are the scale parameters $R_q$, $R_d$, $R_{qd}$ (the quark radius, diquark radius, and quark–diquark separation) and the opacity parameter $\alpha_R$, which sets the imaginary part of the opacity function, $\mathrm{Im}\,\Omega(s,b) = -\alpha_R\, \tilde\sigma_{\rm in}(s,b)$, and thereby controls the real part of the amplitude and the depth of the diffractive minimum. The decisive move is baryon-antibaryon symmetry: the scale parameters are assumed identical for $pp$ and $p\bar p$ at a given $\sqrt{s}$, so any difference between the channels must be carried by $\alpha_R$ alone. The odderon signal is precisely this difference, extracted by closing the energy gap between the Tevatron $p\bar p$ measurement at 1.96 TeV and the LHC $pp$ measurement at 2.76 TeV.
What would settle it
Measure elastic $pp$ and $p\bar p$ differential cross sections at the same center-of-mass energy in the TeV range — for example a shared $\sqrt{s}$ near 2 or 7 TeV — and check whether the model-extrapolated dip-region difference appears without any model assumption. Within the model, a decisive test is to release the baryon-antibaryon symmetry and fit $R_q$, $R_d$, $R_{qd}$ separately for each channel: if free scale parameters absorb the difference so that $\alpha_R$ no longer splits significantly, the odderon claim would collapse, whereas if the scales stay equal within errors while $\alpha_R$ still differs, the discovery-level claim would be confirmed.
Extended reading notes
Core claim
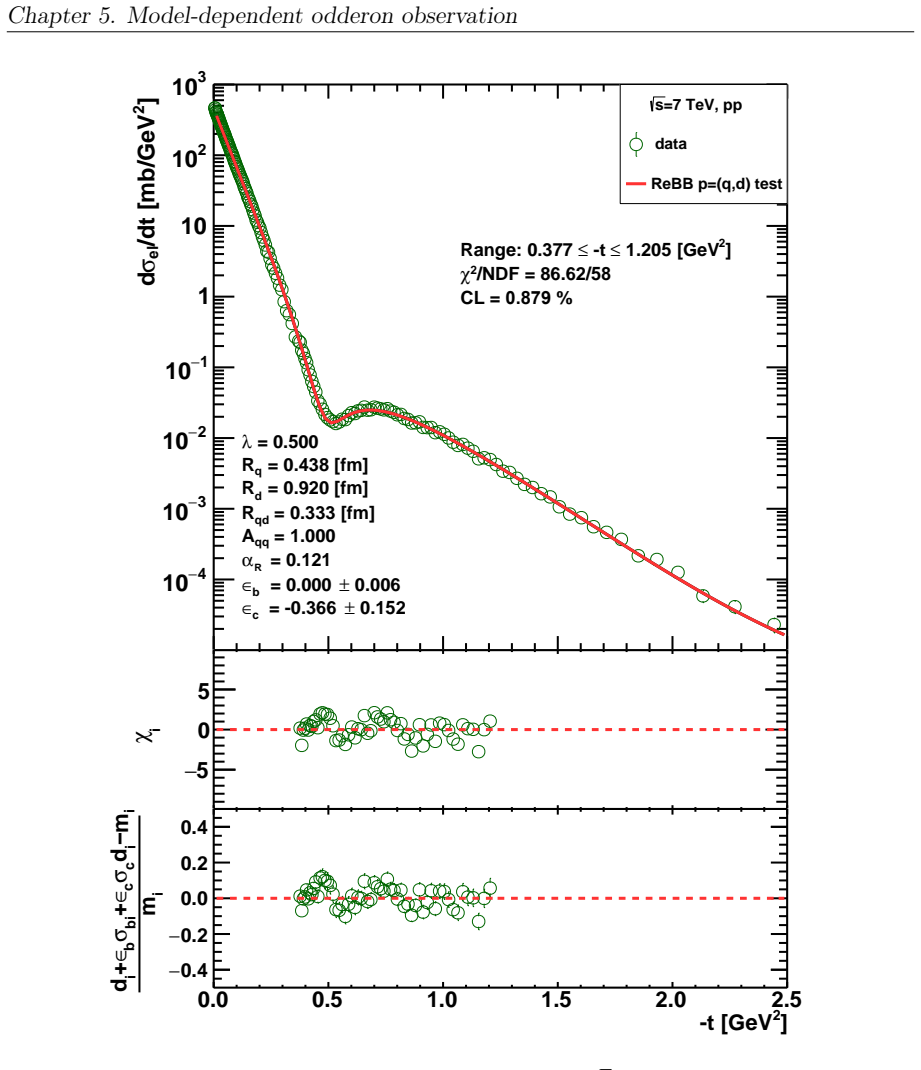
The central claim, stated as the author would state it to a fair reader, is that the t-channel odderon has been observed, model-dependently, in elastic hadronic scattering at TeV energies. The argument runs through the ReBB model, where the proton is a quark–diquark composite and the elastic amplitude is built from diffractive multiple-scattering theory with a unitary real part controlled by the opacity parameter $\alpha_R$. Fitting the model to $p\bar p$ data at $\sqrt{s}=0.546$ TeV and 1.96 TeV and to $pp$ data at 2.76 TeV and 7 TeV in the common range $0.38\lesssim -t\lesssim 1.2$ GeV$^2$, the dissertation finds statistically acceptable descriptions (CL $\geq$ 0.1%) only when the scale parameters $R_q$, $R_d$, $R_{qd}$ are shared between channels while $\alpha_R$ is free to differ. The consequence is a statistically significant difference between the $pp$ and $p\bar p$ differential cross sections at the same energy in precisely the region of the diffractive minimum, and in the TeV domain only a crossing-odd exchange can produce such a difference. A preliminary version of the analysis reports a $4.06\sigma$ ReBB estimate and a $6.04\sigma$ dipole-Regge estimate at 1.96 TeV; the final refined ReBB analysis is claimed at discovery-level significance, which the dissertation states as the model-dependent observation of t-channel odderon exchange.
Load-bearing premise
The load-bearing premise is that the ReBB model's geometric scale parameters $R_q$, $R_d$, $R_{qd}$ are identical in proton-proton and proton-antiproton scattering at the same energy, so the whole measured difference between the channels is attributed to the opacity parameter $\alpha_R$ and declared an odderon signal.
Editorial extensions
If this is right
- If the claim is right, the diffractive minimum–maximum structure measured in proton-proton scattering at LHC energies and the shoulder-like, filled-in structure of proton-antiproton scattering are one and the same crossing-odd effect, rather than an artifact of comparing data taken at different energies.
- The H(x) scaling of elastic $pp$ data across the dip-bump region, and its absence in $p\bar p$ data, becomes interpretable as a direct odderon signature, since without a crossing-odd amplitude the two channels would scale identically.
- Channel differences in forward observables follow as predictions: the model yields $\rho_0$ curves and a t-dependent slope $B(s,t)$ that crosses zero for $pp$ while remaining positive for $p\bar p$ at the same TeV energy.
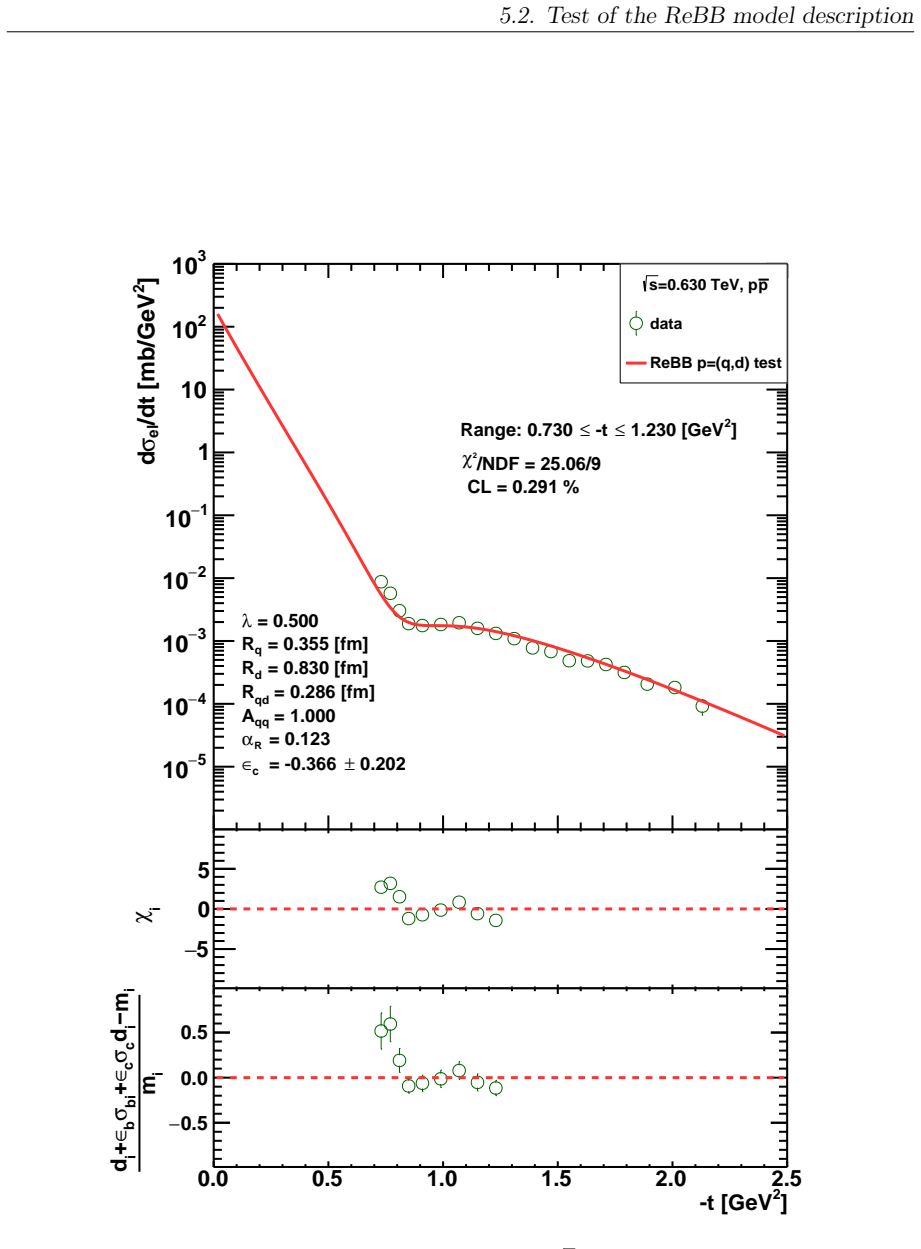
- The model's common energy-dependence curves for the scale parameters predict the $pp$ and $p\bar p$ differential cross sections at energies not used in the fits (0.63, 1.8, and 8 TeV), and the dissertation checks that these are reproduced with CL $\geq$ 0.1%.
- The final ReBB analysis converts the earlier model-independent and functional-form extrapolations into a physically motivated, unitary model statement that the TeV-region difference between $pp$ and $p\bar p$ is due to odderon exchange.
Reading between the lines
- The load-bearing symmetry assumption could be tested directly: if a fit that lets the scale parameters $R_q$, $R_d$, $R_{qd}$ float independently for $pp$ and $p\bar p$ still leaves the channels sharing identical scales while $\alpha_R$ splits, the odderon interpretation holds; if the scales themselves absorb the difference, the interpretation weakens.
- The dissertation itself reports that the ReBB model fails to describe the most precise 13 TeV proton-proton data (confidence level near $10^{-11}$%), so the discovery-level claim is most defensible across the 0.546–7 TeV window; extending it to 13 TeV would require a model that also reproduces the observed hollowness of the interaction profile.
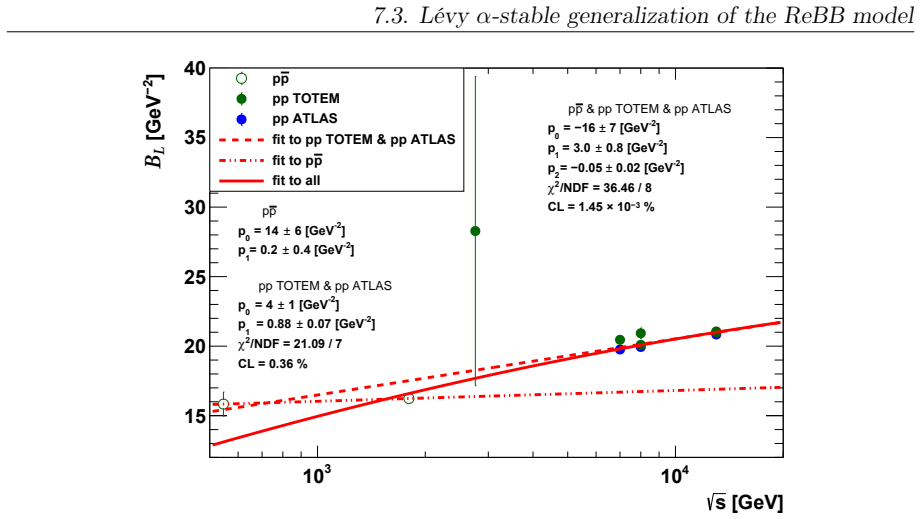
- A natural cross-check is the L\'evy $\alpha$-stable generalization of the ReBB model developed in the final chapter: repeating the odderon analysis with stable rather than Gaussian constituent densities would show whether the $\geq 5\sigma$ signal survives a change in the model's geometric assumptions.
- If the extracted odderon amplitude connects to perturbative QCD, its t-dependence at higher momentum transfer could be compared with the three-gluon-exchange power-law prediction, linking this soft-scattering result to the diagrammatic odderon.
Editorial analysis
A structured set of objections, weighed in public.
Referee Report
Summary. This manuscript is a PhD dissertation presenting a model-dependent search for the t-channel odderon in elastic proton-proton (pp) and proton-antiproton (pbar-p) scattering at TeV energies, primarily through the real-extended Bialas-Bzdak (ReBB) model. Chapter 2 generalizes the ReBB model from pp to pbar-p scattering and fits the available pbar-p d(sigma_el)/dt data from ISR to Tevatron energies. Chapter 3 closes the energy gap between the D0 pbar-p data at 1.96 TeV and the TOTEM pp data at 2.76 TeV, reporting preliminary odderon signals of 4.06 sigma (ReBB) and 6.04 sigma (dipole Regge model). Chapter 4 refines the systematic-error treatment with a PHENIX-style chi2, fits the ReBB model at 0.546, 1.96, 2.76, and 7 TeV in a common window 0.38 < -t < 1.2 GeV^2, and finds that the scale parameters R_q, R_d, R_qd lie on common energy trends for pp and pbar-p while the opacity parameter alpha_R evolves differently in the two channels. Chapter 5 converts this difference into the central claim: a model-dependent observation of t-channel odderon exchange at discovery-level significance. Chapters 6 and 7 study the H(x) scaling limit of the ReBB model and a Levy alpha-stable generalization. The central claim is conditional on (i) the baryon-antibaryon symmetry assumption that the scale parameters are common to pp and pbar-p while alpha_R carries the full channel difference, and (ii) the exclusion of the 13 TeV TOTEM data, which the model fails to describe in the same |t| window.
Significance. If the ReBB-model result is taken at face value, it is a quantitatively detailed, falsifiable, model-dependent input to the odderon question: it concentrates the crossing-odd effect in a single parameter (alpha_R), predicts a channel difference in the t-dependent slope (Fig. 3.10), validates the calibrated model out-of-fit on the 630 GeV and 1.8 TeV pbar-p data and the 8 TeV pp data (Sec. 5.2), and transparently reports its own failures, most notably on the 13 TeV TOTEM dataset (Fig. 4.5). The error treatment of Sec. 4.1 (Eq. 4.1) is careful and includes point-to-point correlated type-b and normalization type-c systematics, and the author explicitly documents corrections of the NDF bookkeeping relative to Ref. [88]. These are genuine strengths, and the dissertation is honest in labeling the central claim 'model-dependent.' The significance of the work is nevertheless bounded by the same facts: the 'discovery-level' significance is internal to the ReBB parameterization under an untested common-geometry assumption, and the same model fails on the most precise pp dataset in exactly the |t| window used for the signal.
major comments (3)
- [Section 2.2; Section 4.3; Chapter 5.] The identification of the entire pp vs. pbar-p difference with the opacity parameter alpha_R is load-bearing and is not tested against the alternative of channel-dependent geometry. Section 2.2 asserts, on the basis of baryon-antibaryon symmetry, that R_q, R_d, and R_qd take the same values in pp and pbar-p at a given energy, leaving alpha_R as the only channel-dependent parameter. Section 4.3 then shows that the scale parameters from the separate single-channel fits (Table 4.1) lie on common energy-dependent curves (CL 32.65%-79.10%, Figs. 4.6-4.8). Compatibility with a common curve is only a necessary condition: d(sigma_el)/dt depends on the scale parameters through sigma_in(b) (Eqs. 1.101-1.112), so a channel-dependent R_qd or R_d could generate a pp vs. pbar-p difference at fixed alpha_R, and such a difference would not be a crossing-odd t-channel exchange and would not constitute an odderon. The manuscript never compares the two hypotheses, for example by a joint fit of (R common, alpha_R split) against (R split, alpha_R common). The discovery-level significance quoted in Chapter 5 is computed with the common-geometry assumption imposed and does not reflect this degeneracy. The two-hypothesis comparison should be performed, or the Chapter 5 claim should be explicitly restricted to the ReBB model with the baryon-antibaryon symmetry assumption.
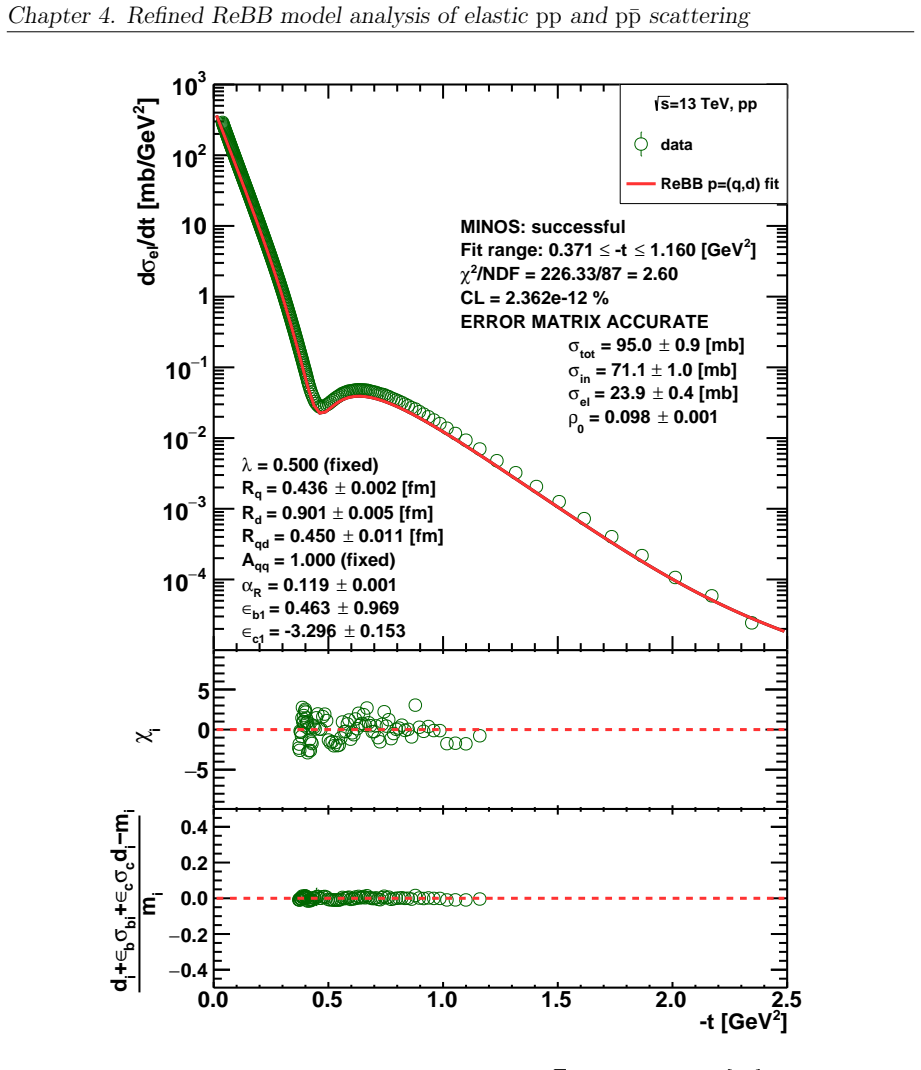
- [Section 4.2, Fig. 4.5; Section 5.2.] The ReBB model fails to describe the 13 TeV TOTEM pp data in exactly the |t| window used for the odderon signal: CL = 2.36 x 10^-12% in Fig. 4.5 (the text quotes 3.17 x 10^-11%), many orders of magnitude below the manuscript's own 0.1% acceptance threshold (Section 1.9). This dataset is excluded from the final analysis, and the suggested explanation (a hollowness effect, Refs. [140,141]) is not implemented in the model. The pull on the type-c normalization factor in Fig. 4.5, epsilon_c1 = -3.30 +/- 0.15, shows that the tension is not confined to isolated outlier points. Because the energy trends of R_q and R_d (Figs. 4.6-4.7) are the vehicle for extrapolating the pp cross section to 1.96 TeV, the model's failure at the highest and most precise pp energy should be propagated into the uncertainty of the Chapter 5 significance. As it stands, the model's validity domain is largely defined by the data it can describe (0.546-7 TeV, and at 7 TeV only the higher-|t| subset, where the fit is marginal at CL = 1.83%), and the discovery-level claim is quoted relative to that selected domain. A quantitative sensitivity study of the Chapter 5 result under inclusion or exclusion of the 13 TeV data and of the low-|t| 7 TeV data is needed.
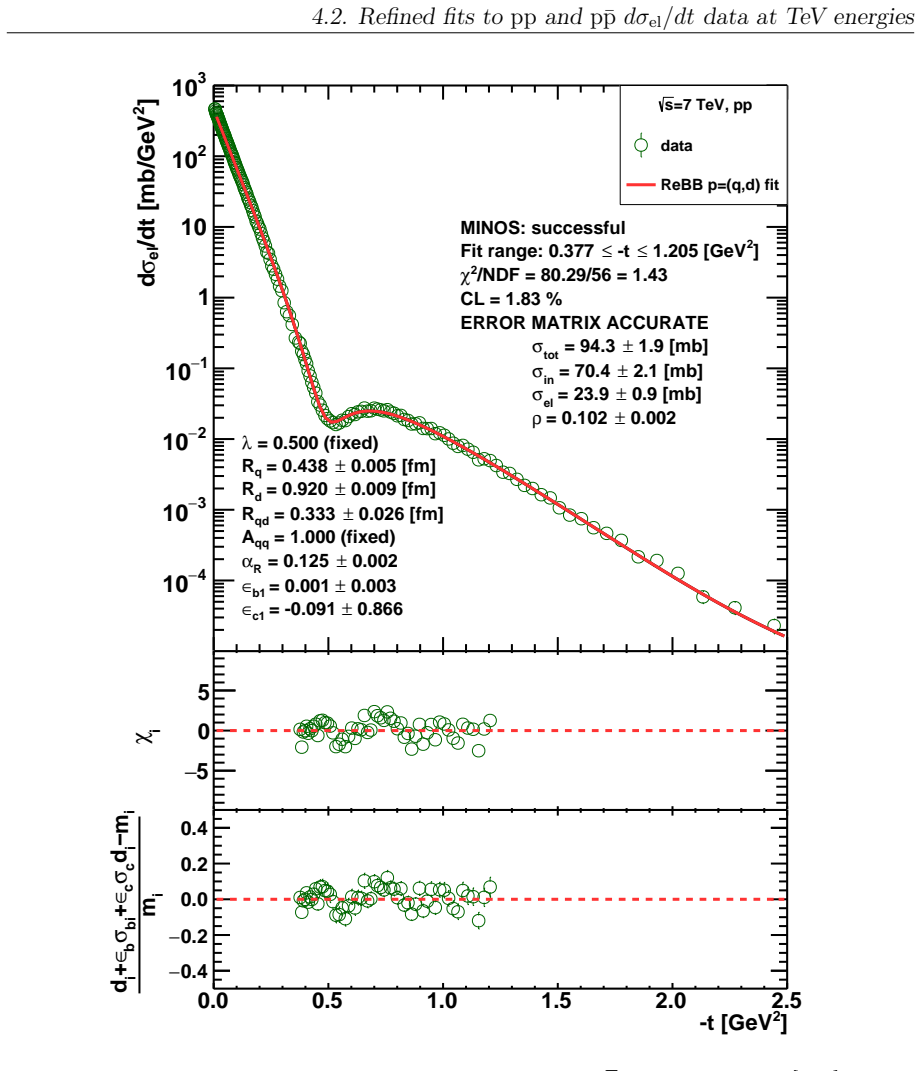
- [Section 4.3, Eq. (4.15), Fig. 4.10; Section 4.2 (1.96 TeV fit).] The alpha_R trends that constitute the odderon signal rest on very few points and partly on external pseudo-data. The pbar-p trend is determined from alpha_R values at only two energies (0.546 and 1.96 TeV, Table 4.1), and because no sigma_tot or rho_0 measurements exist at 1.96 TeV, that fit uses the COMPETE predictions for sigma_tot and rho_0 as pseudo-data (Section 4.2); the fitted alpha_R = 0.163 +/- 0.005 is therefore partly anchored to a theoretical model rather than to measured data. The pp trend is likewise determined from two points (2.76 and 7 TeV). Section 2.2's earlier finding that the pbar-p alpha_R values are also consistent with a constant (alpha_R = 0.132 +/- 0.006, CL = 0.89%) shows how fragile the rising pbar-p trend is across analysis choices; Chapters 2 and 4 use different chi2 treatments, and the dissertation does not reconcile their different conclusions about the pbar-p alpha_R slope. The rho_0-rescaling used to add information (Eq. 4.15, Fig. 4.10) relies on the small-alpha_R expansion Eqs. (4.9)-(4.10) and yields ratios with large uncertainties (for example rho_0/alpha_R = 0.815 +/- 0.730 at 7 TeV), so it can only weakly discriminate the trends. Because Section 5.2 shows that the calibrated model describes the 630 GeV and 1.8 TeV pbar-p datasets with CL >= 0.1%, those datasets should be included in a joint trend fit, and the stability of the quoted significance under that change should be reported.
minor comments (4)
- [Section 4.2 and Fig. 4.5.] The confidence level for the 13 TeV fit is quoted as 3.17 x 10^-11% in the text and 2.362 x 10^-12% in the figure; these differ by more than an order of magnitude and should be reconciled.
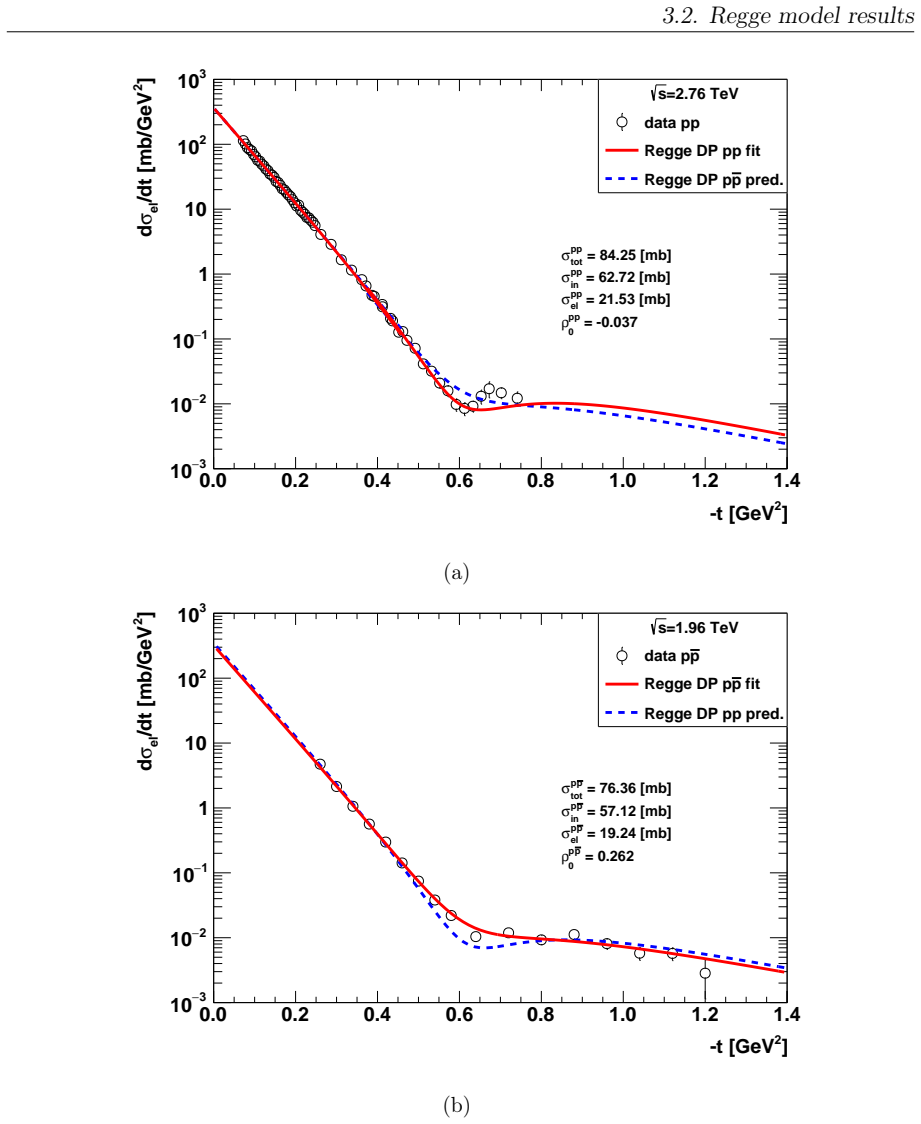
- [Chapter 3, Figs. 3.9 and 3.11-3.13.] The 1.96 TeV pp curve in Fig. 3.9 is constructed from scale parameters fitted to the 1.96 TeV pbar-p data, with only alpha_R taken from the pp trend; calling this an 'extrapolation' or 'prediction' of the pp cross section overstates what is computed. Wording such as 'model-based cross-channel comparison' would be more accurate wherever the pp curve is generated from pbar-p-calibrated geometry.
- [Abstract, Preface, and Section 5.] The abstract ('ultimately led to the discovery of odderon exchange') and the Preface ('my contribution to the discovery of the t-channel odderon') use unconditional discovery language, while the analysis itself is labeled model-dependent and the contested status of the odderon evidence is acknowledged only briefly (Section 1.6.2, Refs. [64,65]). Aligning the summary statements with the conditional formulation of the central claim would make the dissertation internally consistent.
- [Section 1.9.] The reported significances are computed as the CL of single tests, but the dissertation presents significances from two models (ReBB and dipole Regge), after rejecting the 13 TeV dataset, and for several |t|-range choices; the number of effective trials is not discussed. A sentence on trial factors, or an explicit statement that the 0.38-1.2 GeV^2 window and the models were fixed a priori, would help calibrate the reported 5 sigma claims.
Circularity Check
No significant circularity: the odderon significance follows from nested ReBB-model fits to external pp and pbar-p data; the baryon-symmetry assumption is a stated model assumption, not a definitional shortcut.
full rationale
The dissertation's central odderon claim is based on comparing ReBB-model fits to independent pp and pbar-p differential cross section data, not on fitting a parameter and then renaming it as a prediction. The model's opacity parameter alpha_R is introduced in Eq. (1.111) and is fitted separately to pp and pbar-p data; the energy-dependence analysis in Section 4.3 then finds that the scale parameters Rq, Rd, Rqd are compatible with common curves while 'the opacity parameter, alpha_R, is the only ReBB model parameter whose energy evolution is not compatible with the same curve in elastic pp and pbar-p processes.' This is a nested-model comparison: one hypothesis uses a common alpha_R, the other allows separate pp and pbar-p values, and the statistical significance is computed from the change in chi-square. That is a standard hypothesis test and not circular. The preliminary Chapter 3 extrapolation also uses parameters determined from other datasets (pp alpha_R trend from 2.76 and 7 TeV, scale parameters from 1.96 TeV pbar-p data), so it is an out-of-sample comparison rather than a fitted-input-called-prediction. The assumption that Rq, Rd, Rqd are equal in pp and pbar-p at the same sqrt(s) is explicitly stated as a physical expectation from baryon-antibaryon symmetry, not as a consequence of the data or of the odderon definition; if that assumption were relaxed, the interpretation could change, but this is a model-dependence limitation, not a circular derivation. The self-citations to prior ReBB and H(x) papers are normal references to the model's origin; the model itself is refitted and tested against external data in this dissertation, including a documented failure at 13 TeV (CL = 3.17e-11%), which shows the analysis is falsifiable rather than forced. Therefore no step in the claimed derivation reduces by construction to its own inputs.
Assumptions & free parameters
free parameters (6)
- R_q =
0.35 to 0.45 fm depending on energy and channel
- R_d =
0.7 to 0.95 fm
- R_qd =
0.2 to 0.5 fm, often fixed at 0.267 fm
- alpha_R (pp) =
~0.12, compatible with constant
- alpha_R (pbar-p) =
0.117 at 546 GeV to 0.163 at 1.96 TeV
- Dipole Regge model parameters =
e.g., bP=22.3, epsilonP=0.03, aO=34.5, bO=8.5, epsilonO=1.5
assumptions (6)
- standard math Crossing symmetry and analyticity of scattering amplitudes allow relating pp and pbar-p amplitudes.
- domain assumption Mesonic Reggeon exchanges are negligible at TeV energies.
- domain assumption The ReBB model (quark-diquark structure, Glauber multiple scattering) is a valid description of elastic pp and pbar-p scattering.
- ad hoc to paper Scale parameters Rq, Rd, Rqd are identical for pp and pbar-p at the same energy (baryon-antibaryon symmetry).
- ad hoc to paper H(x) scaling of pp data holds beyond low-|t| and can be used for energy extrapolation.
- ad hoc to paper The odderon amplitude in the dipole Regge model has the same functional form as the pomeron amplitude with A_O = (1/i) A_P.
Cite this review
Pith. "Pith review of Odderon Exchange in Elastic Proton-Proton and Proton-Antiproton Scattering at TeV Energies." pith.science (2026). https://pith.science/paper/45K3QSFV
@misc{pith2026250522790,
  author       = {Pith},
  title        = {Pith review of: Odderon Exchange in Elastic Proton-Proton and Proton-Antiproton Scattering at TeV Energies},
  year         = {2026},
  howpublished = {\url{https://pith.science/paper/45K3QSFV}},
  note         = {Machine review of arXiv:2505.22790}
}
abstract
The odderon, a leading crossing-odd $t$-channel exchange, was first proposed by L. Lukaszuk and B. Nicolescu in 1973, but its existence remained elusive for 48 years. Elastic proton-proton scattering measurements at CERN's Large Hadron Collider (LHC) and elastic proton-antiproton scattering measurements at FNAL's Tevatron, performed at TeV-scale center-of-mass energies ($\sqrt{s}$) and over wide ranges of squared four-momentum transfer ($t$), opened new opportunities to study the physics of elastic hadronic processes which ultimately led to the discovery of odderon exchange in the nonperturbative domain of strong interactions, as detailed in this dissertation. In quantum chromodynamics (QCD), the fundamental theory of strong interactions, the odderon is described in the perturbative regime as a $t$-channel exchange of an odd number of interacting gluons.
Figures


Figures from the paper (86 more)













Reference graph
Works this paper leans on
-
[198]
Multiple Diffraction Theory of p¯p Scattering at 546-GeV
R. J. Glauber and J. Velasco. “Multiple Diffraction Theory of p¯p Scattering at 546-GeV”.Phys. Lett. B147 (1984), pp. 380–384.doi: 10.1016/0370-2693(84)9 0137-0
-
[199]
Multiple diffraction theory of pp and pp elastic scattering
R. J. Glauber and J. Velasco. “Multiple diffraction theory of pp and pp elastic scattering” (1988). url: https://cds.cern.ch/record/186995
work page 1988
-
[200]
E. Pike and P. Sabatier.Scattering: Scattering and Inverse Scattering in Pure and Applied Science. Vol.2. Academic Press, 2002.isbn: 9780126137606
work page 2002
-
[201]
A. Davydov. Quantum Mechanics. A-W series in advanced physics. Pergamon Press, 1976. isbn: 9780080204383
work page 1976
-
[202]
Theory of high energy hadron-nucleus collisions
R. J. Glauber. “Theory of high energy hadron-nucleus collisions”. High-Energy Physics and Nuclear Structure: Proceedings of the Third International Confer- ence on High Energy Physics and Nuclear Structure sponsored by the International Union of Pure and Applied Physics, held at Columbia University, New York City, September 8–12, 1969. Springer, pp. 207–264
work page 1969
-
[203]
V. V. Uchaikin and V. M. Zolotarev.Chance and stability: stable distributions and their applications. Walter de Gruyter, 2011
work page 2011
- [204]
-
[205]
W. R. Inc. Mathematica, Version 14.0. Champaign, IL, 2024.url: https://www .wolfram.com/mathematica. 201 Short summary of my PhD Dissertation Odderon Exchange in Elastic Proton-Proton and Proton-Antiproton Scattering at TeV Energies István Szanyi Supervisor: Tamás Csörgő, D.Sc., Member of Academia Europaea Co-supervisor: Máté Csanád, D.Sc. Elastic proton-...
work page 2024
Reviewed August 7, 2026 · model on record in the stance chip above.
Discussion (0). Continue with ORCID to comment.