REVIEW 4 major objections 5 minor 1 cited by
Improving the accuracy of automated labeling of specimen images datasets via a confidence-based process
T0 review · 4 major / 5 minor · reviewed 2026-08-12 · deepseek-v4-flash
Pith's one-line read Rejecting low-confidence labels can lift a seemingly subpar image classifier to human-level annotation accuracy.
desk verdict A solid applied use of a decades-old rejection trick with a genuinely strong external validation in the Gallinat replication, but the abstract overstates the tables and the deployed 600k labels lack an independent accuracy check. read the letter →
The pith
A machine-rendered reading of the paper's core claim, the machinery that carries it, and where it could break.
The reading
What carries the argument
The load-bearing device is the accuracy/coverage trade-off curve, a simplified risk/coverage analysis that maps each minimum softmax confidence threshold to the accuracy of accepted labels and the fraction of data retained. The softmax probability for the predicted class serves as the confidence score; predictions below a user-chosen threshold are rejected rather than labeled. This converts the classifier's top-1 score into a tunable operating point, and the paper's embedding analysis indicates that rejected low-confidence samples sit near the class boundary, so rejection effectively enlarges the decision margin.
What would settle it
Human-annotate a random sample of specimens from the 600,000-image collection, apply the paper's chosen confidence threshold to the model's predictions on that sample, and compare the accepted labels' accuracy with the validation-set curve; if the accuracy is materially lower, the threshold does not transfer to the unlabeled collection.
Extended reading notes
Core claim
The central claim is that even a seemingly subpar softmax classifier can produce research-grade labels when low-confidence predictions are discarded. The paper validates this on four custom binary classifiers (budding, flowering, fruiting, non-reproductive) and on an off-the-shelf multi-class model, showing in each case that accuracy rises monotonically with the confidence threshold while coverage falls. The accuracy/coverage curves built on a validation set let a user pick a threshold that meets a target accuracy, and the authors show that the replication of a human-annotated phenology study becomes unreliable at the naive threshold but closely matches the original conclusions at a high threshold. This is presented as a practical, model-agnostic way to move automatic labeling from unusable to valuable for large digitized collections.
Load-bearing premise
The accuracy and rejection rates measured on the validation set are assumed to hold on the far larger unlabeled target dataset, even though the target may differ in image quality, species composition, or collection style.
Editorial extensions
If this is right
- A model that looks too inaccurate from its top-1 accuracy alone can still be used for research when data is abundant enough to absorb the reduced coverage.
- Researchers can select a confidence threshold to match the accuracy demands of a given study, or use the pipeline to auto-label the confident fraction and hand-label only the rest.
- The same thresholding procedure works for off-the-shelf multi-class classifiers, suggesting it applies across architectures and image domains.
- The released 600,000-specimen dataset with per-label confidences lets ecologists perform their own analyses at any accuracy-coverage operating point.
Reading between the lines
- An implication the paper leaves implicit is that the validation-set accuracy/coverage curves transfer only if the unlabeled target images resemble the validation images; a collection with different preparation styles or species composition would need its own threshold calibration.
- The rejection step reorders predictions but cannot correct errors the model makes confidently; a misplaced but high-confidence label passes the threshold and becomes research data.
- A natural extension, consistent with the paper's pipeline, is to send the rejected low-confidence subset to human annotators, recovering full coverage while keeping the high-confidence labels automatic.
- Because the 600k-specimen flowering analyses inherit the model's labeling biases, such as the fruiting-maturity mismatch the paper acknowledges in the replication, trait-level conclusions should be interpreted with that bias in mind.
Signed reviews
Editorial analysis
A structured set of objections, weighed in public.
Referee Report
Summary. The paper proposes a confidence-based rejection pipeline for softmax classifiers: predictions whose maximum softmax probability falls below a user-chosen threshold are discarded, trading coverage for higher accuracy on the remaining labels. The authors train four binary Xception classifiers for herbarium phenophases (budding, flowering, fruiting, non-reproductive), show accuracy/coverage curves on a 20% validation split, and demonstrate that at thresholds near 0.99 the validation accuracy is close to human-level accuracy reported in the literature. They replicate a published fruiting-phenology study (Gallinat et al., 2018) and obtain a native–invasive fruiting difference of 25 days versus the original 26 days. They also apply the approach to an off-the-shelf iNaturalist classifier and report a 600k-specimen annotated herbarium dataset, used for a macrophenological analysis of flowering-time shifts. The dataset is shared on Zenodo.
Significance. If the claims are supported, the work has practical value for biodiversity informatics: it offers a simple, interpretable way to convert low-accuracy deep classifiers into usable annotation tools, and it provides a large publicly released trait-labeled herbarium dataset. The external replication of Gallinat et al. is a genuine strength, as is the demonstration on an unrelated multi-class model. The paper does not claim any new machine-learning method; its contribution is empirical validation and a deployed pipeline. However, the strength of the central claim is currently undermined by evaluation on the same validation set used for threshold selection, an unsupported abstract accuracy figure, and a final ecological analysis that deliberately uses the low-confidence (50%) labels, creating an apparent inconsistency with the paper's headline message.
major comments (4)
- [Abstract and Table I] The abstract states that a naive model with 86% initial accuracy can achieve 'over 99% accuracy (rejecting about 65%)'. Table I does not support this: at a 99% minimum confidence it reports Budding 98.3% (77% rejection), Flowering 98.6% (70%), Fruiting 98.0% (77%), and Non-Reproductive 98.6% (48%). None of these exceed 99%, and the rejection rates are not 'about 65%'. Please either correct the abstract to match the reported numbers, or provide the specific threshold and model for which the 'over 99% / about 65%' claim holds.
- [Section V-A and Table I / Fig. 3] All accuracy/coverage curves, Table I, and the thresholds used later (e.g., 0.99) are computed on the same 20% validation split, and the text in Section III-A selects thresholds from those curves and then reports accuracy on that same split. There is no held-out test set. Selecting a threshold on the validation set and reporting validation accuracy at that threshold is a form of selection on the evaluation data and is likely to yield optimistic estimates. Please add an independent test set (or cross-validation) for reporting the accuracy at selected thresholds, or use the 15,000 manually annotated specimens described in Section V-D1 to report accuracy at the deployment thresholds.
- [Sections V-B and V-D] The replication study provides strong external evidence for the fruiting classifier on images from similar New England herbaria, but it does not test the budding, flowering, or reproductive classifiers, nor the 600k Consortium of Northeastern Herbaria (CNH) target distribution. The 15,000 manually annotated specimens from the CNH dataset (Section V-D1) are used only for the slope-error-versus-sample-size analysis (Fig. 17), not to report classification accuracy at the thresholds used for deployment. Consequently, the claim that the 600k labels are 'research-grade' is not quantitatively supported. Please add an accuracy/coverage evaluation on a held-out labeled subset from the CNH corpus, or explicitly limit the research-grade claim to the settings that were actually validated.
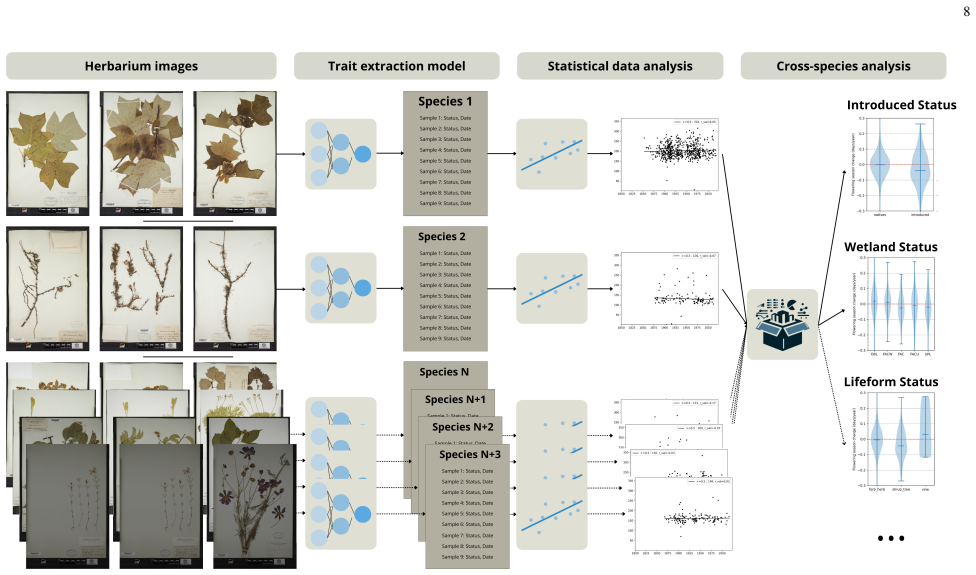
- [Sections V-D1 and V-D2] The macrophenology analysis of flowering-time shifts uses the 50% confidence threshold by design ('always use the estimate from the 50% minimum threshold'), which corresponds to the low-accuracy, zero-rejection operating point (e.g., Flowering 86.3% in Table V). This conflicts with the paper's central message that high-confidence thresholds are required for reliable annotations. The stated justification, based on Fig. 17, is that slope error depends more on sample size than on threshold; however, that analysis covers only 20 species and 15,000 manual annotations and does not show that 50%-threshold labels are research-grade. Please reconcile this choice with the paper's claims, either by presenting the 600k analysis as a study of regression robustness to label noise or by applying confidence thresholding in that analysis as well.
minor comments (5)
- [Table II caption] The caption reads 'EXPENDED ACCURACY RESULTS'; it should be 'EXTENDED ACCURACY RESULTS'.
- [Section V-A, Fig. 15 references] In the 'Underlying mechanism insights' paragraph, references to 'Fig. V-A(a)' and 'Fig. V-A(b)' should be 'Fig. 15(a)' and 'Fig. 15(b)'.
- [Table III] The row for nativity reads 'non-native vs non-natives'; it should read 'non-native vs native'.
- [Section V-D2] The text refers to 'Welsh's T-test'; the correct name is 'Welch's t-test'.
- [Section III-A] The sentence 'at the cost of reducing the annotation coverage down to 30% (on average on our custom models)' is ambiguous: it is unclear whether coverage is reduced to 30% or rejection is 30%. Please clarify the relationship between the human-accuracy figure and the coverage/accuracy curve.
Circularity Check
No significant circularity: accuracy/coverage gains are measured empirically on held-out validation data and checked against external benchmarks.
full rationale
The central derivation chain is empirical rather than definitional: four binary Xception classifiers are trained on 80% of the NEVP dataset and evaluated on the held-out 20% split, so the accuracy/coverage curves and Table I are measurements of model behavior rather than quantities forced by the choice of threshold. The reported 'human-level' accuracy is therefore not a fitted parameter renamed as a prediction; it is a measured accuracy on validation data. The strongest check against circularity is the external replication in Section III-B: a threshold of 0.99 is read off the validation curve and then applied to a newly queried set of roughly 16,000 CNH specimens, reproducing the native/invasive fruiting DoY difference as 25 days versus the study's 26 days, an out-of-sample prediction. The 15,000 manually annotated specimens in Section V-D1 provide another independent ground truth used to characterize slope error versus sample size. Self-citations such as [6], which includes co-author Sweeney, are used only to compare base-level accuracy and are not load-bearing for the central claim. The remaining concerns, namely that thresholds are selected from the same validation curves used to report accuracy and that deployment to 600,000 CNH specimens involves possible distribution shift, are evaluation-leak and external-validity risks rather than circular reductions; Section II even acknowledges that softmax probabilities are 'usually only usable on in-distribution inputs.' No prediction in the paper reduces to its own input by construction.
Assumptions & free parameters
free parameters (3)
- confidence threshold =
0.50 to 0.99 (user-selected)
- minimum samples per species for regression =
75
- minimum samples before/after 1950 =
37
assumptions (3)
- domain assumption Validation set is representative of target unlabeled herbarium images (in-distribution assumption)
- domain assumption Rejected low-confidence samples do not introduce systematic bias into phenological regressions
- domain assumption Human labels used as ground truth are correct enough to serve as accuracy targets
Cite this review
Pith. "Pith review of Improving the accuracy of automated labeling of specimen images datasets via a confidence-based process." pith.science (2026). https://pith.science/paper/45YBLGAH
@misc{pith2026241110074,
  author       = {Pith},
  title        = {Pith review of: Improving the accuracy of automated labeling of specimen images datasets via a confidence-based process},
  year         = {2026},
  howpublished = {\url{https://pith.science/paper/45YBLGAH}},
  note         = {Machine review of arXiv:2411.10074}
}
read the original abstract
The digitization of natural history collections over the past three decades has unlocked a treasure trove of specimen imagery and metadata. There is great interest in making this data more useful by further labeling it with additional trait data, and modern deep learning machine learning techniques utilizing convolutional neural nets (CNNs) and similar networks show particular promise to reduce the amount of required manual labeling by human experts, making the process much faster and less expensive. However, in most cases, the accuracy of these approaches is too low for reliable utilization of the automatic labeling, typically in the range of 80-85% accuracy. In this paper, we present and validate an approach that can greatly improve this accuracy, essentially by examining the confidence that the network has in the generated label as well as utilizing a user-defined threshold to reject labels that fall below a chosen level. We demonstrate that a naive model that produced 86% initial accuracy can achieve improved performance - over 95% accuracy (rejecting about 40% of the labels) or over 99% accuracy (rejecting about 65%) by selecting higher confidence thresholds. This gives flexibility to adapt existing models to the statistical requirements of various types of research and has the potential to move these automatic labeling approaches from being unusably inaccurate to being an invaluable new tool. After validating the approach in a number of ways, we annotate the reproductive state of a large dataset of over 600,000 herbarium specimens. The analysis of the results points at under-investigated correlations as well as general alignment with known trends. By sharing this new dataset alongside this work, we want to allow ecologists to gather insights for their own research questions, at their chosen point of accuracy/coverage trade-off.
Figures


Figures from the paper (11 more)




Forward citations
Cited by 1 Pith paper
-
PEFT A2Z: Parameter-Efficient Fine-Tuning Survey for Large Language and Vision Models
A survey that organizes PEFT methods into additive, selective, reparameterized, hybrid, and unified families, but with no new method or verified experiments.
Reference graph
Works this paper leans on
-
[1]
Deep learning as a tool for ecology and evolution,
M. L. Borowiec, R. B. Dikow, P. B. Frandsen, A. McKeeken, G. Valentini, and A. E. White, “Deep learning as a tool for ecology and evolution,” Methods in Ecology and Evolution , vol. 13, no. 8, pp. 1640–1660, 2022
work page 2022
-
[2]
Application of deep learning in ecological resource research: Theories, methods, and challenges,
Q. Guo, S. Jin, M. Li, Q. Yang, K. Xu, Y . Ju, J. Zhang, J. Xuan, J. Liu, Y . Su et al. , “Application of deep learning in ecological resource research: Theories, methods, and challenges,” Science China Earth Sciences , vol. 63, no. 10, pp. 1457–1474, 2020
work page 2020
-
[3]
Applications for deep learning in ecology,
S. Christin, ´E. Hervet, and N. Lecomte, “Applications for deep learning in ecology,” Methods in Ecology and Evolution , vol. 10, no. 10, pp. 1632–1644, 2019
work page 2019
-
[4]
Going deeper in the automated identification of herbarium specimens,
J. Carranza-Rojas, H. Goeau, P. Bonnet, E. Mata-Montero, and A. Joly, “Going deeper in the automated identification of herbarium specimens,” BMC evolutionary biology , vol. 17, no. 1, pp. 1–14, 2017
work page 2017
-
[5]
Leafnet: A computer vision system for automatic plant species identification,
P. Barr´e, B. C. St ¨over, K. F. M ¨uller, and V . Steinhage, “Leafnet: A computer vision system for automatic plant species identification,” Ecological Informatics, vol. 40, pp. 50–56, 2017
work page 2017
-
[6]
T. Lorieul, K. D. Pearson, E. R. Ellwood, H. Go ¨eau, J.-f. Molino, P. W. Sweeney, J. M. Yost, J. Sachs, E. Mata-Montero, G. Nelson et al., “Toward a large-scale and deep phenological stage annotation of herbarium specimens: Case studies from temperate, tropical, and equatorial floras,” Applications in Plant Sciences , vol. 7, no. 3, p. e01233, 2019
work page 2019
-
[7]
D. Chen, K. Neumann, S. Friedel, B. Kilian, M. Chen, T. Altmann, and C. Klukas, “Dissecting the phenotypic components of crop plant growth and drought responses based on high-throughput image analysis,” The plant cell , vol. 26, no. 12, pp. 4636–4655, 2014
work page 2014
-
[8]
C. DeChant, T. Wiesner-Hanks, S. Chen, E. L. Stewart, J. Yosinski, M. A. Gore, R. J. Nelson, and H. Lipson, “Automated identification of northern leaf blight-infected maize plants from field imagery using deep learning,” Phytopathology, vol. 107, no. 11, pp. 1426– 1432, 2017
work page 2017
Show all 80 references
-
[9]
Automatically identifying, counting, and describing wild animals in camera-trap images with deep learning,
M. S. Norouzzadeh, A. Nguyen, M. Kosmala, A. Swanson, M. S. Palmer, C. Packer, and J. Clune, “Automatically identifying, counting, and describing wild animals in camera-trap images with deep learning,” Proceedings of the National Academy of Sciences , vol. 115, no. 25, pp. E57...
2018
-
[10]
A deep active learning system for species identification and counting in camera trap images,
M. S. Norouzzadeh, D. Morris, S. Beery, N. Joshi, N. Jojic, and J. Clune, “A deep active learning system for species identification and counting in camera trap images,” Methods in ecology and evolution, vol. 12, no. 1, pp. 150–161, 2021
2021
-
[11]
Robust ecological analysis of camera trap data labelled by a machine learning model,
R. C. Whytock, J. ´Swie˙zewski, J. A. Zwerts, T. Bara-Słupski, A. F. Koumba Pambo, M. Rogala, L. Bahaa-el din, K. Boekee, S. Brittain, A. W. Cardoso et al., “Robust ecological analysis of camera trap data labelled by a machine learning model,” Methods in Ecology and Evolution,...
2021
-
[12]
A first step towards automated species recognition from camera trap images of mammals using ai in a european temperate forest,
M. Choi ´nski, M. Rogowski, P. Tynecki, D. P. Kuijper, M. Churski, and J. W. Bubnicki, “A first step towards automated species recognition from camera trap images of mammals using ai in a european temperate forest,” in Computer Information Systems and Industrial Management: 20...
2021
-
[13]
Machine learning- based estimation of forest carbon stocks to increase transparency of forest preservation efforts,
B. L ¨utjens, L. Liebenwein, and K. Kramer, “Machine learning- based estimation of forest carbon stocks to increase transparency of forest preservation efforts,” arXiv preprint arXiv:1912.07850 , 2019
1912 arXiv
-
[14]
Digitization and the future of natural history collections,
B. P. Hedrick, J. M. Heberling, E. K. Meineke, K. G. Turner, C. J. Grassa, D. S. Park, J. Kennedy, J. A. Clarke, J. A. Cook, D. C. Blackburn et al. , “Digitization and the future of natural history collections,” BioScience, vol. 70, no. 3, pp. 243–251, 2020
2020
-
[15]
GBIF: Global Biodiversity Information Facility,
“GBIF: Global Biodiversity Information Facility,” https://www.gbif. org/
-
[16]
idigbio as a resource for the digitization of a billion biodiversity research specimens,
D. Paul, A. R. Mast, G. Riccardi, and G. Nelson, “idigbio as a resource for the digitization of a billion biodiversity research specimens,” in TDWG 2013 ANNUAL CONFERENCE , 2013
2013
-
[17]
Phenology models using herbarium specimens are only slightly improved by using finer-scale stages of reproduction,
E. R. Ellwood, R. B. Primack, C. G. Willis, and J. HilleRisLambers, “Phenology models using herbarium specimens are only slightly improved by using finer-scale stages of reproduction,” Applications in plant sciences , vol. 7, no. 3, p. e01225, 2019
2019
-
[18]
Maximizing human effort for analyzing scientific images: A case study using digitized herbarium sheets,
L. Brenskelle, R. P. Guralnick, M. Denslow, and B. J. Stucky, “Maximizing human effort for analyzing scientific images: A case study using digitized herbarium sheets,” Applications in plant sciences, vol. 8, no. 6, p. e11370, 2020
2020
-
[19]
On optimum recognition error and reject tradeoff,
C. Chow, “On optimum recognition error and reject tradeoff,” IEEE Transactions on information theory, vol. 16, no. 1, pp. 41–46, 1970
1970
-
[20]
Accuracy-rejection curves (arcs) for comparing classification methods with a reject option,
M. S. A. Nadeem, J.-D. Zucker, and B. Hanczar, “Accuracy-rejection curves (arcs) for comparing classification methods with a reject option,” in Machine Learning in Systems Biology . PMLR, 2009, pp. 65–81
2009
-
[21]
Ad- dressing failure prediction by learning model confidence,
C. Corbi `ere, N. Thome, A. Bar-Hen, M. Cord, and P. P ´erez, “Ad- dressing failure prediction by learning model confidence,” Advances in Neural Information Processing Systems , vol. 32, 2019
2019
-
[22]
To trust or not to trust a classifier,
H. Jiang, B. Kim, M. Guan, and M. Gupta, “To trust or not to trust a classifier,” Advances in neural information processing systems , vol. 31, 2018
2018
-
[23]
Selective classification for deep neural networks,
Y . Geifman and R. El-Yaniv, “Selective classification for deep neural networks,” Advances in neural information processing systems , vol. 30, 2017
2017
-
[24]
Macrophenology: insights into the broad-scale patterns, drivers, and consequences of phenology,
A. S. Gallinat, E. R. Ellwood, J. M. Heberling, A. J. Miller-Rushing, W. D. Pearse, and R. B. Primack, “Macrophenology: insights into the broad-scale patterns, drivers, and consequences of phenology,” American journal of botany , vol. 108, no. 11, pp. 2112–2126, 2021
2021
-
[25]
Herbarium specimens demonstrate earlier flowering times in response to warming in boston,
D. Primack, C. Imbres, R. B. Primack, A. J. Miller-Rushing, and P. Del Tredici, “Herbarium specimens demonstrate earlier flowering times in response to warming in boston,” American journal of botany, vol. 91, no. 8, pp. 1260–1264, 2004
2004
-
[26]
Global warming and flowering times in thoreau’s concord: a community perspective,
A. J. Miller-Rushing and R. B. Primack, “Global warming and flowering times in thoreau’s concord: a community perspective,” Ecology, vol. 89, no. 2, pp. 332–341, 2008
2008
-
[27]
Record-breaking early flowering in the eastern united states,
E. R. Ellwood, S. A. Temple, R. B. Primack, N. L. Bradley, and C. C. Davis, “Record-breaking early flowering in the eastern united states,” PloS one, vol. 8, no. 1, p. e53788, 2013
2013
-
[28]
Climate change and flowering phenology in worcester county, massachusetts,
R. I. Bertin, “Climate change and flowering phenology in worcester county, massachusetts,” International journal of plant sciences , vol. 176, no. 2, pp. 107–119, 2015
2015
-
[29]
Climate change and flowering phenology in franklin county, massachusetts1,
——, “Climate change and flowering phenology in franklin county, massachusetts1,” The Journal of the Torrey Botanical Society , vol. 144, no. 2, pp. 153–169, 2017
2017
-
[30]
Phenological response to climate change in china: a meta-analysis,
Q. Ge, H. Wang, and J. Dai, “Phenological response to climate change in china: a meta-analysis,” Global change biology , vol. 21, no. 1, pp. 265–274, 2015
2015
-
[31]
Fingerprints of global warming on wild animals and plants,
T. L. Root, J. T. Price, K. R. Hall, S. H. Schneider, C. Rosenzweig, and J. A. Pounds, “Fingerprints of global warming on wild animals and plants,” Nature, vol. 421, no. 6918, pp. 57–60, 2003
2003
-
[32]
Favorable climate change response explains non-native species’ success in thoreau’s woods,
C. G. Willis, B. R. Ruhfel, R. B. Primack, A. J. Miller-Rushing, J. B. Losos, and C. C. Davis, “Favorable climate change response explains non-native species’ success in thoreau’s woods,” PloS one, vol. 5, no. 1, p. e8878, 2010
2010
-
[33]
Herbarium specimens reveal the footprint of climate change on flowering trends across north-central north america,
K. M. Calinger, S. Queenborough, and P. S. Curtis, “Herbarium specimens reveal the footprint of climate change on flowering trends across north-central north america,” Ecology letters, vol. 16, no. 8, pp. 1037–1044, 2013
2013
-
[34]
Herbarium specimens show patterns of fruiting phenology in native and invasive plant species across new england,
A. S. Gallinat, L. Russo, E. K. Melaas, C. G. Willis, and R. B. Primack, “Herbarium specimens show patterns of fruiting phenology in native and invasive plant species across new england,” American Journal of Botany , vol. 105, no. 1, pp. 31–41, 2018
2018
-
[35]
Bbn network for inaturalist competition,
A. Saviolo, “Bbn network for inaturalist competition,” https://github. com/AlessandroSaviolo/iNaturalist-2019, 2020
2019
-
[36]
Photographs and herbarium specimens as tools to document phenological changes in response to global warming,
A. J. Miller-Rushing, R. B. Primack, D. Primack, and S. Mukunda, “Photographs and herbarium specimens as tools to document phenological changes in response to global warming,” American journal of botany , vol. 93, no. 11, pp. 1667–1674, 2006
2006
-
[37]
Herbarium specimens, photographs, and field observations show philadelphia area plants are responding to climate change,
Z. A. Panchen, R. B. Primack, T. Ani ´sko, and R. E. Lyons, “Herbarium specimens, photographs, and field observations show philadelphia area plants are responding to climate change,” Ameri- can journal of botany , vol. 99, no. 4, pp. 751–756, 2012
2012
-
[38]
Herbarium records are reliable sources of phenological change driven by climate and provide novel insights into species’ phenological cueing mechanisms,
C. C. Davis, C. G. Willis, B. Connolly, C. Kelly, and A. M. Ellison, “Herbarium records are reliable sources of phenological change driven by climate and provide novel insights into species’ phenological cueing mechanisms,” American journal of botany , vol. 102, no. 10, pp. 15...
2015
-
[39]
Old plants, new tricks: Phenological research using herbarium specimens,
C. G. Willis, E. R. Ellwood, R. B. Primack, C. C. Davis, K. D. Pearson, A. S. Gallinat, J. M. Yost, G. Nelson, S. J. Mazer, N. L. Rossington et al., “Old plants, new tricks: Phenological research using herbarium specimens,” Trends in ecology & evolution, vol. 32, no. 7, pp. 53...
2017
-
[40]
Herbarium specimens provide reliable estimates of phenological responses to climate at unparalleled taxonomic and spatiotemporal scales,
T. H. Ramirez-Parada, I. W. Park, and S. J. Mazer, “Herbarium specimens provide reliable estimates of phenological responses to climate at unparalleled taxonomic and spatiotemporal scales,” Ecography, vol. 2022, no. 10, p. e06173, 2022
2022
-
[41]
Plasticity and not adaptation is the primary 15 source of temperature-mediated variation in flowering phenology in north america,
T. H. Ramirez-Parada, I. W. Park, S. Record, C. C. Davis, A. M. Ellison, and S. J. Mazer, “Plasticity and not adaptation is the primary 15 source of temperature-mediated variation in flowering phenology in north america,” Nature Ecology & Evolution , pp. 1–10, 2024
2024
-
[42]
Herbarium records provide reliable phenology estimates in the understudied tropics,
D. S. Park, G. M. Lyra, A. M. Ellison, R. K. B. Maruyama, D. dos Reis Torquato, R. C. Asprino, B. I. Cook, and C. C. Davis, “Herbarium records provide reliable phenology estimates in the understudied tropics,” Journal of Ecology , vol. 111, no. 2, pp. 327–337, 2023
2023
-
[43]
Phylogenetic conservatism in plant phenology,
T. J. Davies, E. M. Wolkovich, N. J. Kraft, N. Salamin, J. M. Allen, T. R. Ault, J. L. Betancourt, K. Bolmgren, E. E. Cleland, B. I. Cook et al., “Phylogenetic conservatism in plant phenology,” Journal of ecology, vol. 101, no. 6, pp. 1520–1530, 2013
2013
-
[44]
Leaf out times of temperate woody plants are related to phylogeny, deciduousness, growth habit and wood anatomy,
Z. A. Panchen, R. B. Primack, B. Nordt, E. R. Ellwood, A.-D. Stevens, S. S. Renner, C. G. Willis, R. Fahey, A. Whittemore, Y . Duet al., “Leaf out times of temperate woody plants are related to phylogeny, deciduousness, growth habit and wood anatomy,” New Phytologist, vol. 203...
2014
-
[45]
Back to the future for plant phenology research,
E. M. Wolkovich and A. K. Ettinger, “Back to the future for plant phenology research,” New Phytologist, vol. 203, no. 4, pp. 1021– 1024, 2014
2014
-
[46]
Herbarium specimens reveal substantial and unexpected variation in phenological sensitivity across the eastern united states,
D. S. Park, I. Breckheimer, A. C. Williams, E. Law, A. M. Ellison, and C. C. Davis, “Herbarium specimens reveal substantial and unexpected variation in phenological sensitivity across the eastern united states,” Philosophical Transactions of the Royal Society B , vol. 374, no....
2019
-
[47]
Advances in flowering phenology across the northern hemisphere are explained by functional traits,
P. K¨onig, S. Tautenhahn, J. H. C. Cornelissen, J. Kattge, G. B ¨onisch, and C. R ¨omermann, “Advances in flowering phenology across the northern hemisphere are explained by functional traits,” Global Ecology and Biogeography , vol. 27, no. 3, pp. 310–321, 2018
2018
-
[48]
Linkage between species traits and plant phenology in an alpine meadow,
Y . Liu, G. Li, X. Wu, K. J. Niklas, Z. Yang, and S. Sun, “Linkage between species traits and plant phenology in an alpine meadow,” Oecologia, vol. 195, pp. 409–419, 2021
2021
-
[49]
Functional traits influence patterns in vegetative and reproductive plant phenology–a multi-botanical garden study,
M. Sporbert, D. Jakubka, S. F. Bucher, I. Hensen, M. Freiberg, K. Heubach, A. K ¨onig, B. Nordt, C. Plos, I. Blinova et al. , “Functional traits influence patterns in vegetative and reproductive plant phenology–a multi-botanical garden study,” New Phytologist, vol. 235, no. 6,...
2022
-
[50]
The influence of climate warming on flowering phenology in relation to historical annual and seasonal temperatures and plant functional traits,
C. Geissler, A. Davidson, and R. A. Niesenbaum, “The influence of climate warming on flowering phenology in relation to historical annual and seasonal temperatures and plant functional traits,” PeerJ, vol. 11, p. e15188, 2023
2023
-
[51]
Siberian plants shift their phenology in response to climate change,
S. Rosbakh, F. Hartig, D. V . Sandanov, E. V . Bukharova, T. K. Miller, and R. B. Primack, “Siberian plants shift their phenology in response to climate change,” Global Change Biology , vol. 27, no. 18, pp. 4435–4448, 2021
2021
-
[52]
Spring flowering response to climate change between 1936 and 2006 in alberta, canada,
E. Beaubien and A. Hamann, “Spring flowering response to climate change between 1936 and 2006 in alberta, canada,” BioScience, vol. 61, no. 7, pp. 514–524, 2011
1936
-
[53]
Shifts in flowering phenology in response to spring temperatures in eastern tennessee,
A. S. Faidiga, M. G. Oliver, J. M. Budke, and S. Kalisz, “Shifts in flowering phenology in response to spring temperatures in eastern tennessee,” American Journal of Botany , vol. 110, no. 8, p. e16203, 2023
2023
-
[54]
Divergent responses to spring and winter warming drive community level flowering trends,
B. I. Cook, E. M. Wolkovich, and C. Parmesan, “Divergent responses to spring and winter warming drive community level flowering trends,” Proceedings of the National Academy of Sciences , vol. 109, no. 23, pp. 9000–9005, 2012
2012
-
[55]
Spring-and fall-flowering species show diverging phenological responses to climate in the southeast usa,
K. D. Pearson, “Spring-and fall-flowering species show diverging phenological responses to climate in the southeast usa,” Interna- tional Journal of Biometeorology , vol. 63, no. 4, pp. 481–492, 2019
2019
-
[56]
Temporal variations in frost-free season in the united states: 1895– 2000,
K. E. Kunkel, D. R. Easterling, K. Hubbard, and K. Redmond, “Temporal variations in frost-free season in the united states: 1895– 2000,” Geophysical Research Letters , vol. 31, no. 3, 2004
2000
-
[57]
Global warming and the disruption of plant–pollinator interactions,
J. Memmott, P. G. Craze, N. M. Waser, and M. V . Price, “Global warming and the disruption of plant–pollinator interactions,” Ecol- ogy letters, vol. 10, no. 8, pp. 710–717, 2007
2007
-
[58]
Effects of experimental shifts in flowering phenology on plant–pollinator interactions,
N. E. Rafferty and A. R. Ives, “Effects of experimental shifts in flowering phenology on plant–pollinator interactions,” Ecology letters, vol. 14, no. 1, pp. 69–74, 2011
2011
-
[59]
Plant-pollinator interactions over 120 years: loss of species, co-occurrence, and function,
L. A. Burkle, J. C. Marlin, and T. M. Knight, “Plant-pollinator interactions over 120 years: loss of species, co-occurrence, and function,” Science, vol. 339, no. 6127, pp. 1611–1615, 2013
2013
-
[60]
Phenological shifts alter the seasonal structure of pollinator assemblages in europe,
F. Duchenne, E. Th ´ebault, D. Michez, M. Elias, M. Drake, M. Persson, J. Rousseau-Piot, M. Pollet, P. Vanormelingen, and C. Fontaine, “Phenological shifts alter the seasonal structure of pollinator assemblages in europe,” Nature Ecology & Evolution , vol. 4, no. 1, pp. 115–121, 2020
2020
-
[61]
Plant phenology shifts and their ecological and climatic consequences,
Y . H. Fu, J. S. Prev ´ey, and Y . Vitasse, “Plant phenology shifts and their ecological and climatic consequences,” Frontiers in Plant Science, vol. 13, p. 1071266, 2022
2022
-
[62]
Doubtful pathways to cold tolerance in plants,
E. J. Edwards, J. M. de V os, and M. J. Donoghue, “Doubtful pathways to cold tolerance in plants,” Nature, vol. 521, no. 7552, pp. E5–E6, 2015
2015
-
[63]
Model clades are vital for comparative biology, and ascertainment bias is not a problem in practice: a response to beaulieu and o’meara (2018),
M. J. Donoghue and E. J. Edwards, “Model clades are vital for comparative biology, and ascertainment bias is not a problem in practice: a response to beaulieu and o’meara (2018),” American Journal of Botany , vol. 106, no. 3, pp. 327–330, 2019
2018
-
[64]
Widespread sampling biases in herbaria revealed from large-scale digitization,
B. H. Daru, D. S. Park, R. B. Primack, C. G. Willis, D. S. Barrington, T. J. Whitfeld, T. G. Seidler, P. W. Sweeney, D. R. Foster, A. M. Ellison et al., “Widespread sampling biases in herbaria revealed from large-scale digitization,” New Phytologist, vol. 217, no. 2, pp. 939–955, 2018
2018
-
[65]
Biolog- ical collections for understanding biodiversity in the anthropocene,
E. K. Meineke, T. J. Davies, B. H. Daru, and C. C. Davis, “Biolog- ical collections for understanding biodiversity in the anthropocene,” p. 20170386, 2019
2019
-
[66]
Herbarium data: Global biodiversity and societal botanical needs for novel research,
S. A. James, P. S. Soltis, L. Belbin, A. D. Chapman, G. Nelson, D. L. Paul, and M. Collins, “Herbarium data: Global biodiversity and societal botanical needs for novel research,” Applications in plant sciences, vol. 6, no. 2, p. e1024, 2018
2018
-
[67]
The new england vascular plants project: 295,000 specimens and counting,
C. Schorn, E. Weber, R. Bernardos, C. Hopkins, and C. Davis, “The new england vascular plants project: 295,000 specimens and counting,” Rhodora, vol. 118, no. 975, pp. 324–325, 2016
2016
-
[68]
Xception: Deep learning with depthwise separable convolutions,
F. Chollet, “Xception: Deep learning with depthwise separable convolutions,” in Proceedings of the IEEE conference on computer vision and pattern recognition , 2017, pp. 1251–1258
2017
-
[69]
Visualizing data using t-sne
L. Van der Maaten and G. Hinton, “Visualizing data using t-sne.” Journal of machine learning research , vol. 9, no. 11, 2008
2008
-
[70]
Cnh portal,
C. of Northeastern Herbaria, “Cnh portal,” https://neherbaria.org
-
[71]
U. taxonstand: An r package for standardiz- ing scientific names of plants and animals,
J. Zhang and H. Qian, “U. taxonstand: An r package for standardiz- ing scientific names of plants and animals,” Plant Diversity, vol. 45, no. 1, pp. 1–5, 2023
2023
-
[72]
The plants database,
N. USDA, “The plants database,” http://plants.usda.gov, 2023, accessed: 11/08/2023
2023
-
[73]
Usda plants help,
U. NRCS, “Usda plants help,” https://plants.usda.gov/assets/docs/ PLANTS Help Document 2022.pdf, 2022, accessed: 03/20/2024
2022
-
[74]
National wetland plant list,
U. A. C. of Engineers, “National wetland plant list,” USACE Engineer Research and Development Center, Cold Regions Research and Engineering Laboratory, Hanover, NH, Tech. Rep. version 3.5, 2020
2020
-
[75]
National wetland plant list website,
——, “National wetland plant list website,” https://nwpl.sec.usace. army.mil, accessed: 03/20/2024
2024
-
[76]
National wetland plant list indicator rating definitions,
R. Lichvar, N. C. Melvin, M. L. Butterwick, W. N. Kirchner et al., “National wetland plant list indicator rating definitions,” 2012
2012
-
[77]
Constructing a broadly inclusive seed plant phylogeny,
S. A. Smith and J. W. Brown, “Constructing a broadly inclusive seed plant phylogeny,” American journal of botany , vol. 105, no. 3, pp. 302–314, 2018
2018
-
[78]
The maximum likelihood approach to reconstructing ancestral character states of discrete characters on phylogenies,
M. Pagel, “The maximum likelihood approach to reconstructing ancestral character states of discrete characters on phylogenies,” Systematic biology, vol. 48, no. 3, pp. 612–622, 1999
1999
-
[79]
Geiger: investigating evolutionary radiations,
L. J. Harmon, J. T. Weir, C. D. Brock, R. E. Glor, and W. Challenger, “Geiger: investigating evolutionary radiations,” Bioinformatics, vol. 24, no. 1, pp. 129–131, 2008
2008
-
[80]
Detecting correlated evolution on phylogenies: a general method for the comparative analysis of discrete characters,
M. Pagel, “Detecting correlated evolution on phylogenies: a general method for the comparative analysis of discrete characters,” Proceedings of the Royal Society of London. Series B: Biological Sciences, vol. 255, no. 1342, pp. 37–45, 1994
1994
Reviewed August 12, 2026 · model on record in the stance chip above.
Discussion (0). Continue with ORCID to comment.