Selecting New Measurement Locations to Diversify Traffic-Pattern Coverage: A Real-World Evaluation for Total Traffic Volume Estimation
Pith reviewed 2026-06-29 19:53 UTC · model grok-4.3
The pith
Choosing traffic counter locations to capture rare signal patterns improves city-wide volume estimation accuracy.
A machine-rendered reading of the paper's core claim, the machinery that carries it, and where it could break.
Core claim
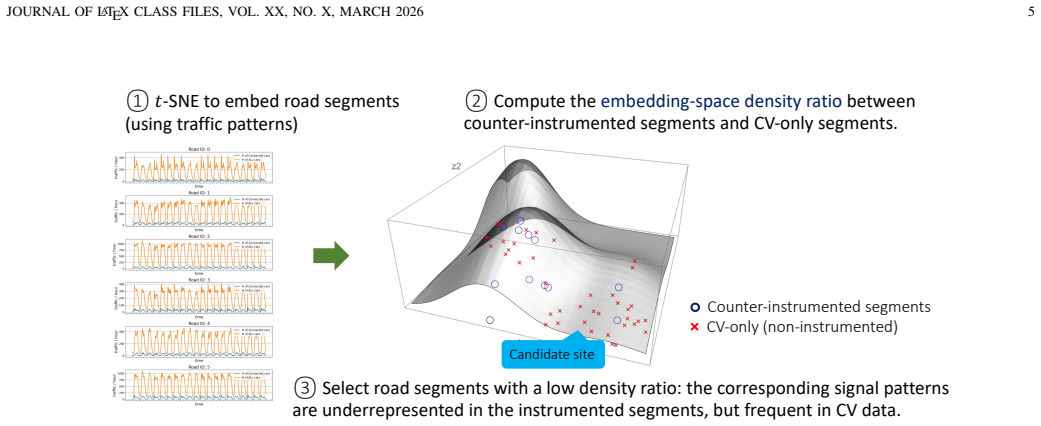
The central claim is that selecting additional measurement locations specifically to increase the diversity of traffic signal patterns, rather than maximizing spatial spread, produces observations that are more representative for later estimation; commissioning field measurements at the algorithm-chosen sites in a target city produced measurable improvement in traffic volume estimation accuracy.
What carries the argument
An algorithm that chooses additional counter locations to increase the diversity of observed traffic signal patterns.
If this is right
- The augmented counter set captures traffic-pattern types that were rare in the original measurements.
- The collected observations become more useful as training or calibration data for city-wide forecasting models.
- Estimation error decreases across low-, medium-, and high-fidelity versions of the volume model.
- Mobile-device data can be repurposed as a low-cost guide for deciding where expensive fixed sensors add the most value.
Where Pith is reading between the lines
- The method might allow a fixed budget of counters to achieve a target accuracy level with fewer total installations than spatial heuristics require.
- The same diversity objective could be applied to selecting probe-vehicle routes or temporary sensor deployments in other urban sensing problems.
- If the pattern-diversity benefit holds across cities, planners could run the selection step periodically as the existing counter network evolves.
Load-bearing premise
That measurements capturing a broader set of traffic signal patterns will be more representative for estimating total city-wide volumes than measurements chosen for spatial coverage alone.
What would settle it
Running the same estimation pipeline on data from an equal number of new sites chosen by spatial coverage criteria alone and checking whether accuracy gains are smaller or absent.
Figures
read the original abstract
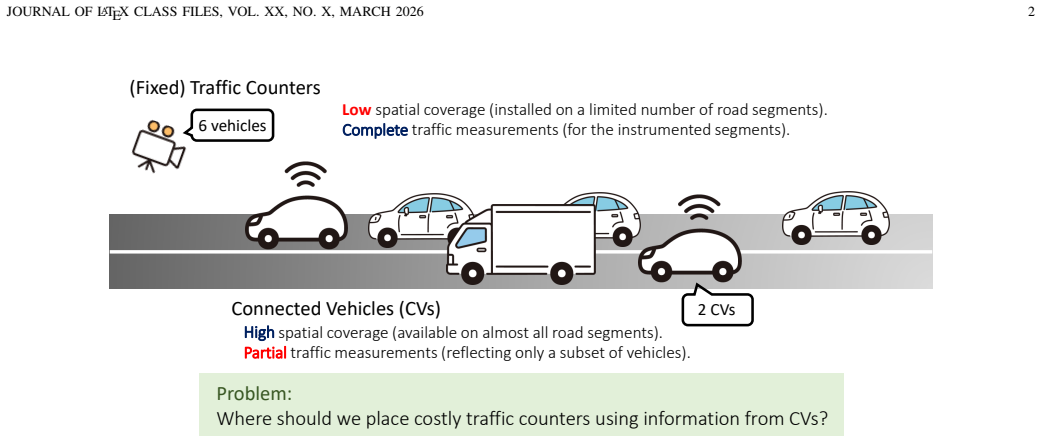
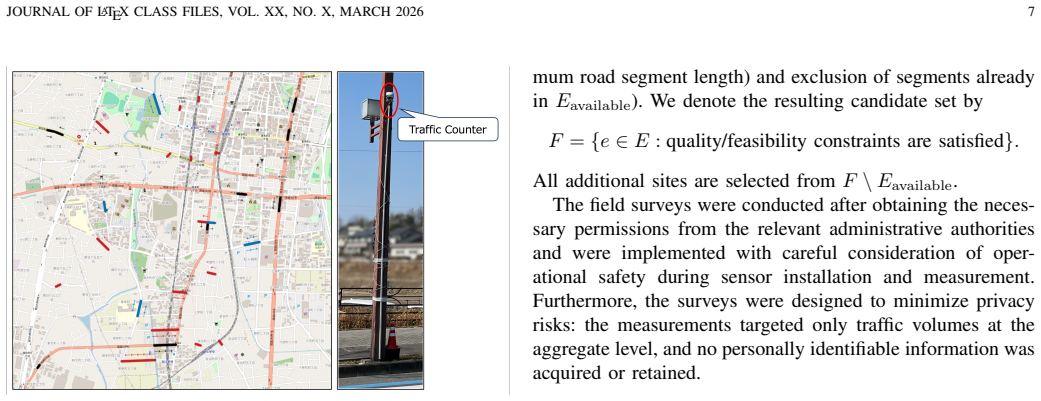
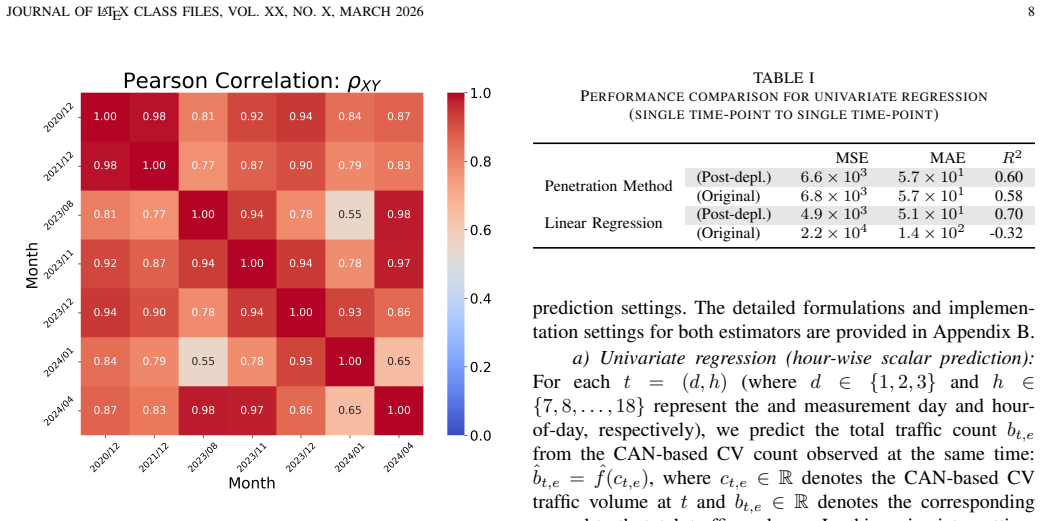
Accurate measurement of traffic volumes and flows is vital for modern intelligent transportation. However, despite recent technological advances in sensor devices, it is still expensive to install and maintain fixed traffic counters. Therefore, it is restricted to a small portion of location points where the counters can be installed, which severely limits the possibility of grasping and predicting the total traffic volume at a city-wide level. By contrast, devices with location history such as smartphones and connected vehicles are now widely used and provide much wider spatial coverage. However, the data from these devices are usually partial and noisy, so they are not enough to directly estimate total traffic volumes and flows. In this paper, we use the information from these widely available devices to help decide where to place additional traffic counters, and we study how selecting new measurement locations can improve city-wide traffic estimation performance. To achieve this, we propose an algorithm that chooses additional counter locations to increase the diversity of observed traffic signal patterns, rather than simply spreading counters evenly over space. The goal is to capture traffic-pattern types that are rare in the current counter set and to make the collected observations more representative for later estimation and forecasting. We also present a real-world evaluation; in a target city, we select new locations expected to improve traffic prediction, and we then commissioned new field measurements at those locations at our expense. The resulting data led to an improvement in traffic volume estimation accuracy across different fidelities.
Editorial analysis
A structured set of objections, weighed in public.
Referee Report
Summary. The paper proposes an algorithm that selects new fixed traffic counter locations to maximize diversity in observed traffic signal patterns (leveraging partial data from smartphones/connected vehicles), rather than uniform spatial coverage. It reports a real-world field test in which counters were commissioned at the algorithm-selected sites, claiming that the resulting data improved city-wide total traffic volume estimation accuracy across different fidelities.
Significance. If the central claim holds with proper controls, the work could offer a practical method for optimizing scarce sensor deployments to better support city-scale estimation from noisy mobile data sources. The real-world commissioning of measurements is a positive element, but the absence of quantitative metrics and baselines currently prevents assessing whether the diversity criterion adds value beyond simply increasing sensor count.
major comments (2)
- [Real-world evaluation] Real-world evaluation section: the reported accuracy improvement after installing counters at the selected sites is presented without any control baseline (e.g., an equal number of sites chosen by random selection or spatial-coverage-only criterion). This prevents isolating whether the gain is due to pattern diversity rather than the mere addition of sensors, which is load-bearing for the central claim that the diversity-driven selection produced the improvement.
- [Abstract / Evaluation] Abstract and evaluation description: no quantitative results (error metrics, before/after values, confidence intervals, or statistical tests), no description of how the diversity criterion was implemented or validated, and no baseline comparisons are supplied. The claim that the data 'led to an improvement in traffic volume estimation accuracy across different fidelities' therefore cannot be assessed from the presented material.
Simulated Author's Rebuttal
We thank the referee for the detailed and constructive report. The comments correctly identify gaps in the presentation of quantitative results and controls for the real-world evaluation. We respond to each major comment below and will revise the manuscript to address them.
read point-by-point responses
-
Referee: [Real-world evaluation] Real-world evaluation section: the reported accuracy improvement after installing counters at the selected sites is presented without any control baseline (e.g., an equal number of sites chosen by random selection or spatial-coverage-only criterion). This prevents isolating whether the gain is due to pattern diversity rather than the mere addition of sensors, which is load-bearing for the central claim that the diversity-driven selection produced the improvement.
Authors: We agree that a control baseline is necessary to isolate the effect of the diversity-driven selection from the simple addition of sensors. The real-world component commissioned counters only at the algorithm-selected sites due to installation costs. In revision we will add simulation-based baselines on the same underlying mobile data, comparing the diversity criterion against equal numbers of randomly selected sites and against a spatial-coverage-only selection. This will allow quantitative assessment of whether the observed improvement exceeds what would be expected from non-diversity-based placement. revision: yes
-
Referee: [Abstract / Evaluation] Abstract and evaluation description: no quantitative results (error metrics, before/after values, confidence intervals, or statistical tests), no description of how the diversity criterion was implemented or validated, and no baseline comparisons are supplied. The claim that the data 'led to an improvement in traffic volume estimation accuracy across different fidelities' therefore cannot be assessed from the presented material.
Authors: The referee is correct that the abstract and evaluation sections lack explicit numerical results, confidence intervals, and statistical tests. The manuscript body describes the diversity criterion implementation, but these details and the supporting metrics were not summarized in the abstract or highlighted with before/after values. We will revise the abstract to report the key error metrics and improvement magnitudes, expand the evaluation section with confidence intervals and statistical tests, and incorporate the simulation baselines described above. revision: yes
Circularity Check
No circularity: evaluation is an independent field test with no equations or fitted reductions visible
full rationale
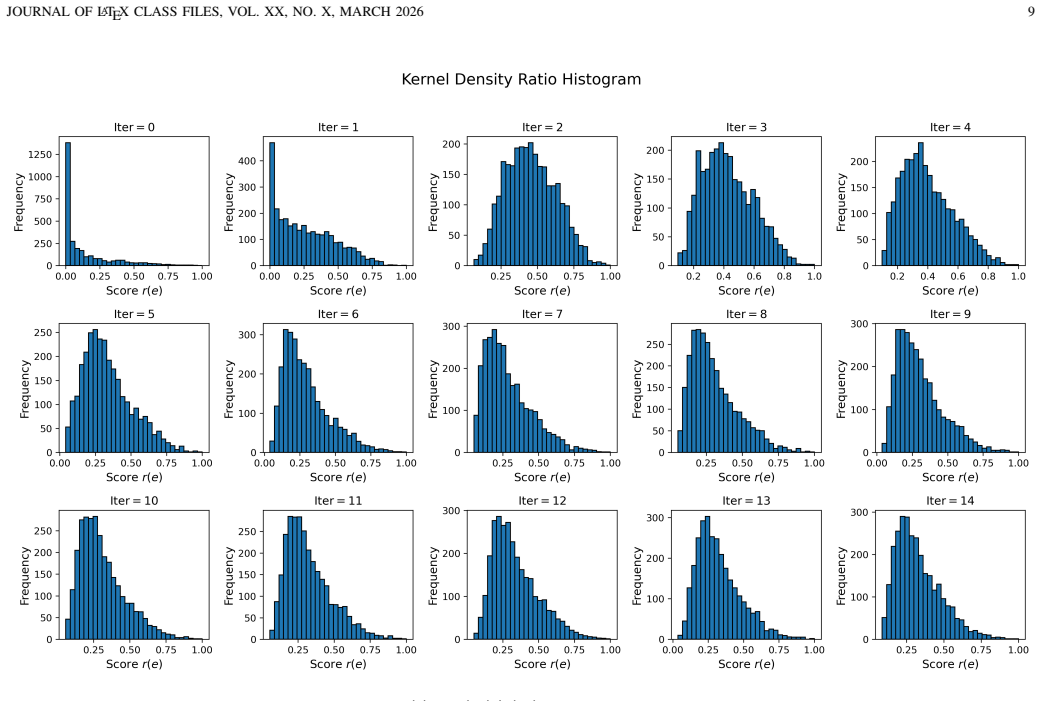
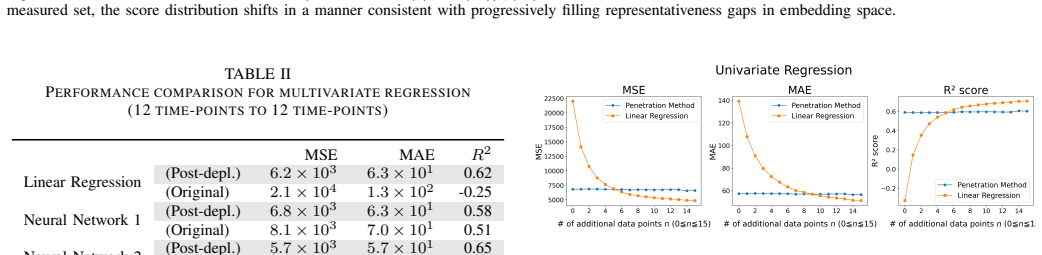
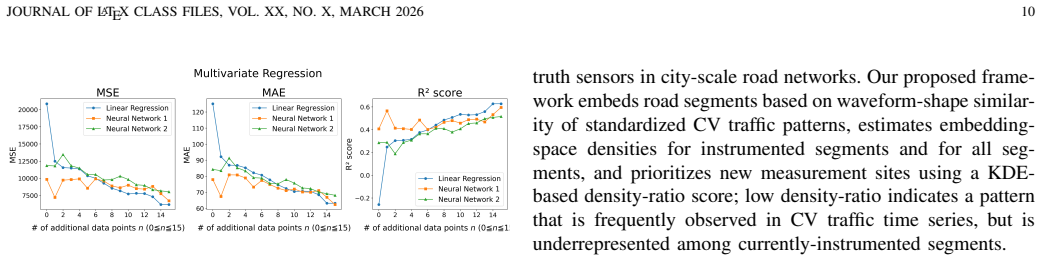
The manuscript describes an algorithm for selecting sensor locations based on traffic-pattern diversity and reports a real-world evaluation in which new counters were commissioned at the chosen sites, yielding improved estimation accuracy. No equations, parameter-fitting procedures, self-citations, or uniqueness theorems appear in the supplied text. The central claim therefore rests on an external empirical measurement rather than any derivation that reduces to its own inputs by construction. This is the most common honest outcome for an applied evaluation paper that does not present a mathematical derivation chain.
Axiom & Free-Parameter Ledger
Reference graph
Works this paper leans on
-
[1]
Intelligent transportation systems for sustainable smart cities,
M. Elassy, M. Al-Hattab, M. Takruri, and S. Badawi, “Intelligent transportation systems for sustainable smart cities,” Transportation En- gineering, vol. 16, p. 100252, 2024
2024
-
[2]
Traffic prediction using artificial intelligence: Review of recent advances and emerging opportunities,
M. Shaygan, C. Meese, W. Li, X. G. Zhao, and M. Nejad, “Traffic prediction using artificial intelligence: Review of recent advances and emerging opportunities,” Transportation Research Part C: Emerging Technologies, vol. 145, p. 103921, 2022
2022
-
[4]
City-wide traffic volume inference with loop detector data and taxi trajectories,
C. Meng, X. Yi, L. Su, J. Gao, and Y . Zheng, “City-wide traffic volume inference with loop detector data and taxi trajectories,” in Proceedings of the 25th ACM SIGSPATIAL International Conference on Advances in Geographic Information Systems , ser. SIGSPATIAL ’17. New York, NY , USA: Association for Computing Machinery, 2017
2017
-
[5]
Using gps technology to quantify human mobility, dynamic contacts and infectious disease dynamics in a resource-poor urban environment,
G. M. Vazquez-Prokopec, D. Bisanzio, S. T. Stoddard, V . Paz-Soldan, A. C. Morrison, J. P. Elder, J. Ramirez-Paredes, E. S. Halsey, T. J. Kochel, T. W. Scott, and U. Kitron, “Using gps technology to quantify human mobility, dynamic contacts and infectious disease dynamics in a resource-poor urban environment,” PLOS ONE, vol. 8, no. 4, pp. 1–10, 04 2013
2013
-
[6]
Estimating human trajectories and hotspots through mobile phone data,
S. Hoteit, S. Secci, S. Sobolevsky, C. Ratti, and G. Pujolle, “Estimating human trajectories and hotspots through mobile phone data,” Computer Networks, vol. 64, pp. 296–307, 2014
2014
-
[7]
Estimating total traffic volume with statistical modeling approach,
J. Yong, Y . Wakabayashi, A. Okayasu, R. Miki, T. Sasai, M. Inoue, and S. Fukushima, “Estimating total traffic volume with statistical modeling approach,” in 2022 IEEE 25th International Conference on Intelligent Transportation Systems (ITSC) , 2022, pp. 304–309
2022
-
[8]
A digital twin smart city for citizen feedback,
G. White, A. Zink, L. Codec ´a, and S. Clarke, “A digital twin smart city for citizen feedback,” Cities, vol. 110, p. 103064, 2021
2021
-
[9]
Getting real: the challenge of building and validating a large-scale digital twin of barcelona’s traffic with empirical data,
J. A. S ´anchez-Vaquerizo, “Getting real: the challenge of building and validating a large-scale digital twin of barcelona’s traffic with empirical data,” International Journal of Geo-Information , vol. 11, no. 1, p. 24, 2021
2021
-
[10]
A transportation digital-twin approach for adaptive traffic control systems,
S. Dasgupta, M. Rahman, A. D. Lidbe, W. Lu, and S. Jones, “A transportation digital-twin approach for adaptive traffic control systems,” 2021, arXiv preprint arXiv:2109.10863
-
[11]
Cooperative ramp merging design and field implementation: a digital twin approach based on vehicle-to-cloud communication,
X. Liao, Z. Wang, X. Zhao, K. Han, P. Tiwari, M. J. Barth, and G. Wu, “Cooperative ramp merging design and field implementation: a digital twin approach based on vehicle-to-cloud communication,” IEEE Transactions on Intelligent Transportation Systems , vol. 23, no. 5, pp. 4490–4500, 2022
2022
-
[12]
Enhancing traffic safety analysis with digital twin technology: integrating vehicle dynamics and environmental factors into microscopic traffic simulation,
G. Xu, J. Chen, Z. Wang, A. Zhou, M. Schrader, J. Bittle, and Y . Shao, “Enhancing traffic safety analysis with digital twin technology: integrating vehicle dynamics and environmental factors into microscopic traffic simulation,” Scientific Reports, vol. 15, no. 1, p. 44404, 2025
2025
-
[13]
Adaptive optimization of traffic sensor locations under uncertainty using flow-constrained inference,
M. Owais and A. A. Allam, “Adaptive optimization of traffic sensor locations under uncertainty using flow-constrained inference,” Applied Sciences, vol. 15, no. 18, 2025
2025
-
[15]
Spatial prediction of traffic levels in unmeasured locations: applications of universal kriging and geograph- ically weighted regression,
B. Selby and K. M. Kockelman, “Spatial prediction of traffic levels in unmeasured locations: applications of universal kriging and geograph- ically weighted regression,” Journal of Transport Geography , vol. 29, pp. 24–32, 2013
2013
-
[16]
Location–allocation strategies for traffic coun- ters—a citywide deployment,
M. Wu and T. J. Kwon, “Location–allocation strategies for traffic coun- ters—a citywide deployment,” Canadian Journal of Civil Engineering , vol. 50, no. 10, pp. 865–877, 2023
2023
-
[17]
On estimation of a probability density function and mode,
E. Parzen, “On estimation of a probability density function and mode,” The Annals of Mathematical Statistics , vol. 33, no. 3, pp. 1065–1076, 1962. JOURNAL OF LATEX CLASS FILES, VOL. XX, NO. X, MARCH 2026 12
1962
-
[18]
Urban network-wide traffic volume estimation under sparse deployment of detectors,
J. Xing, R. Liu, Y . Zhang, C. F. Choudhury, X. Fu, and Q. Cheng, “Urban network-wide traffic volume estimation under sparse deployment of detectors,”Transportmetrica A Transport Science, vol. 20, no. 3, 2024
2024
-
[19]
Diffusion convolutional recurrent neural network: Data-driven traffic forecasting,
Y . Li, R. Yu, C. Shahabi, and Y . Liu, “Diffusion convolutional recurrent neural network: Data-driven traffic forecasting,” in International Con- ference on Learning Representations (ICLR ’18) , 2018
2018
-
[20]
Spatio-temporal graph convolutional net- works: A deep learning framework for traffic forecasting,
B. Yu, H. Yin, and Z. Zhu, “Spatio-temporal graph convolutional net- works: A deep learning framework for traffic forecasting,” in Proceed- ings of the Twenty-Seventh International Joint Conference on Artificial Intelligence, IJCAI-18 . International Joint Conferences on Artificial Intelligence Organization, 7 2018, pp. 3634–3640
2018
-
[21]
Graph wavenet for deep spatial-temporal graph modeling,
Z. Wu, S. Pan, G. Long, J. Jiang, and C. Zhang, “Graph wavenet for deep spatial-temporal graph modeling,” in Proceedings of the 28th International Joint Conference on Artificial Intelligence , ser. IJCAI’19. AAAI Press, 2019, p. 1907–1913
2019
-
[22]
L. Hein, G. De Nunzio, G. Chierchia, A. Pirayre, and L. Najman, “Network-wide traffic volume estimation from speed profiles using a spatio-temporal graph neural network with directed spatial attention,” arXiv preprint arXiv:2512.13758 , 2025
-
[23]
Sensor selection via convex optimization,
S. Joshi and S. Boyd, “Sensor selection via convex optimization,” IEEE Transactions on Signal Processing , vol. 57, no. 2, pp. 451–462, 2009
2009
-
[24]
A submodular approach for optimal sensor placement in traffic networks,
N. Mehr and R. Horowitz, “A submodular approach for optimal sensor placement in traffic networks,” in 2018 Annual American Control Conference (ACC), 2018, pp. 6353–6358
2018
-
[25]
Submodularity of optimal sen- sor placement for traffic networks,
R. Li, N. Mehr, and R. Horowitz, “Submodularity of optimal sen- sor placement for traffic networks,” Transportation Research Part B: Methodological, vol. 171, pp. 29–43, 2023
2023
-
[26]
Near-optimal sensor placements in gaussian processes: Theory, efficient algorithms and empirical stud- ies,
A. Krause, A. Singh, and C. Guestrin, “Near-optimal sensor placements in gaussian processes: Theory, efficient algorithms and empirical stud- ies,” Journal of Machine Learning Research, vol. 9, no. 8, pp. 235–284, 2008
2008
-
[27]
Optimization of traffic sensor location for complete link flow observability in traffic network considering sensor failure,
M. Salari, L. Kattan, W. H. Lam, H. Lo, and M. A. Esfeh, “Optimization of traffic sensor location for complete link flow observability in traffic network considering sensor failure,” Transportation Research Part B: Methodological, vol. 121, pp. 216–251, 2019
2019
-
[28]
Unsupervised scalable representation learning for multivariate time series,
J.-Y . Franceschi, A. Dieuleveut, and M. Jaggi, “Unsupervised scalable representation learning for multivariate time series,” in Advances in Neural Information Processing Systems , vol. 32. Curran Associates, Inc., 2019
2019
-
[29]
Time-series representation learning via temporal and contextual con- trasting,
E. Eldele, M. Ragab, Z. Chen, M. Wu, C. K. Kwoh, X. Li, and C. Guan, “Time-series representation learning via temporal and contextual con- trasting,” in Proceedings of the Thirtieth International Joint Conference on Artificial Intelligence, IJCAI-21, Z.-H. Zhou, Ed. International Joint Conferences on Artificial Intelligence Organization, 8 2021, pp. 2352–...
2021
-
[30]
Self-Supervised Learning for Time Series Analysis: Taxonomy, Progress, and Prospects,
K. Zhang, Q. Wen, C. Zhang, R. Cai, M. Jin, Y . Liu, J. Y . Zhang, Y . Liang, G. Pang, D. Song, and S. Pan, “Self-Supervised Learning for Time Series Analysis: Taxonomy, Progress, and Prospects,” IEEE Transactions on Pattern Analysis & Machine Intelligence, vol. 46, no. 10, pp. 6775–6794, 2024. [Online]. Available: https://doi.ieeecomputersociety.org/10.1...
-
[31]
A simple framework for contrastive learning of visual representations,
T. Chen, S. Kornblith, M. Norouzi, and G. Hinton, “A simple framework for contrastive learning of visual representations,” in Proceedings of the 37th International Conference on Machine Learning , ser. Proceedings of Machine Learning Research, vol. 119. PMLR, 2020, pp. 1597–1607
2020
-
[32]
Spatio-temporal graph convolutional networks: A deep learning framework for traffic forecasting,
B. Yu, H. Yin, and Z. Zhu, “Spatio-temporal graph convolutional networks: A deep learning framework for traffic forecasting,” in Proceedings of the Twenty-Seventh International Joint Conference on Artificial Intelligence, IJCAI-18 . International Joint Conferences on Artificial Intelligence Organization, 7 2018, pp. 3634–3640. [Online]. Available: https:/...
-
[33]
Graph wavenet for deep spatial-temporal graph modeling,
Z. Wu, S. Pan, G. Long, J. Jiang, and C. Zhang, “Graph wavenet for deep spatial-temporal graph modeling,” in Proceedings of the Twenty- Eighth International Joint Conference on Artificial Intelligence, IJCAI-
-
[34]
1907–1913
International Joint Conferences on Artificial Intelligence Organi- zation, 2019, pp. 1907–1913
2019
-
[35]
Visualizing data using t-SNE,
L. van der Maaten and G. Hinton, “Visualizing data using t-SNE,” Journal of Machine Learning Research , vol. 9, no. 86, pp. 2579–2605, 2008
2008
-
[36]
A tutorial on kernel density estimation and recent ad- vances,
Y .-C. Chen, “A tutorial on kernel density estimation and recent ad- vances,” Biostatistics & Epidemiology, vol. 1, no. 1, pp. 161–187, 2017
2017
-
[37]
Cross-sectional traffic volume for general roads,
Japan Road Traffic Information Center, “Cross-sectional traffic volume for general roads,” https://www.jartic.or.jp/service/opendata/. Accessed: 2025/05/15
2025
-
[38]
OpenStreetMap Copyright and License,
OpenStreetMap contributors, “OpenStreetMap Copyright and License,” https://www.openstreetmap.org/copyright, 2026
2026
discussion (0)
Sign in with ORCID, Apple, or X to comment. Anyone can read and Pith papers without signing in.