REVIEW 4 major objections 5 minor 64 references
The paper's central claim: a mergeable Trace Projection Object can preserve structural, temporal, critical-path, and semantic trace behavior, so arbitrary populations can be built at query time and separate interfaces can define their own n
Reviewed by Pith at T0; open to challenge. T0 means a machine referee read the full paper against a public rubric. the ladder, T0–T4 →
T0 review · deepseek-v4-flash
2026-08-01 13:25 UTC pith:4GFIZNVW
load-bearing objection The TPO is a genuinely useful mergeable trace representation, but the critical-path merge is underspecified and the evaluation is too qualitative to back the effectiveness claims as written. the 4 major comments →
Enabling Multi-Dimensional Distributed Trace Comparison with Contrast
The pith
A machine-rendered reading of the paper's core claim, the machinery that carries it, and where it could break.
Core claim
At the core of Contrast is the Trace Projection Object, a per-trace summary that keeps four kinds of information: parent-child structural motifs with frequencies; per-operation latency distributions as mergeable sketches; per-operation critical-path occupancy arrays over discrete time bins; and semantic counts of logs, errors, and tags. A single merge operator combines any two TPOs dimension-by-dimension, so a population TPO is built by repeated merges without touching raw traces. Because the TPO does not define a difference metric, individual interfaces can compute their own notions of divergence from the same object. Contrast instantiates two interfaces—SpectroViz, which localizes critical
What carries the argument
The Trace Projection Object (TPO) is the load-bearing abstraction. Structural information is a count of unique parent-child edges; temporal information uses a mergeable quantile sketch per operation so latency distributions can be combined cheaply; critical-path information compresses the critical path into fine-grained sub-segment occupancy arrays, one per operation, aligned to discrete time intervals measured from request start; semantic information is frequency-coded logs, error types, and tags. The merge operator adds structural counters, merges sketches, performs element-wise addition of occupancy arrays, and unions semantic counters. This design lets any population be expressed as a me
Load-bearing premise
The TPO assumes that its four summaries—edge counts, latency sketches, critical-path occupancy arrays, and semantic counters—retain enough fidelity to detect the differences that matter, and that element-wise addition of occupancy arrays over fixed time bins does not hide a divergence.
What would settle it
Build two trace populations whose TPOs are identical—same parent-child counts, same sketch quantiles, same occupancy arrays, same log and tag counters—but whose raw traces differ in a way an operator would care about, such as a span whose critical-path execution shifts within a single time bin or two latency distributions with identical quantiles but different shapes. If both SpectroViz and Parallax fail to distinguish them, the projection is lossy where it matters. Conversely, a controlled benchmark with ground-truth perturbations is the test: any perturbation that produces no TPO-visible dif
If this is right
- Operators can build and refine comparison populations interactively at query time; only per-trace TPOs need precomputation, so repeated analyses avoid re-scanning raw traces.
- Multiple diagnostic interfaces can be composed over one shared representation, so insights from critical-path visualization and text explanation reinforce rather than compete.
- New comparison interfaces can be added by projecting from TPO dimensions without changing trace processing.
- A controlled perturbation benchmark allows trace-comparison systems to be evaluated systematically across structural, temporal, and semantic anomalies, not only on whatever production data is available.
- If TPO summaries are as cheap to generate and merge as reported, population-level comparison can scale to the large trace volumes seen in production.
Where Pith is reading between the lines
- A natural next step is incremental TPO maintenance over streaming traces: because TPOs merge, population projections can be updated as new traces arrive without revisiting historical raw data.
- The occupancy-array design assumes requests share a time origin and discrete bins; comparing traces with very different durations, or anomalies that shift execution within a bin, may require multi-resolution or normalized time axes.
- Since the TPO separates representation from semantics, the same object could drive non-visual, non-textual interfaces, such as auditory displays or automated clustering of populations by structural and critical-path signature.
- The parent-child motif vocabulary is a design choice; replacing it with richer workflow motifs would strengthen the structural dimension without changing the merge contract.
Editorial analysis
A structured set of objections, weighed in public.
Referee Report
Summary. Contrast introduces the Trace Projection Object (TPO), a per-trace summary that records structural parent-child motif counts, per-operation DDSketch latency distributions, per-operation critical-path occupancy arrays, and semantic log/tag counters. TPOs are meant to be mergeable so that population-level projections can be constructed dynamically at query time, and different comparison interfaces can operate on the same representation. The paper presents two interfaces: SpectroViz, which overlays an anomalous trace's critical path on a baseline occupancy heatmap, and Parallax, an LLM-based multi-agent system that summarizes and compares TPOs. The evaluation uses a new TraceComp benchmark built on Blueprint/DeathStarBench, the DeathStarBench social-network trace dataset, and the Uber CRISP trace dataset, reporting qualitative visualizations, Parallax text outputs, generation/merge costs, and LLM token costs.
Significance. If the TPO's merge semantics are made precise, the core idea is valuable: separating comparison semantics from a canonical, mergeable trace representation could support dynamic population construction and multiple diagnostic interfaces without re-scanning raw traces. The cost measurements in Table 2 are a useful first step, and the use of public datasets is a strength. However, the effectiveness claims are currently supported only by qualitative screenshots and unvalidated LLM text; there is no quantitative diagnosis metric, no baseline comparison, and no user study. The TPO design is therefore promising but not yet demonstrated to the standard required for a systems venue.
major comments (4)
- [§3.1–§3.2] The merge operator for the critical-path dimension is underspecified. §3.1 states that each operation has a one-dimensional occupancy array where 'each array index corresponds to a discrete time interval', and §3.2 says merging is 'element-wise addition of the occupancy arrays'. Element-wise addition requires a common array length, bin width, and time origin for all traces in the population. The paper does not specify the bin width, nor the alignment rule when traces start at different times, have different durations, or do not share the same root operation (e.g., incomplete traces, sampled subtraces, or populations spanning multiple APIs). Without these rules, Merge is not well-defined for arbitrary populations, and the central claim of canonical, mergeable TPOs is not yet established. The Uber case study in §6.2.2 filters to a common root, but the general dynamic-population claim requi
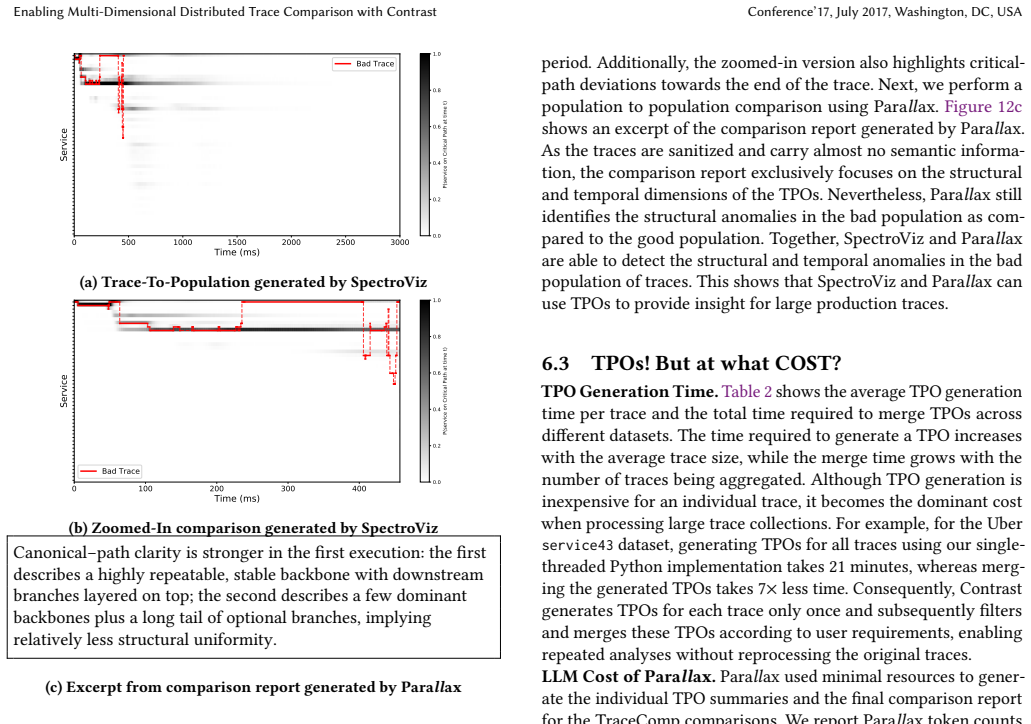
- [§6.1] The effectiveness evaluation is entirely qualitative. SpectroViz results are presented as screenshots with narrative interpretation, and Parallax results are unvalidated LLM text such as 'Parallax correctly identifies'. There is no quantitative metric for diagnosis quality (e.g., precision/recall of the localized fault, rank of the true root cause, or comparison of SpectroViz/Parallax against existing tools such as Jaeger's diff view, TraVista, or Spectroscope). Without a measurable baseline or user study, the paper's claim that Contrast enables 'effective trace comparative interfaces' is not supported. A quantitative evaluation with known injected perturbations and a simple baseline (e.g., latency histograms or structural diff) would make the claims testable.
- [§5–§6.1] The evaluation is at risk of being self-referential because TraceComp is built by the same authors and its perturbation categories—structural, temporal, and semantic—are aligned with the TPO dimensions. For example, the retry-injection perturbation changes parent-child edge counts, the service-slowdown perturbation changes DDSketch latency distributions, and the network-partition perturbation changes log/tag semantic counters. Seeing these perturbations succeed may be partially encoded by construction rather than by the representation's general diagnostic power. This is not a circularity claim but a correctness-risk concern. The paper should evaluate on anomalies that were not categorized according to TPO dimensions, or use blind/held-out real incidents, and report objective success criteria.
- [§4.2, §6.1–§6.2] Parallax's outputs are not validated. The report excerpts state findings such as 'the source of the delay to be extended latency in the search_service' and 'connectivity or network partition issues', but there is no ground-truth comparison, no factuality scoring, no human evaluation, and no discussion of hallucination risk. Since Parallax is a key part of the claimed effectiveness, the paper should either provide a way to verify its outputs against known injected perturbations or clearly scope the claim to 'illustrative reports' rather than 'correct identification'.
minor comments (5)
- [§6.1.2] Typos: 'geo_sevrice' should be 'geo_service'; 'ant structural irregularities' should be 'any structural irregularities'.
- [§6.1.3] Heading 'Semantic Petrubations' should be 'Semantic Perturbations'. Also in §6.1.2 the sentence 'the source of errors as artifically injected failures' has a typo: 'artificially'.
- [Table 2] The row label 'Uber, service4349999' is missing a separator; it should read 'Uber, service43 49999' or similar for clarity.
- [§6.2.1] The statement that the critical path generated by SpectroViz is 'same as the critical path generated by Jaeger' is asserted without evidence. If this was validated, the paper should describe the validation; otherwise, it should be removed or softened.
- [§5] The TraceComp example in Figure 4 calls SpanRemovalPerturbation with argument '50', but the text says '50% probability'. It would be clearer to name the parameter (e.g., probability=0.5) to avoid ambiguity.
Circularity Check
Partial circularity in evaluation: TraceComp anomaly axes mirror TPO's own dimensions and Parallax re-reads stored TPO semantic fields; a minor self-cited Jaeger issue is used as external motivation. The central TPO design remains independently grounded by external case studies.
specific steps
-
other
[§6.1.3 (Semantic Perturbations; cf. §3.1 Semantic Information)]
"Parallax correctly identifies the two salient semantic differences between the populations and highlights the percentage of traces that exhibit each type of semantic failure. ... As part of the TPO, Contrast records the set of unique log statements associated with each operation, along with their occurrence frequencies. It also maintains frequency counters for observed request attributes, including errors, error types, tags, and other key-value attributes."
The NetFault anomaly is a network partition that produces connectivity/timeout log messages. The TPO semantic component stores those exact log statements and error counters, and Parallax's report (Fig. 10) lists them verbatim (e.g., 'Rate service cache errors... memcache: no servers configured or available'). Thus the evaluation's 'correctly identifies' is a direct rendering of data already stored in the TPO, not a prediction from an independent reduced representation. More broadly, TraceComp defines perturbations along the same structural/temporal/semantic axes the TPO was built to record, so the §6.1 controlled experiments partly validate the representation against its own construction. The external DeathStarBench and Uber case studies prevent this from being total circularity.
-
self citation load bearing
[§2.2.2, Existing Techniques (reference [4])]
"Indeed, the maintainers of Jaeger identified support for dynamically selected comparison populations as a prerequisite for integrating TraVista’s visualizations into Jaeger’s trace viewer [4]."
Reference [4] is 'Vaastav Anand and Matheus Stolet. Jaeger issue #6814...', i.e., an issue filed by the paper's first author and an acknowledged contributor, not an independent maintainer decision. Citing it as evidence that 'the maintainers of Jaeger identified' the prerequisite lets the paper's own feature request serve as external motivation for Challenge 1. This is minor and motivational rather than central: the dynamic-population challenge is also argued from general workflow requirements, and the TPO design does not depend on this citation.
full rationale
The central contribution—the mergeable TPO representation—is not derived from its inputs. Section 3 defines structural counters, DDSketch merges, occupancy-array addition, and log/tag counters as a design; the two interfaces consume those fields directly. The main circularity risk is in the evaluation loop. TraceComp is built by the same authors and its perturbation categories (structural, temporal, semantic) are exactly the dimensions the TPO was constructed to capture, so demonstrating that TPO-based interfaces detect TraceComp perturbations is partly by construction. In the NetFault semantic experiment, the 'correctly identified' semantic differences are stored TPO fields (error logs and tags) that Parallax summarizes, so the output re-states the input rather than validating representational sufficiency. Additionally, one motivating claim about Jaeger is supported by a self-authored issue used as if external. These are partial issues: the DeathStarBench and Uber case studies use external trace datasets and the TPO design itself is independent of any single interface. The merge underspecification of critical-path occupancy arrays is a correctness/specification gap rather than circularity, so it does not affect this score. Overall, the paper has some self-referential evaluation content but no core derivation that reduces to its inputs by construction.
Axiom & Free-Parameter Ledger
free parameters (2)
- Critical-path occupancy array time-bin width
- Parallax summarization quantiles =
p25/p50/p75/p90/p99
axioms (5)
- domain assumption Distributed traces are DAGs of spans whose edges are happened-before relationships.
- standard math DDSketch merge faithfully preserves the population latency distribution for each operation.
- domain assumption Critical-path behavior can be represented as per-operation occupancy arrays, and element-wise addition of these arrays preserves population critical-path behavior.
- domain assumption Merging trace-level TPOs is associative and equivalent to aggregating all traces together.
- domain assumption LLM-generated summaries and comparisons in Parallax are factually grounded in the TPO text.
invented entities (1)
-
Trace Projection Object (TPO)
no independent evidence
read the original abstract
Diagnosis using distributed traces is fundamentally a comparative task: operators seek to understand how an anomalous execution differs from expected behavior, how a deployment changes system execution, or how two individual executions differ. Trace comparison is challenging because useful differences between executions can manifest across multiple dimensions, and no single diagnostic interface is effective at capturing all of them. Moreover, the relevant dimensions and comparison populations are often not known a priori; operators construct and refine comparison sets dynamically as they develop hypotheses about system behavior. This paper presents Contrast, a system for multi-dimensional comparative trace analysis. Contrast introduces the Trace Projection Object (TPO), a mergeable representation that captures structural, temporal, critical-path, and semantic properties of trace populations while enabling efficient construction of arbitrary comparison sets at query time. Unlike approaches that define a fixed notion of trace difference, Contrast separates trace representation from comparison semantics, allowing diverse interfaces to selectively reason about specific dimensions. This separation enables the composition of complementary interfaces, allowing operators to combine insights from multiple dimensions for more effective diagnosis. We demonstrate this capability through two complementary interfaces: (i) SpectroViz, a critical-path-based visual interface for localizing execution differences; and (ii) Parallax, a natural language interface for generating explanations of trace differences using LLMs. We demonstrate the effectiveness and efficiency of Contrast through controlled experiments on traces from DeathStarBench and evaluation on production traces from Uber.
Figures



Reference graph
Works this paper leans on
-
[1]
Mania Abdi, Peter Desnoyers, Mark Crovella, and Raja R Sambasivan. The workflow motif: a widely-useful performance diagnosis abstraction for distributed applications.arXiv preprint arXiv:2506.00749, 2025
arXiv 2025
-
[2]
Blueprint: A toolchain for highly-reconfigurable microservice applications
Vaastav Anand, Deepak Garg, Antoine Kaufmann, and Jonathan Mace. Blueprint: A toolchain for highly-reconfigurable microservice applications. InProceedings of the 29th Symposium on Operating Systems Principles, pages 482–497, 2023
2023
-
[3]
X-Trace trace dataset for DeathStar- Bench
Vaastav Anand and Jonathan Mace. X-Trace trace dataset for DeathStar- Bench. Retrieved October 2019 from https://gitlab.mpi-sws.org/cld/trace- datasets/deathstarbench_traces/tree/master/socialNetwork, 2019
2019
-
[4]
Jaeger issue #6814: Feature: Augmenting trace timeline visualization with aggregate system statistics for faster root cause analysis
Vaastav Anand and Matheus Stolet. Jaeger issue #6814: Feature: Augmenting trace timeline visualization with aggregate system statistics for faster root cause analysis. Accessed July 2026 from https://github.com/jaegertracing/jaeger/issues/ 6814, 2025
2026
-
[5]
Vaastav Anand, Matheus Stolet, Thomas Davidson, Ivan Beschastnikh, Tamara Munzner, and Jonathan Mace. Aggregate-driven trace visualizations for perfor- mance debugging.arXiv preprint arXiv:2010.13681, 2020
Pith/arXiv arXiv 2010
-
[6]
Using magpie for request extraction and workload modelling
Paul Barham, Austin Donnelly, Rebecca Isaacs, and Richard Mortier. Using magpie for request extraction and workload modelling. InOSDI, volume 4, pages 18–18, 2004
2004
-
[7]
Visualizing distributed system executions.ACM Transactions on Software Engineering and Methodology (TOSEM), 29(2):1–38, 2020
Ivan Beschastnikh, Perry Liu, Albert Xing, Patty Wang, Yuriy Brun, and Michael D Ernst. Visualizing distributed system executions.ACM Transactions on Software Engineering and Methodology (TOSEM), 29(2):1–38, 2020
2020
-
[8]
University of California, Berkeley, 2004
Yen-Yang Michael Chen.Path-based failure and evolution management. University of California, Berkeley, 2004
2004
-
[9]
Grammar-based anomaly detection of microservice systems execution traces
Andrea D’Angelo and Giordano d’Aloisio. Grammar-based anomaly detection of microservice systems execution traces. InCompanion of the 15th ACM/SPEC International Conference on Performance Engineering, pages 77–81, 2024
2024
-
[10]
Thomas Davidson, Emily Wall, and Jonathan Mace. A qualitative interview study of distributed tracing visualisation: A characterisation of challenges and opportu- nities.IEEE Transactions on Visualization and Computer Graphics, 30(7):3828–3840, 2023
2023
-
[11]
Flexible performance visualization of parallel and distributed applications.Future Generation Computer Systems, 19(5):735–747, 2003
J Chassin de Kergommeaux and Benhur de Oliveira Stein. Flexible performance visualization of parallel and distributed applications.Future Generation Computer Systems, 19(5):735–747, 2003
2003
-
[12]
Pajé, an interactive visualization tool for tuning multi-threaded parallel applications
J Chassin De Kergommeaux, Benhur Stein, and Pierre-Eric Bernard. Pajé, an interactive visualization tool for tuning multi-threaded parallel applications. Parallel Computing, 26(10):1253–1274, 2000
2000
-
[13]
Execution patterns for visualizing web services
Wim De Pauw, Sophia Krasikov, and John F Morar. Execution patterns for visualizing web services. InProceedings of the 2006 ACM symposium on Software visualization, pages 37–45, 2006
2006
-
[14]
Service flow
Dynatrace. Service flow. Accessed July 2026 from https://www.dynatrace.com/ platform/service-flow/
2026
-
[15]
Dtvs: A distributed trace visualization system
Dennis Edwards and Phil Kearns. Dtvs: A distributed trace visualization system. InProceedings of 1994 6th IEEE Symposium on Parallel and Distributed Processing, pages 281–288. IEEE, 1994
1994
-
[16]
Dtracomp: Comparing distributed execution traces for understanding intermittent latency sources.Journal of Systems and Software, page 112990, 2026
Maryam Ekhlasi, Fatemeh Faraji Daneshgar, Michel Dagenais, Maxime Lamothe, Naser Ezzati-Jivan, and Matthew Khouzam. Dtracomp: Comparing distributed execution traces for understanding intermittent latency sources.Journal of Systems and Software, page 112990, 2026
2026
-
[17]
Trace comparisons arrive in jaeger 1.7
Joe Farro. Trace comparisons arrive in jaeger 1.7. Retrieved November 2024 from https://medium.com/jaegertracing/trace-comparisons-arrive-in-jaeger-1- 7-a97ad5e2d05d, 2018
2024
-
[18]
A Picture is Worth a 1,000 Traces
Steve Flanders and Yuri Shkuro. A Picture is Worth a 1,000 Traces. Retrieved Feb- ruary 2020 from https://www.shkuro.com/talks/2019-11-18-a-picture-is-worth- a-thousand-traces/
2020
-
[19]
X-Trace: A Pervasive Network Tracing Framework
Rodrigo Fonseca, George Porter, Randy H Katz, Scott Shenker, and Ion Stoica. X-Trace: A Pervasive Network Tracing Framework. In4th USENIX Symposium on Networked Systems Design and Implementation (NSDI ’07)
-
[20]
An open-source benchmark suite for microservices and their hardware-software implications for cloud & edge systems
Yu Gan, Yanqi Zhang, Dailun Cheng, Ankitha Shetty, Priyal Rathi, Nayan Katarki, Ariana Bruno, Justin Hu, Brian Ritchken, Brendon Jackson, et al. An open-source benchmark suite for microservices and their hardware-software implications for cloud & edge systems. InProceedings of the twenty-fourth international conference on architectural support for program...
2019
-
[21]
Theia: Visual signatures for problem diagnosis in large hadoop clusters
Elmer Garduno, Soila P Kavulya, Jiaqi Tan, Rajeev Gandhi, and Priya Narasimhan. Theia: Visual signatures for problem diagnosis in large hadoop clusters. In26th Large Installation System Administration Conference (LISA 12), pages 33–42, 2012
2012
-
[22]
Listening to the firehose: Sonifying z3’s behavior
Finn Hackett and Ivan Beschastnikh. Listening to the firehose: Sonifying z3’s behavior. In2025 IEEE/ACM 47th International Conference on Software Engineering: New Ideas and Emerging Results (ICSE-NIER), pages 11–15. IEEE, 2025
2025
-
[23]
Analyzing distributed trace data
Brittany Herr and Naoman Abbas. Analyzing distributed trace data. Re- trieved March 2020 from https://medium.com/pinterest-engineering/analyzing- distributed-trace-data-6aae58919949, 2017
2020
-
[24]
Systemizing and mitigating topolog- ical inconsistencies in alibaba’s microservice call-graph datasets
Darby Huye, Lan Liu, and Raja R Sambasivan. Systemizing and mitigating topolog- ical inconsistencies in alibaba’s microservice call-graph datasets. InProceedings of the 15th ACM/SPEC International Conference on Performance Engineering, pages 276–285, 2024
2024
-
[25]
Lifting the veil on{Meta’s} microservice architecture: Analyses of topology and request workflows
Darby Huye, Yuri Shkuro, and Raja R Sambasivan. Lifting the veil on{Meta’s} microservice architecture: Analyses of topology and request workflows. In2023 USENIX Annual Technical Conference (USENIX ATC 23), pages 419–432, 2023
2023
-
[26]
Retrieved July 2026 from https://www.jaegertracing.io/
Jaeger: open source, distributed tracing platform. Retrieved July 2026 from https://www.jaegertracing.io/
2026
-
[27]
Canopy: An End-to- End Performance Tracing And Analysis System
Jonathan Kaldor, Jonathan Mace, Michał Bejda, Edison Gao, Wiktor Kuropatwa, Joe O’Neill, Kian Win Ong, Bill Schaller, Pingjia Shan, Brendan Viscomi, Vinod Vekataraman, Kaushik Veeraraghavan, and Yee Jiun Song. Canopy: An End-to- End Performance Tracing And Analysis System. In26th ACM Symposium on Operating Systems Principles (SOSP ’17), 2017
2017
-
[28]
Black, David J
Thomas Kunz, James P. Black, David J. Taylor, and Twan Basten. Poet: Target- system independent visualizations of complex distributed-application executions. The Computer Journal, 40(8):499–512, 1997
1997
-
[29]
Time, clocks, and the ordering of events in a distributed system
Leslie Lamport. Time, clocks, and the ordering of events in a distributed system. InConcurrency: the Works of Leslie Lamport, pages 179–196. 2019
2019
-
[30]
Llexus: an ai agent system for incident management.ACM SIGOPS Operating Systems Review, 58(1):23–36, 2024
Pedro Las-Casas, Alok Gautum Kumbhare, Rodrigo Fonseca, and Sharad Agarwal. Llexus: an ai agent system for incident management.ACM SIGOPS Operating Systems Review, 58(1):23–36, 2024
2024
-
[31]
Weighted sampling of execution traces: Capturing more needles and less hay
Pedro Las-Casas, Jonathan Mace, Dorgival Guedes, and Rodrigo Fonseca. Weighted sampling of execution traces: Capturing more needles and less hay. In Proceedings of the ACM Symposium on Cloud Computing, pages 326–332, 2018
2018
-
[32]
Sifter: Scalable sampling for distributed traces, without feature engineering
Pedro Las-Casas, Giorgi Papakerashvili, Vaastav Anand, and Jonathan Mace. Sifter: Scalable sampling for distributed traces, without feature engineering. In Proceedings of the ACM Symposium on Cloud Computing, pages 312–324, 2019
2019
-
[33]
The tale of errors in microservices.Proceedings of the ACM on Measurement and Analysis of Computing Systems, 8(3):1–36, 2024
I-Ting Angelina Lee, Zhizhou Zhang, Abhishek Parwal, and Milind Chabbi. The tale of errors in microservices.Proceedings of the ACM on Measurement and Analysis of Computing Systems, 8(3):1–36, 2024
2024
-
[34]
Enhancing trace visualizations for microser- vices performance analysis
Jessica Leone and Luca Traini. Enhancing trace visualizations for microser- vices performance analysis. InCompanion of the 2023 ACM/SPEC International Conference on Performance Engineering, pages 283–287, 2023
2023
-
[35]
Metarca: A generalizable root cause analysis framework for cloud-native systems powered by meta causal knowledge
Shuai Liang, Pengfei Chen, Bozhe Tian, Gou Tan, Maohong Xu, Youjun Qu, Yahui Zhao, Yiduo Shang, and Chongkang Tan. Metarca: A generalizable root cause analysis framework for cloud-native systems powered by meta causal knowledge. Proceedings of the ACM on Software Engineering, 3(FSE):138–159, 2026
2026
-
[36]
Service now cloud observability: View traces-seeing the critical path
LightStep. Service now cloud observability: View traces-seeing the critical path. Retrieved July 2026 from https://docs.lightstep.com/docs/view-traces
2026
-
[37]
Characterizing microservice dependency and performance: Alibaba trace analysis
Shutian Luo, Huanle Xu, Chengzhi Lu, Kejiang Ye, Guoyao Xu, Liping Zhang, Yu Ding, Jian He, and Chengzhong Xu. Characterizing microservice dependency and performance: Alibaba trace analysis. InProceedings of the ACM symposium on cloud computing, pages 412–426, 2021
2021
-
[38]
Verifyrca: Llm-guided but evidence-verified root cause analysis for microservice backends
Wenrui Ma, Kang Yang, Zirui Liu, Ruili Jiang, and Yu Jiang. Verifyrca: Llm-guided but evidence-verified root cause analysis for microservice backends
-
[39]
End-to-end tracing: Adoption and use cases.Survey
Jonathan Mace. End-to-end tracing: Adoption and use cases.Survey. Brown University, 2017
2017
-
[40]
Revisiting end-to-end trace comparison with graph kernels.M
Jonathan Mace and Rodrigo Fonseca. Revisiting end-to-end trace comparison with graph kernels.M. Sc. Project, Brown University, 2013
2013
-
[41]
Charles Masson, Jee E Rim, and Homin K Lee. Ddsketch: A fast and fully- mergeable quantile sketch with relative-error guarantees.arXiv preprint arXiv:1908.10693, 2019
Pith/arXiv arXiv 1908
-
[42]
CRC Press, 2014
Tamara Munzner.Visualization Analysis and Design. CRC Press, 2014
2014
-
[43]
Opentelemetry: The open standard for telemetry
OpenTelemetry. Opentelemetry: The open standard for telemetry. Accessed June 2026 from https://opentelemetry.io/, 2019
2026
-
[44]
Distributed trace comparisons for code review: A system design and practical evaluation, 2020
Hannes Rabo. Distributed trace comparisons for code review: A system design and practical evaluation, 2020
2020
-
[45]
Exploring llm-based agents for root cause analysis
Devjeet Roy, Xuchao Zhang, Rashi Bhave, Chetan Bansal, Pedro Las-Casas, Ro- drigo Fonseca, and Saravan Rajmohan. Exploring llm-based agents for root cause analysis. InCompanion proceedings of the 32nd ACM international conference on the foundations of software engineering, pages 208–219, 2024
2024
-
[46]
Visualizing distributed traces in aggregate.arXiv preprint arXiv:2412.07036, 2024
Adrita Samanta, Henry Han, Darby Huye, Lan Liu, Zhaoqi Zhang, and Raja R Sambasivan. Visualizing distributed traces in aggregate.arXiv preprint arXiv:2412.07036, 2024
Pith/arXiv arXiv 2024
-
[47]
Visualizing request-flow comparison to aid performance diagnosis in distributed systems.IEEE transactions on visualization and computer graphics, 19(12):2466– 2475, 2013
Raja R Sambasivan, Ilari Shafer, Michelle L Mazurek, and Gregory R Ganger. Visualizing request-flow comparison to aid performance diagnosis in distributed systems.IEEE transactions on visualization and computer graphics, 19(12):2466– 2475, 2013
2013
-
[48]
Diagnosing performance changes by comparing request flows
Raja R Sambasivan, Alice X Zheng, Michael De Rosa, Elie Krevat, Spencer Whit- man, Michael Stroucken, William Wang, Lianghong Xu, and Gregory R Ganger. Diagnosing performance changes by comparing request flows. InUSENIX Con- ference on Networked Systems Design and Implementation (NSDI), pages 43–56. USENIX Association, March 2011. Conference’17, July 2017...
2011
-
[49]
Cate- gorizing and differencing system behaviours.Hot Topics in Autonomic Computing, page 2, 2007
Raja R Sambasivan, Alice X Zheng, Eno Thereska, and Gregory R Ganger. Cate- gorizing and differencing system behaviours.Hot Topics in Autonomic Computing, page 2, 2007
2007
-
[50]
Dapper, a large-scale distributed systems tracing infrastructure
Benjamin H Sigelman, Luiz André Barroso, Mike Burrows, Pat Stephenson, Manoj Plakal, Donald Beaver, Saul Jaspan, and Chandan Shanbhag. Dapper, a large-scale distributed systems tracing infrastructure. 2010
2010
-
[51]
𝜇 viz: Visualization of microservices
Sara Silva, Jaime Correia, Andre Bento, Filipe Araujo, and Raul Barbosa. 𝜇 viz: Visualization of microservices. In2021 25th International Conference Information Visualisation (IV), pages 120–128. IEEE, 2021
2021
-
[52]
O’Reilly Media, 2018
Cindy Sridharan.Distributed systems observability: a guide to building robust systems. O’Reilly Media, 2018
2018
-
[53]
Distributed tracing — we’ve been doing it wrong
Cindy Sridharan. Distributed tracing — we’ve been doing it wrong. Retrieved February 2020 from https://medium.com/@copyconstruct/distributed-tracing- weve-been-doing-it-wrong-39fc92a857df, 2019
2020
-
[54]
Yifang Tian, Yaming Liu, Zichun Chong, Zihang Huang, and Hans-Arno Jacobsen. Gala: Can graph-augmented large language model agentic workflows elevate root cause analysis?arXiv preprint arXiv:2508.12472, 2025
Pith/arXiv arXiv 2025
-
[55]
Vamp: Visual analytics for microservices performance
Luca Traini, Jessica Leone, Giovanni Stilo, and Antinisca Di Marco. Vamp: Visual analytics for microservices performance. InProceedings of the 39th ACM/SIGAPP Symposium on Applied Computing, pages 1209–1218, 2024
2024
-
[56]
Zhiqiang Xie, Yujia Zheng, Lizi Ottens, Kun Zhang, Christos Kozyrakis, and Jonathan Mace. Cloud atlas: Efficient fault localization for cloud systems using language models and causal insight.arXiv preprint arXiv:2407.08694, 2024
Pith/arXiv arXiv 2024
-
[57]
Lm-pace: Confidence estimation by large language models for effective root causing of cloud incidents
Dylan Zhang, Xuchao Zhang, Chetan Bansal, Pedro Las-Casas, Rodrigo Fonseca, and Saravan Rajmohan. Lm-pace: Confidence estimation by large language models for effective root causing of cloud incidents. InCompanion Proceedings of the 32nd ACM International Conference on the Foundations of Software Engineering, pages 388–398, 2024
2024
-
[58]
The benefit of hindsight: Tracing{Edge-Cases} in distributed systems
Lei Zhang, Zhiqiang Xie, Vaastav Anand, Ymir Vigfusson, and Jonathan Mace. The benefit of hindsight: Tracing{Edge-Cases} in distributed systems. In20th USENIX Symposium on Networked Systems Design and Implementation (NSDI 23), pages 321–339, 2023
2023
-
[59]
Towards in-depth root cause localization for microservices with multi-agent recursion-of-thought
Lingzhe Zhang, Tong Jia, Kangjin Wang, Chiming Duan, Minghua He, Rongqian Wang, Xi Peng, Meiling Wang, Gong Zhang, Renhai Chen, et al. Towards in-depth root cause localization for microservices with multi-agent recursion-of-thought. IEEE Transactions on Dependable and Secure Computing, 2026
2026
-
[60]
Lingzhe Zhang, Tong Jia, Yunpeng Zhai, Leyi Pan, Chiming Duan, Minghua He, Mengxi Jia, and Ying Li. Agentic memory enhanced recursive reasoning for root cause localization in microservices.arXiv preprint arXiv:2601.02732, 2026
arXiv 2026
-
[61]
Lingzhe Zhang, Tong Jia, Yunpeng Zhai, Leyi Pan, Chiming Duan, Minghua He, Pei Xiao, and Ying Li. Hypothesize-then-verify: Speculative root cause analysis for microservices with pathwise parallelism.arXiv preprint arXiv:2601.02736, 2026
arXiv 2026
-
[62]
Crisp: Critical path analysis of{Large- Scale} microservice architectures
Zhizhou Zhang, Murali Krishna Ramanathan, Prithvi Raj, Abhishek Parwal, Timothy Sherwood, and Milind Chabbi. Crisp: Critical path analysis of{Large- Scale} microservice architectures. In2022 USENIX Annual Technical Conference (USENIX ATC 22), pages 655–672, 2022
2022
-
[63]
Crisp: Critical path analysis of large- scale microservice architectures (artifact), 2022
Zhizhou Zhang, Murali Krishna Ramanathan, Prithvi Raj, Abhishek Parwal, Timothy Sherwood, and Milind Chabbi. Crisp: Critical path analysis of large- scale microservice architectures (artifact), 2022
2022
-
[64]
No client available
Tong Zhou, Xin Peng, Jie Zhang, Chaofeng Sha, Chenxi Zhang, Zicheng Yuan, and Senyu Xie. Tracellm: Evaluating and exploring large language models on trace analysis in microservice-based web applications. InProceedings of the ACM Web Conference 2026, pages 5120–5131, 2026. A Full Parallax Report Figure 13 shows the full comparison report generated by Paral...
2026
discussion (0)
Sign in with ORCID, Apple, or X to comment. Anyone can read and Pith papers without signing in.