REVIEW 4 major objections 4 minor 12 references
Light diffusion in birefringent polycrystals and the IceCube ice anisotropy
T0 review · 4 major / 4 minor · reviewed 2026-08-14 · deepseek-v4-flash
Pith's one-line read Birefringence in polycrystalline ice could explain the flow-aligned optical anisotropy observed by the IceCube detector.
desk verdict Plausible mechanism, honest preliminary report, but the claimed order-of-magnitude match rests on a 1000-grain simulation that is never scaled to the ~125 m IceCube path. read the letter →
The pith
A machine-rendered reading of the paper's core claim, the machinery that carries it, and where it could break.
The reading
What carries the argument
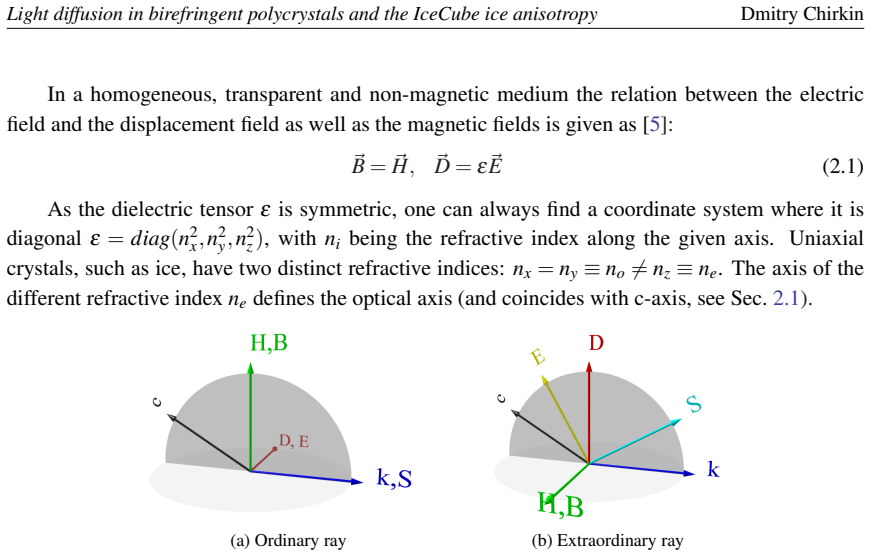
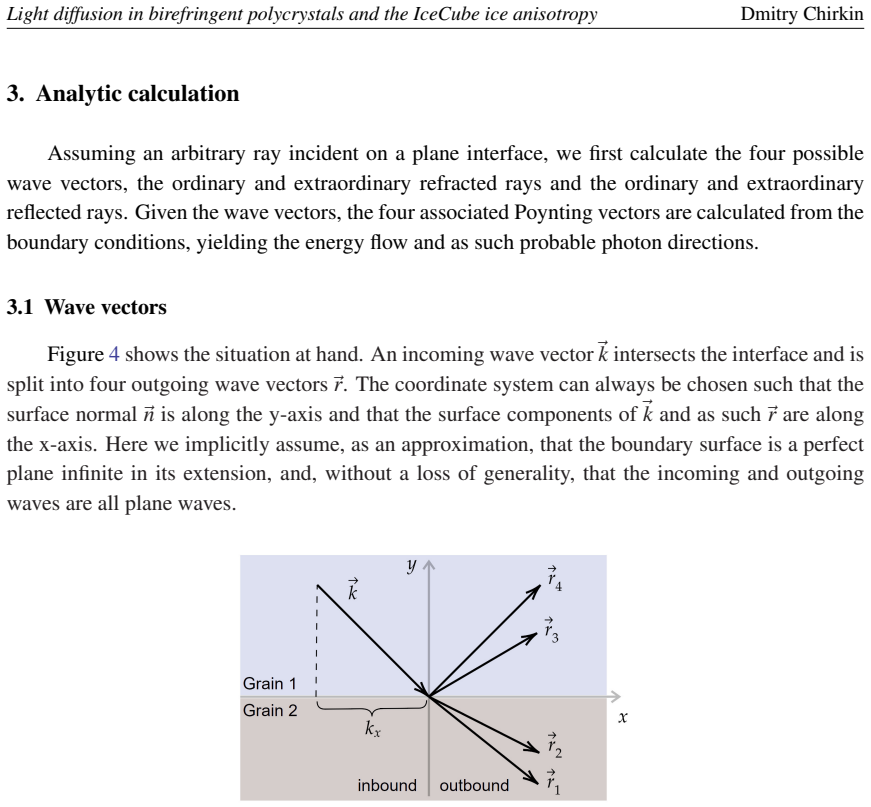
The load-bearing object is the birefringent grain-boundary crossing: at each plane interface between two ice crystals, an incident plane wave is split into up to four outgoing waves, the ordinary and extraordinary reflected and refracted rays. For each wave the authors solve for the wave vector using the direction-dependent extraordinary refractive index, then obtain the Poynting vectors from the electromagnetic boundary conditions; a random outgoing photon is chosen with probability proportional to the normal component of the non-evanescent Poynting vectors. Repeating this over many randomly oriented grain boundaries, with c-axis orientations drawn from a girdle fabric, produces the diffusion pattern. The c-axis fabric supplies the link between ice flow and optical anisotropy.
What would settle it
Measure grain-size and c-axis orientation distributions from the South Pole ice core and run the same simulation with those measured parameters; the central claim would be falsified if the predicted azimuthal charge excess at about 125 m deviates substantially from the observed factor of two, or if the predicted arrival-time broadening disagrees with flasher data.
Extended reading notes
Core claim
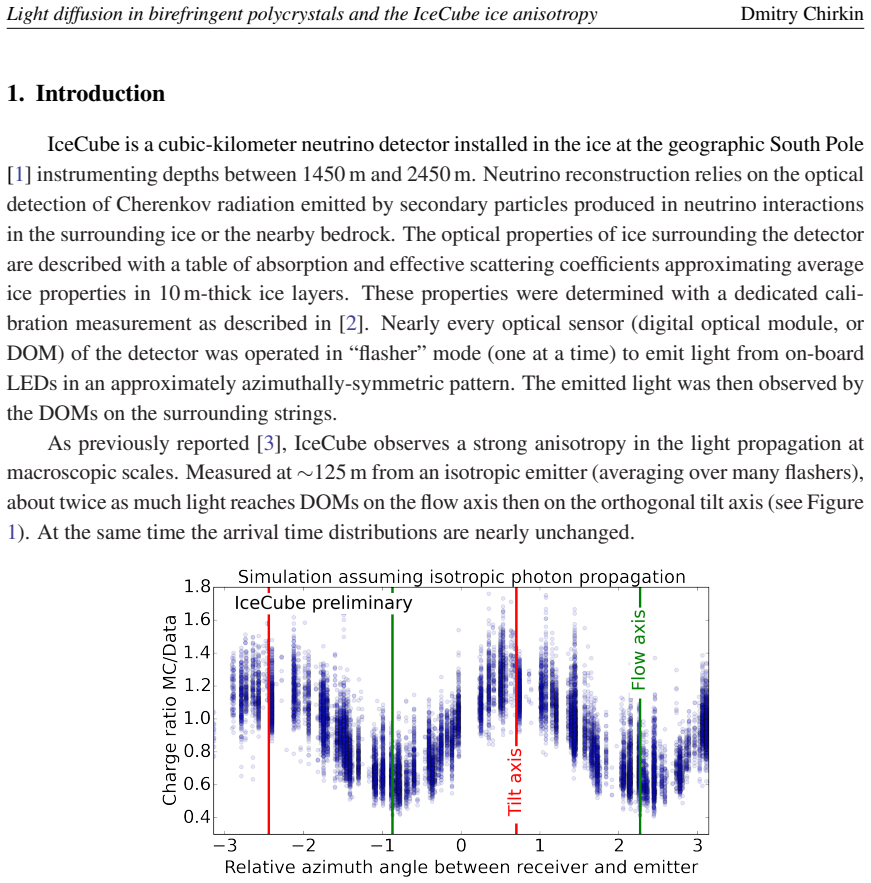
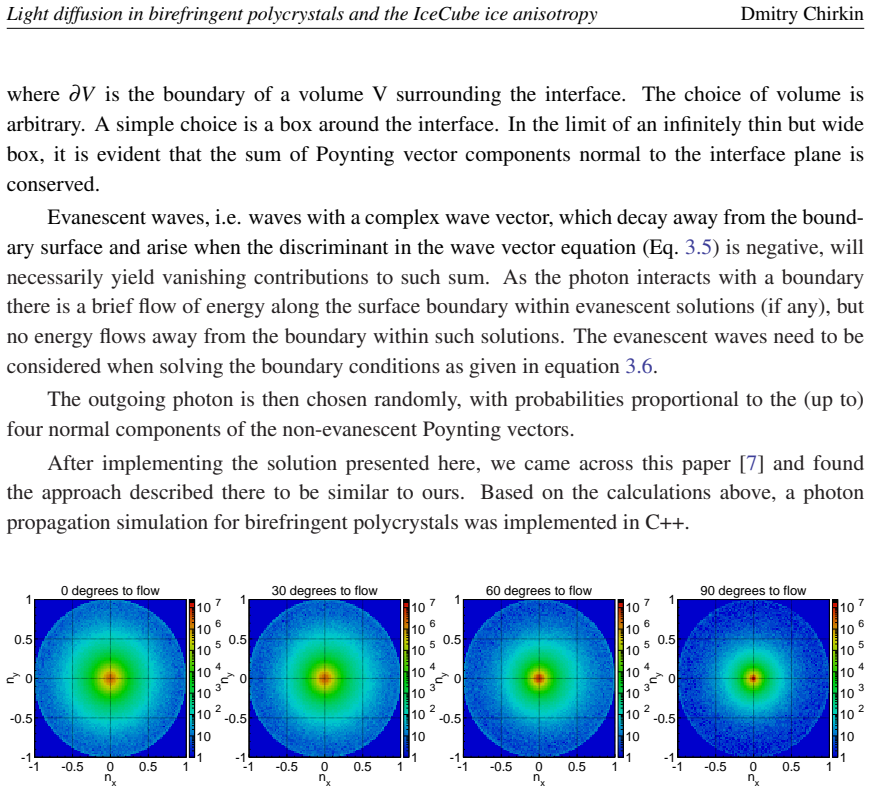
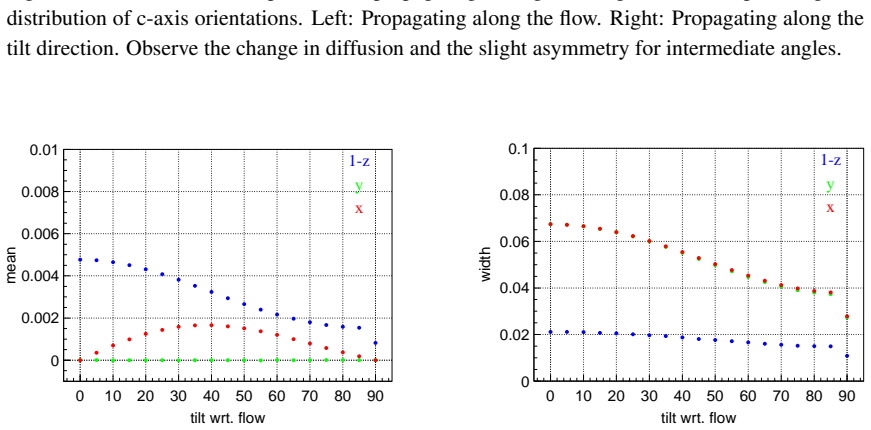
The central claim is that a polycrystalline fabric alone, without any particulate impurities, can produce a macroscopic, direction-dependent spreading of photon directions that matches IceCube's observed optical anisotropy. In a perfect girdle fabric, where c-axes lie in a plane perpendicular to the flow, the simulation shows the largest diffusion for propagation along the flow and the smallest along the tilt axis, and a slight mean deflection toward the flow axis at intermediate angles. The maximum deflection is roughly 0.1 degrees, which the authors state is on the order of magnitude required to describe the in-situ effect: about twice as much light reaches detectors on the flow axis as on the tilt axis at 125 m, while arrival-time distributions stay nearly unchanged. The paper presents this as the first exact calculation and simulation of the resulting diffusion patterns, departing from the prior assumption that optical properties are driven by particulate impurities.
Load-bearing premise
The simulation's quantitative match depends on the grain size and grain elongation in South Pole ice, which have not yet been measured at the South Pole and are assumed from other ice cores to be millimeter-scale with elongations of at most a factor of two; because the number of boundaries crossed over 125 m scales inversely with grain size, a different actual size would change the diffusion strength.
Editorial extensions
If this is right
- If birefringent diffusion is the cause, IceCube's optical ice model must include a direction-dependent diffusion or deflection term, since simple scattering or absorption modifications fail to fit charge and timing together.
- The predicted anisotropy pattern is fixed by the girdle fabric, so the ice-flow direction and fabric depth profile become direct inputs to detector calibration.
- The effect offers a physical, microstructure-based explanation for the flow-aligned attenuation, replacing the assumption that particulate impurities alone control light propagation.
- At intermediate propagation angles, photons are deflected slightly toward the flow axis, which creates a small systematic bias in effective photon directions that any reconstruction will need to account for.
Reading between the lines
- If this mechanism holds, the same birefringent diffusion should appear in other ice-based neutrino detectors whenever their ice has a girdle fabric, with the amplitude scaling with path length and inversely with grain size; comparing sites could test the model without new drilling.
- The asymmetry in the diffusion pattern, a mean deflection toward flow, could be used to reconstruct the local flow direction from optical calibration data alone, and perhaps to map changes in fabric with depth.
- A natural next step, not taken in the paper, is to simulate the single-maximum vertical cluster fabric expected in deeper ice and predict a different anisotropy pattern, which could be checked against the lowest instrumented depths.
- Because the paper's calculation treats grain boundaries as infinite planes, including finite grain shapes and curved boundaries might add small corrections; measuring those corrections in a laboratory birefringent polycrystal would be a controlled test.
Signed reviews
Editorial analysis
A structured set of objections, weighed in public.
Referee Report
Summary. The paper proposes that the anisotropic light propagation observed by IceCube at ~125 m from flasher sources can be explained by birefringence in polycrystalline ice. The authors derive the refraction of ordinary and extraordinary rays at grain boundaries in a uniaxial crystal, implement a Monte Carlo simulation of photon propagation through a polycrystal with a girdle c-axis fabric, and present diffusion patterns after 1000 grain-boundary crossings. They observe that diffusion is largest along the flow direction, smallest along the tilt direction, and that the mean deflection reaches ~0.1 degrees, which they state is on the order of magnitude required to describe the in-situ effect. The paper concludes that the contribution of this diffusion to bulk scattering and a full description of the anisotropy remain to be studied.
Significance. If the proposed mechanism could be quantitatively connected to the IceCube observations, it would offer a microphysical explanation for a puzzling optical anisotropy that currently lacks a satisfactory parametrization. The analytic treatment of birefringent refraction at interfaces is standard, but its application to glacial ice fabrics is novel and the simulation uses independently measured inputs (birefringence from [9], c-axis fabric from SPICEcore [12]) rather than fitting to the IceCube anisotropy data. These are genuine strengths. However, the paper does not demonstrate the claimed order-of-magnitude match: the simulation is run for 1000 boundaries, while the IceCube measurement at 125 m with mm-scale grains would involve roughly 10^5 boundaries, and no scaling or mapping to the measured charge/timing observables is provided. The significance is therefore contingent on a missing quantitative step.
major comments (4)
- [Sec. 4, Fig. 5 and Fig. 6] The central quantitative comparison is not established. The text reports a maximum deflection of ~0.1 degrees after propagating through 1000 grains and calls this 'on the order of magnitude which is required to describe the in-situ effect.' However, the paper never states how many grain boundaries a photon crosses over the ~125 m flasher path. Sec. 2.3.2 says South Pole grains are expected on the mm scale, which implies N ~ 125 m / 1 mm ~ 1.25e5 boundaries, more than two orders of magnitude larger than the simulated 1000. If the deflection is a systematic mean deflection it scales linearly with N; if it is a random-walk diffusion it scales as sqrt(N). Neither scaling is given, so the 0.1-degree value cannot be compared with the IceCube observation by inspection. The authors should provide the scaling law and the resulting predicted deflection over the actual IceCube path length, or clearly state the grain size used when making the order-of-magnitude claim.
- [Sec. 5, Summary and Outlook] The paper explicitly states that 'the contribution of the diffusion to the bulk scattering in the ice, as well as a potential description of the optical anisotropy through the deflection remain to be studied in more detail.' This is an admission that the load-bearing assertion—that the simulated diffusion can describe the in-situ effect—is not backed by a calculation connecting the angular deflection to the observed factor-of-two charge excess at 125 m or to the nearly unchanged arrival-time distributions. To support the claim, the paper needs at least an order-of-magnitude estimate of how a mean deflection or diffusion of the simulated size translates into the azimuth-dependent photoelectron yield and timing at the IceCube flasher distances.
- [Sec. 2.3.2 and Sec. 4] The simulation's predicted diffusion depends directly on the grain size and grain elongation, neither of which has been measured for the South Pole ice. Sec. 2.3.2 states that these quantities are 'from other cores expected to be on the mm-scale with elongations of at most a factor of two.' Since the number of boundary crossings over a fixed distance is inversely proportional to grain size, a factor of 10 uncertainty in grain size changes the accumulated diffusion by a factor of 10 (or sqrt(10) for random-walk spreading), which could easily move the prediction away from the claimed match. The authors should either provide a sensitivity scan over plausible grain sizes and elongations, or justify the transferability of the grain-size distribution from other cores to the South Pole.
- [Sec. 5] The claim that this report presents 'the first exact calculation and simulation' of the resulting diffusion patterns is not substantiated. The analytic boundary-value solution is standard crystal optics, and the paper itself notes that a similar approach was published in [7]. The novelty lies in applying it to glacial ice fabrics, not in the exactness or priority of the calculation. This phrasing should be softened unless a systematic comparison with prior literature is provided.
minor comments (4)
- [Sec. 2.3.2] There is a typo: 'collaoration' should be 'collaboration'.
- [Fig. 5 caption] The caption says 'Left: Propagating along the flow. Right: Propagating along the tilt direction,' but the figure contains four panels at 0, 30, 60, and 90 degrees to flow. The caption should describe all four panels or be corrected.
- [Eq. 3.3] The notation in Eq. (3.3) uses n0 with a zero subscript in some places and n_o elsewhere; please unify the notation for the ordinary refractive index.
- [Sec. 3.2] The phrase '2 of these equations are necessarily co-linear to the rest' should read 'linearly dependent' rather than 'co-linear', which is not the standard term for this linear-algebra statement.
Circularity Check
No circularity found: the simulation uses independent physical inputs and compares to IceCube observations only qualitatively, without fitting the target data.
full rationale
The derivation chain is self-contained. The birefringence strength beta is taken from an external reference [9], the girdle c-axis fabric is taken from the independent SPICEcore measurements [12], and grain sizes and elongations are taken from other ice-core studies [10]; none of these inputs are derived from the IceCube anisotropy that the paper seeks to explain. The IceCube observation is cited [3] only as the phenomenon to be explained, not as a fitted constraint. The quantitative comparison in Section 4 ('The maximum deflection is ∼ 0.1◦. This is on the order of magnitude which is required to describe the in-situ effect') is qualitative and does not invert any parameter from the IceCube data, so the predicted diffusion pattern is not equivalent to its inputs. The unresolved scaling between 1000 simulated grain crossings and the roughly 125 m flasher path is a validation and correctness limitation, not a circularity.
Assumptions & free parameters
free parameters (3)
- grain size scale
- grain elongation factor =
up to 2
- number of grain boundary crossings =
1000
assumptions (4)
- domain assumption Ice is a uniaxial birefringent crystal with beta approximately 2e-3 across the visible spectrum.
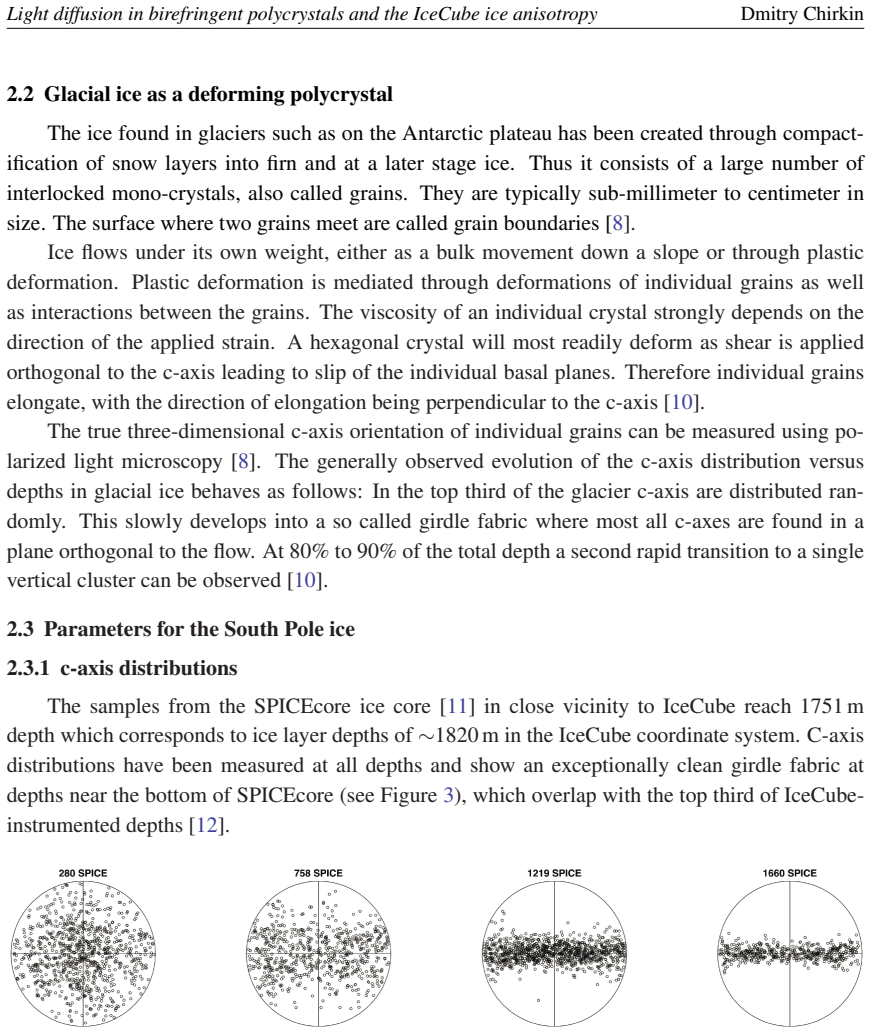
- domain assumption The c-axis distribution at IceCube depths is a perfect girdle fabric orthogonal to the ice flow.
- domain assumption Grain boundaries are infinite plane interfaces and all waves are plane waves.
- domain assumption The observed optical anisotropy is caused by direction-dependent diffusion (scattering) rather than by anisotropic absorption or detector systematics.
Cite this review
Pith. "Pith review of Light diffusion in birefringent polycrystals and the IceCube ice anisotropy." pith.science (2026). https://pith.science/paper/4GYGY7MX
@misc{pith2026190807608,
  author       = {Pith},
  title        = {Pith review of: Light diffusion in birefringent polycrystals and the IceCube ice anisotropy},
  year         = {2026},
  howpublished = {\url{https://pith.science/paper/4GYGY7MX}},
  note         = {Machine review of arXiv:1908.07608}
}
read the original abstract
The IceCube Neutrino Observatory instruments about 1 km^3 of deep, glacial ice at the geographic South Pole with 5160 photomultipliers to detect Cherenkov light from charged relativistic particles. The experiment pursues a wide range of scientific questions ranging from particle physics such as neutrino oscillations to high-energy neutrino astronomy. Most of these efforts rely heavily on an ever more precise understanding of the optical properties of the instrumented ice. An unexpected light propagation effect, observed by the experiment, is an anisotropic attenuation, which is aligned with the local flow of the ice. The exact cause is still under investigation. In this contribution, the micro-structure of ice as a birefringent polycrystal is explored as the cause for this anisotropy.
Figures
Figures from the paper (3 more)
Reference graph
Works this paper leans on
-
[9]
V . F. Petrenko and R. W. Whitworth,Physics of Ice. Oxford University Press, 2002
work page 2002
-
[12]
V oigt et al., c-Axis Fabric of the South Pole Ice Core , in SPICEcore coll
D. V oigt et al., c-Axis Fabric of the South Pole Ice Core , in SPICEcore coll. meeting. 8
- [7]
-
[1]
IceCube Collaboration, M. G. Aartsen et al., Journal of Instrumentation 12 (2017) P03012
work page 2017
-
[2]
IceCube Collaboration, M. G. Aartsen et al., Nucl. Instr . Meth. Phys. Res. 711 (2013) 73–89
work page 2013
- [3]
-
[4]
C. V . Raman and K. S. Viswanathan,Proc. Natl. Acad. Sci. India A 41 (1955) 37–44
work page 1955
-
[5]
L. Landau and E. Lifshitz, Electrodynamics of Continuous Media. Addison-Wesley, 1960
work page 1960
Show all 12 references
-
[6]
C. U. Keller, Crystal optics, in Lecture notes, https://tinyurl.com/yyysde5r, 2008
2008
-
[8]
S. H. Faria, I. Weikusat, and N. Azuma, Journal of Structural Geology 61 (2014) 21–49
2014
-
[10]
Weikusat, D
I. Weikusat, D. Jansen, et al., Philos. Trans. Royal Soc. A 375 (2017) 20150347
2017
-
[11]
Casey et al., Annals of Glaciology 55 (2014) 137–146
K. Casey et al., Annals of Glaciology 55 (2014) 137–146
2014
Reviewed August 14, 2026 · model on record in the stance chip above.
Discussion (0). Continue with ORCID to comment.