REVIEW 3 major objections 6 minor 1 cited by
Ranked differences Pearson correlation dissimilarity with an application to electricity users time series clustering
T0 review · 3 major / 6 minor · reviewed 2026-08-16 · deepseek-v4-flash
Pith's one-line read RDPC, a dissimilarity that mixes the largest pointwise differences with Pearson correlation, outperforms DTW, GAK, K-means, and correlation-based hierarchical clustering on time series with distinct seasonal patterns, trends, and peaks.
desk verdict Simple new dissimilarity with sound metric properties, but the headline performance claim is weakened by tuning on the same datasets used for comparison. read the letter →
The pith
A machine-rendered reading of the paper's core claim, the machinery that carries it, and where it could break.
The reading
What carries the argument
The machinery is the ranked-differences Pearson correlation dissimilarity, $d_{\mathrm{RDPC}}(x,y|\alpha,p,\mathbf{w}) = \alpha\,\mathrm{RankDiff}(x,y|p,\mathbf{w}) + (1-\alpha)\,d_P(x,y)$, where $d_P(x,y)=1-\mathrm{Corr}(x,y)$ and $\mathrm{RankDiff}$ is the sum $\sum_{j=1}^{r} w_j R_{(n-j+1)}$ of the $r=\lceil pn\rceil$ largest absolute element-wise differences, ordered and weighted by a probability vector $\mathbf{w}$. With uniform weights, $\mathrm{RankDiff}$ is just the mean of the largest $r$ gaps, so the parameter $\alpha$ controls how much the clustering leans on level differences versus shape correlation, and $p$ controls how many of the largest gaps are considered. This object does the argument's work: it lets a single hierarchical-clustering run separate series that share a level but differ in pattern, or share a pattern but differ in level.
What would settle it
A direct test is to fix RDPC's parameters by cross-validation on held-out subsets of M and MC (or on a separate collection of labeled seasonal/trend/peak time series) and then measure clustering accuracy; if RDPC no longer outperforms correlation-based hierarchical clustering, the reported advantage is an artifact of tuning to the evaluation datasets. The paper itself supplies enough detail to re-run this comparison with the same generators and baselines.
Extended reading notes
Core claim
The central discovery is that a simple convex combination of two classical notions—shape similarity via $1-\mathrm{Corr}(x,y)$ and level similarity via the average of the largest $\lceil pn\rceil$ absolute differences—produces a dissimilarity that is simultaneously sensitive to both, and that this combined measure, when used with complete-linkage hierarchical clustering, is more accurate than either perspective alone on the hard synthetic datasets. With the tuning chosen in the paper ($\alpha=0.2$, $p=0.1$, uniform weights), RDPC attains accuracies 0.9231, 1.0000, 1.0000, 0.9500, and 0.9286 on the M1, M2, M3, MC1, and MC2 datasets, higher than the corresponding accuracies of correlation-based hierarchical clustering, DTW, GAK, and K-means. The paper also shows that RDPC is a symmetric, non-negative function that is a metric in the limiting case $\alpha=1$ and that, for $\alpha=0$, it converges almost surely to unity for independent series.
Load-bearing premise
The load-bearing premise is that the synthetic datasets M and MC, together with the parameter values ($\alpha=0.2$, $p=0.1$) chosen because they maximize accuracy on exactly those datasets, faithfully represent the real-world “complicated cases” the method claims to handle.
Editorial extensions
If this is right
- A single dissimilarity can separate time series that differ in level, shape, or both, so hierarchical clustering with RDPC applies directly to domains like energy, water, and healthcare where raw scale carries meaning.
- On the five complicated synthetic datasets, the reported accuracy advantage over DTW and GAK suggests that time-warping alignment is the wrong tool when seasonality must be preserved, since warping January to April destroys the very pattern that defines a group.
- The elbow method, applied with RDPC, recovers the true number of clusters for the M and MC datasets, whereas the baselines' elbow points do not align with the true labels, indicating the measure gives usable cluster-count diagnostics in complicated settings.
- The application to Thai electricity-consumption data identifies small but interpretable consumer groups, such as winter users and users whose usage dropped sharply in a specific year, that would be missed by clustering on level or on correlation alone.
Reading between the lines
- The same ranked-differences construction could be paired with Spearman or Kendall correlation instead of Pearson, which would make the shape component robust to outliers and monotone rescaling while keeping the level-sensitive term.
- The parameter $\alpha$ could plausibly be set per dataset by an internal cluster-validity index rather than fixed at 0.2; the paper's own sensitivity table shows accuracy varies with $\alpha$, so a data-driven choice might generalize better to unseen data.
- The iterative two-group splitting used to remove the 157 high-usage users can be read as a standalone outlier-screening procedure; it could be tested as a general preprocessing step for skewed consumption data.
Signed reviews
Editorial analysis
A structured set of objections, weighed in public.
Referee Report
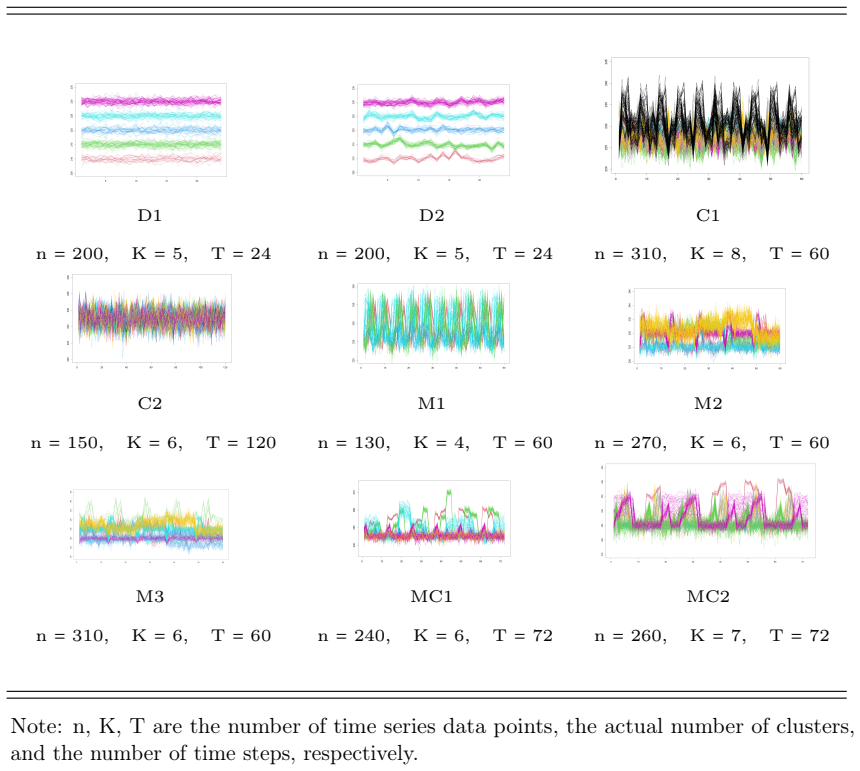
Summary. The paper proposes a new time-series dissimilarity, RDPC, defined as a convex combination of a ranked-differences term (a weighted average of a chosen fraction of the largest element-wise absolute differences) and the Pearson correlation dissimilarity. The authors integrate RDPC into hierarchical clustering and compare it with correlation-based hierarchical clustering, DTW, GAK, and K-means on nine simulated datasets, reporting superior accuracy on the four more complicated datasets (groups M and MC). They then apply the method to cluster 1,017 regular electricity users from a Thai utility into seven interpretable groups. The theoretical section proves nonnegativity, identity of indiscernibles, symmetry, and the triangle inequality under certain conditions.
Significance. If the empirical claims are validated, RDPC would be a useful and simple addition to the time-series clustering toolbox because it explicitly balances level information (absolute differences) with shape information (correlation), and the paper demonstrates interpretable clusters in a real electricity-consumption dataset. The construction is transparent, and the proofs for the uniform-weight case are mostly straightforward. However, no code or data are provided, and the main empirical evidence is weakened by the parameter-selection protocol, so the practical significance currently rests on a single favorable comparison.
major comments (3)
- [Section 4.1 and Table 3] The headline claim that RDPC outperforms other methods on groups M and MC is not supported by the experimental protocol, because the parameters p and alpha are selected on the same datasets later used for comparison. The text states that p=0.1 and alpha=0.2 "provides the best accuracy for groups M and MC; thus, we use these parameter values throughout the remainder of the work," and Table 3 then reports RDPC accuracies of 0.9231, 1.0000, 1.0000, 0.9500, and 0.9286 on exactly those datasets. With one simulated instance per dataset and 30 parameter combinations searched, the reported superiority is optimistically biased and cannot be interpreted as an intrinsic advantage. Please provide independent validation, for example by drawing fresh datasets from the same generators, using a train/test split for parameter selection, and reporting accuracy variability over multiple simulations.
- [Proposition 3.8] Proposition 3.8 is stated for the general weights w in Definition 3.1, but its proof is valid only for uniform weights. The step sum_j w_j R^xz_{i_j} <= sum_j w_j R^xz_(n-j+1) does not follow for arbitrary positive weights because the indices i_j are ordered by the x-y differences, not by the x-z differences; for uniform weights the inequality is true because the sum over any r indices is bounded by the sum of the r largest values. Please restrict the proposition to the uniform-weight setting actually used in the paper, or provide a correct proof for general weights.
- [Proposition 3.6] The claim that M2 holds "only for alpha>0" is false when p=0. In that case r=0, RankDiff is identically zero, and d_RDPC reduces to (1-alpha)d_P for alpha<1, which violates M2 for non-identical perfectly correlated vectors; for alpha=1, d_RDPC is identically zero. The statement should explicitly require p>0, or Definition 3.1 should be adjusted. The applications use p=0.1, so this is a statement-level error rather than a flaw in the empirical results, but it must be corrected.
minor comments (6)
- [Definition 3.1] The weight vector w=(w1,...,wr) is said to belong to R^n, but it has only r components; it should be R^r. The empty sum arising when p=0 should also be explicitly defined.
- [Section 2.3.3] The global alignment kernel reference appears as "[?]" in the text; it should be the numbered reference to Cuturi [22].
- [Definition 3.4] Axiom (M4) is written as an equality d(x,y)=d(x,z)+d(z,y), but the standard triangle inequality is d(x,z) <= d(x,y)+d(y,z), and the proof of Proposition 3.8 establishes the inequality version. Please correct the axiom statement.
- [Section 4.2 / Table 3] The term "accuracy" is not defined in the paper. Please specify how accuracy is computed (for example, as the proportion of correctly labeled series after matching cluster labels) and, ideally, report the variability across multiple simulation runs.
- [Section 4, group MC description] The sentence "This group is similar to RCM but more complicated" appears to contain a typo: there is no RCM group defined, and it should presumably read "similar to group M but more complicated."
- [Section 5] The choice of seven clusters is justified by a subjective reading of the elbow plot ("four distinct elbow points ... another slight elbow at nine"). A cluster validity index or a more objective selection rule would make the real-data demonstration more convincing.
Circularity Check
Hyperparameters (alpha, p) are tuned on the same M/MC datasets used for the headline comparison, so the reported outperformance in Table 3 is partly an artifact of selection on the evaluation set.
-
fitted input called prediction
[Section 4.1 (Sensitivity analysis) and Section 4.2 (Performance comparison), Table 3]
"The combination of p = 0.1 and α = 0.2 provides the best accuracy for groups M and MC; thus, we use these parameter values throughout the remainder of the work. ... In contrast, our d_RDPC method is substantially more accurate than the others for groups M and MC, with accuracy values of 0.9231, 1, 1, 0.95, and 0.9286."
The hyperparameter pair (alpha, p) is selected in Section 4.1 because it 'provides the best accuracy for groups M and MC' on the very same simulated datasets (M1-M3, MC1-MC2) that are then used in Table 3 as evidence of RDPC's superiority. Thus the reported accuracies 0.9231, 1, 1, 0.95, and 0.9286 are the result of maximizing accuracy on the evaluation data; no held-out set, no cross-validation, and no fresh simulations from the same generative process are used. The headline claim that 'RDPC outperforms others in complicated cases' therefore follows in part from the tuning step rather than from an independent property of the dissimilarity.
full rationale
The mathematical derivation of RDPC is self-contained: Definition 3.1-3.2 and Propositions 3.5-3.8 do not rely on the experimental results, and the dissimilarity is a genuine combination of RankDiff and Pearson correlation dissimilarity. The central issue is the performance claim. The paper tunes alpha = 0.2 and p = 0.1 on the same M and MC datasets that later appear in Table 3, where those tuned values are reported as evidence that RDPC 'is substantially more accurate than the others'. This is a fitted-input-called-prediction pattern: the comparison is not an independent benchmark because the parameters were selected to maximize accuracy on the evaluation data. There are no load-bearing self-citations; references [23] and [24] are only mentioned as future work for cluster validity indices and do not support the main claim. A separate correctness concern is the false inequality in the proof of Proposition 3.8, but that is not circularity. Overall, the empirical outperformance claim is partially circular or, more precisely, selection-biased, while the proposed dissimilarity itself retains independent content. Score 6 reflects that the central performance claim reduces in part to the tuning procedure, but the method definition and mathematical properties are not circular.
Assumptions & free parameters
free parameters (3)
- alpha (mixing weight) =
0.2
- p (fraction of largest differences) =
0.1
- number of clusters K for real data =
7
assumptions (3)
- standard math Strong law of large numbers applies to independent samples
- domain assumption Pearson correlation dissimilarity is a valid measure of pattern similarity for electricity load shapes
- ad hoc to paper The simulated datasets M and MC represent the real-world 'complicated cases' the paper targets
Cite this review
Pith. "Pith review of Ranked differences Pearson correlation dissimilarity with an application to electricity users time series clustering." pith.science (2026). https://pith.science/paper/4K73ZGZJ
@misc{pith2026250502173,
  author       = {Pith},
  title        = {Pith review of: Ranked differences Pearson correlation dissimilarity with an application to electricity users time series clustering},
  year         = {2026},
  howpublished = {\url{https://pith.science/paper/4K73ZGZJ}},
  note         = {Machine review of arXiv:2505.02173}
}
read the original abstract
Time series clustering is an unsupervised learning method for classifying time series data into groups with similar behavior. It is used in applications such as healthcare, finance, economics, energy, and climate science. Several time series clustering methods have been introduced and used for over four decades. Most of them focus on measuring either Euclidean distances or association dissimilarities between time series. In this work, we propose a new dissimilarity measure called ranked Pearson correlation dissimilarity (RDPC), which combines a weighted average of a specified fraction of the largest element-wise differences with the well-known Pearson correlation dissimilarity. It is incorporated into hierarchical clustering. The performance is evaluated and compared with existing clustering algorithms. The results show that the RDPC algorithm outperforms others in complicated cases involving different seasonal patterns, trends, and peaks. Finally, we demonstrate our method by clustering a random sample of customers from a Thai electricity consumption time series dataset into seven groups with unique characteristics.
Figures


Figures from the paper (5 more)



Forward citations
Cited by 1 Pith paper
-
4TaStiC: Time and trend traveling time series clustering for classifying long-term type 2 diabetes patients
4TaStiC, a dissimilarity that shifts time and tilts trends for time series, outperforms seven baselines on synthetic data and separates 1,989 type 2 diabetes patients into seven HbA1c trajectory groups.
Reference graph
Works this paper leans on
- [1]
-
[2]
P. Ragavan, A. Ananth, and M.R.Rajan, “Impact of selenium nanoparticles on growth, biochemical characteristics and yield of cluster bean cyamopsis tetragonoloba,”International Journal of Environment Agriculture and Biotechnology, vol. 2, no. 6, pp. 2917–2926, 2017
work page 2017
-
[3]
N. C. Cizungu, E. Tshibasu, E. Lutete, C. A. Mushagalusa, Y. Mugumaarhahama, D. Ganza, K. Karume, B. Michel, R. Lumbuenamo, and J. Bogaert, “Fire risk assessment, spatiotemporal clustering and hotspot analysis in the luki biosphere reserve region, western dr congo,”Trees, Forests and People, vol. 5, p. 100104, 2021. [Online]. Available:https://www.science...
work page 2021
-
[4]
Some methods for classification and analysis of multivariate observations,
J. B. MacQueen, “Some methods for classification and analysis of multivariate observations,” in Proc. of the fifth Berkeley Symposium on Mathematical Statistics and Probability, L. M. L. Cam and J. Neyman, Eds., vol. 1. University of California Press, 1967, pp. 281–297
work page 1967
-
[5]
R. C. Tryon, Cluster Analysis; Correlation Profile and Orthometric (Factor) Analysis for the Isolation of Unities in Mind and Personality. Edwards Brother, Inc., Lithoprinters and Publishers, 1939
work page 1939
-
[6]
A fuzzy relative of the isodata process and its use in detecting compact well- separated clusters,
J. C. Dunn, “A fuzzy relative of the isodata process and its use in detecting compact well- separated clusters,”Journal of Cybernetics, vol. 3, no. 3, pp. 32–57, 1973. [Online]. Available: https://doi.org/10.1080/01969727308546046
-
[7]
Maximum likelihood from incomplete data via the em algorithm,
A. P. Dempster, N. M. Laird, and D. B. Rubin, “Maximum likelihood from incomplete data via the em algorithm,”Journal of the Royal Statistical Society: Series B (Methodological), vol. 39, no. 1, pp. 1–22, 2018
work page 2018
-
[8]
A density-based algorithm for discovering clusters in large spatial databases with noise,
M. Ester, H.-P. Kriegel, J. Sander, and X. Xu, “A density-based algorithm for discovering clusters in large spatial databases with noise,” inProceedings of the Second International Conference on Knowledge Discovery and Data Mining, ser. KDD’96. AAAI Press, 1996, p. 226–231. 16
work page 1996
Show all 24 references
-
[9]
Dynamic programming algorithm optimization for spoken word recognition,
H. Sakoe and S. Chiba, “Dynamic programming algorithm optimization for spoken word recognition,” IEEE Transactions on Acoustics, Speech, and Signal Processing, vol. 26, no. 1, pp. 43–49, 1978
1978
-
[10]
Consumer segmentation based on use patterns,
J. J. Fern´andez-Dur´an and M. M. Gregorio-Dom´ınguez, “Consumer segmentation based on use patterns,”Journal of Classification, vol. 38, no. 1, pp. 72–88, 2021. [Online]. Available: https://doi.org/10.1007/s00357-019-09360-2
2021 doi
-
[11]
Zero-inflated time series clustering via ensemble thick-pen transform,
M. Kim, H.-S. Oh, and Y. Lim, “Zero-inflated time series clustering via ensemble thick-pen transform,” Journal of Classification, vol. 40, no. 2, pp. 407–431, 2023. [Online]. Available: https://doi.org/10.1007/s00357-023-09437-z
2023 doi
-
[12]
Co-clustering of time-dependent dat via the shape invariant model,
A. Casa, C. Bouveyron, E. Erosheva, and G. Menardi, “Co-clustering of time-dependent dat via the shape invariant model,”Journal of Classification, vol. 38, no. 3, pp. 626–649, 2021. [Online]. Available: https://doi.org/10.1007/s00357-021-09402-8
2021 doi
-
[13]
Correlation-based hierarchical clustering of time series with spatial constraints,
A. Benevento and F. Durante, “Correlation-based hierarchical clustering of time series with spatial constraints,”Spatial Statistics, vol. 59, p. 100797, 2024
2024
-
[14]
Hierarchical clustering of time series data with parametric derivative dynamic time warping,
M. Luczak, “Hierarchical clustering of time series data with parametric derivative dynamic time warping,” Expert Systems with Applications, vol. 62, pp. 116–130, 2016. [Online]. Available: https://www.sciencedirect.com/science/article/pii/S0957417416302937
2016
-
[15]
Time-series k-means in causal inference and mechanism clustering for financial data,
S. Bo and M. Xiao, “Time-series k-means in causal inference and mechanism clustering for financial data,” 2025. [Online]. Available:https://arxiv.org/abs/2202.03146
2025 arXiv
-
[16]
On clustering multimedia time series data using k-means and dynamic time warping,
V. Niennattrakul and C. A. Ratanamahatana, “On clustering multimedia time series data using k-means and dynamic time warping,” in2007 International Conference on Multimedia and Ubiquitous Engineering (MUE’07), 2007, pp. 733–738
2007
-
[17]
Solar radiation intensity probabilistic forecasting based on k-means time series clustering and gaussian process regression,
Z. Zhang, C. Wang, X. Peng, H. Qin, H. Lv, and J. Fu, “Solar radiation intensity probabilistic forecasting based on k-means time series clustering and gaussian process regression,”IEEE Access, vol. 9, pp. 89 079–89 092, 2021
2021
-
[18]
Analysis of electricity consumption pattern clustering and electricity consumption behavior,
L. Zhu, J. Liu, C. Hu, Y. Zhi, and Y. Liu, “Analysis of electricity consumption pattern clustering and electricity consumption behavior,”Energy Engineering, vol. 121, no. 9, pp. 2639–2653, 2024
2024
-
[19]
K-means clustering of electricity consumers using time-domain features from smart meter data,
G. Okereke, M. C. Bali, C. N. Okwueze, E. Ukekwe, S. C. Echezona, and C. Ugwu, “K-means clustering of electricity consumers using time-domain features from smart meter data,”Journal of Electrical Systems and Information Technology, vol. 10, 2023
2023
-
[20]
On clustering time series using euclidean distance and pearson correlation,
M. R. Berthold and F. H¨oppner, “On clustering time series using euclidean distance and pearson correlation,” 2016. [Online]. Available:https://arxiv.org/abs/1601.02213
2016 arXiv
-
[21]
Boehmke and B
B. Boehmke and B. M. Greenwell,Hands-On Machine Learning with R, 1st ed. New York: Chapman and Hall/CRC, 2019, first published 2019. eBook published 7 November 2019
2019
-
[22]
Fast global alignment kernels,
M. Cuturi, “Fast global alignment kernels,” inProceedings of the 28th International Conference on International Conference on Machine Learning, ser. ICML’11. Madison, WI, USA: Omnipress, 2011, p. 929–936
2011
-
[23]
Clustering performance analysis using a new correlation-based cluster validity index,
N. Wiroonsri, “Clustering performance analysis using a new correlation-based cluster validity index,” Pattern Recognition, vol. 145, p. 109910, 2024. [Online]. Available: https://www. sciencedirect.com/science/article/pii/S0031320323006088 17
2024
-
[24]
A bayesian cluster validity index,
O. Preedasawakul and N. Wiroonsri, “A bayesian cluster validity index,”Computational Statistics Data Analysis, vol. 202, p. 108053, 2025. [Online]. Available:https://www.sciencedirect. com/science/article/pii/S0167947324001373 18
2025
Reviewed August 16, 2026 · model on record in the stance chip above.
Discussion (0). Continue with ORCID to comment.