REVIEW 3 major objections 5 minor 41 references
Prospects for Wideband VLBI Correlation in the Cloud
T0 review · 3 major / 5 minor · reviewed 2026-08-14 · deepseek-v4-flash
Pith's one-line read The paper argues that cloud-based parallel correlation can process a petabyte-scale wideband VLBI observation in about four hours, and that this makes cloud computing a realistic alternative to a dedicated cluster correlator.
desk verdict Solid, honest benchmark study of cloud VLBI correlation; production-scale numbers are extrapolations but the feasibility case holds. read the letter →
The pith
A machine-rendered reading of the paper's core claim, the machinery that carries it, and where it could break.
The reading
What carries the argument
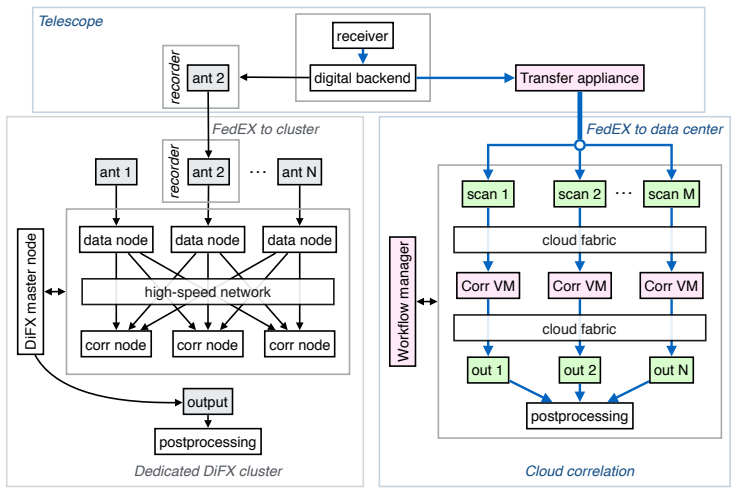
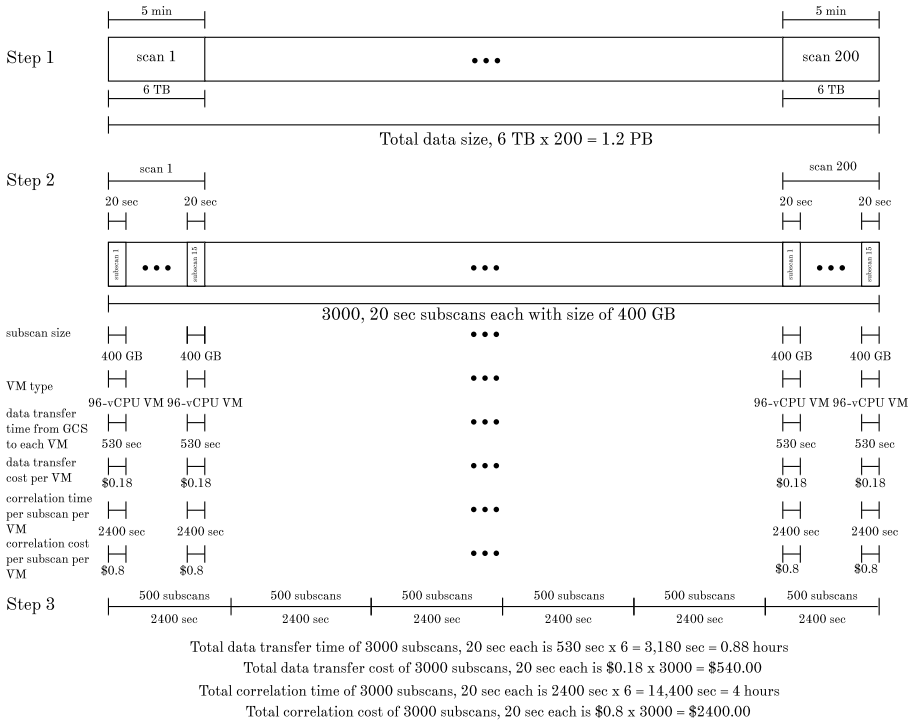
The load-bearing mechanism is a scan-parallel correlation architecture: a VLBI experiment is chopped into short 20-second subscans of roughly 400 GB, each is staged independently in cloud storage, and each is correlated on its own 96-vCPU virtual machine running the DiFX-2.5.2 software correlator, an open-source VLBI software package that performs per-station FFTs and per-baseline cross-multiplications. The quantitative engine of the argument is the measured quadratic scaling law for correlation time with station number, together with the measured per-machine transfer ceiling of about 6 Gbps from cloud storage. These two measurements are what turn into the paper's headline extrapolation: 3000 parallel virtual machines, six consecutive batches of 500, correlate a 1.2 PB experiment in about four hours.
What would settle it
Correlate a genuine multi-station observation longer than 20 seconds, say a full 5-minute scan, on the same 96-vCPU virtual machine and check whether the wall-clock time is close to 15 times the 2400-second subscan benchmark; if it is substantially worse, the linear-scaling assumption fails. In parallel, launch 10, 100, and 1000 virtual machines reading separate subscans from the same storage bucket and measure whether the per-machine transfer rate stays near 6 Gbps; if it drops, the four-hour, 3000-VM estimate is too optimistic.
Extended reading notes
Core claim
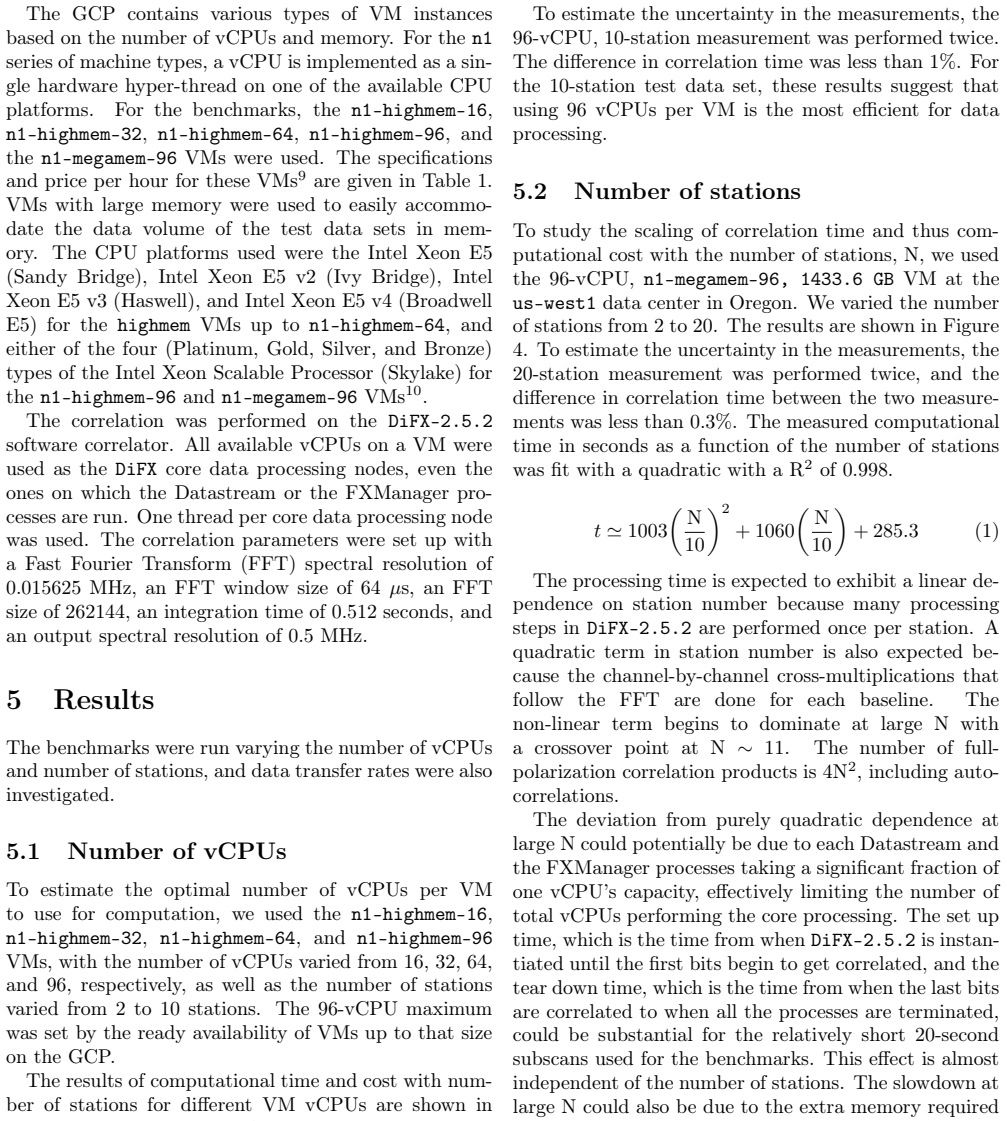
The central claim is that shifting wideband VLBI correlation to the cloud is an alternative path that should be explored for high-data-rate, low-duty-cycle observations. On synthetic arrays built by copying a single Event Horizon Telescope recording, DiFX-2.5.2 running on a 96-vCPU virtual machine correlates a 20-second, 10-station, 400 GB subscan in about 2400 seconds, with essentially identical output to the same correlation run on a dedicated local cluster. Correlation time grows with station count as $t \simeq 1003\,(N/10)^2 + 1060\,(N/10) + 285.3$ seconds, a fit with $R^2 = 0.998$, and data transfer from cloud storage to a virtual machine saturates near 6 Gbps without degrading when two machines transfer in parallel. Scaling those numbers to a 10-station, 1.2 PB observation split into 3000 subscans gives roughly four hours of total correlation time and, using preemptible virtual machines, a 16 Gbps cost near $32,700, or about $130,800 at the 64 Gbps rate typical of current Event Horizon Telescope experiments.
Load-bearing premise
The benchmarks were run on 20-second subscans from a synthetic array in which every station is a copy of one Event Horizon Telescope recording, and the paper assumes those timings scale linearly to longer real-world scans; the 3000-VM plan also assumes that many hundreds of concurrent virtual machines can each transfer data at the same per-machine rate, a concurrency that was only measured for two machines.
Editorial extensions
If this is right
- A 1.2 PB VLBI experiment could go from raw recorded data to correlated products in about four hours of wall-clock time instead of the weeks that a conventional cluster might require, cutting the time between observation and science.
- Because cloud resources are rented per subscan and released when done, cost tracks actual usage; an idle owned cluster, in contrast, keeps accruing power, cooling, and support costs.
- Preemptible virtual machines, which last up to 24 hours and cost much less, are sufficient for this workload because a single 400 GB subscan correlation finishes in about 2400 seconds.
- The dominant cloud cost is storage, not computation, so strategies that compress the staging window or use cheaper storage classes (nearline or coldline) matter more to the total bill than compute pricing.
- International teams could monitor and validate correlations remotely, since the data live in cloud storage rather than on hard drives that must be physically mounted on a local cluster.
Reading between the lines
- If the linear scaling from 20-second subscans to longer scans holds in a real observation, the architecture should be tested end-to-end on a full 5-minute scan; a live multi-station experiment would also reveal whether shipping and recording onto transfer appliances, which the paper did not test, is the practical bottleneck.
- The quadratic station-count term implies that cloud correlation economics favor arrays with moderate numbers of stations but very high per-station bandwidth; adding stations raises cost faster than adding bandwidth per station.
- The paper's own observation that DiFX supports streaming input suggests a natural extension: if data can flow from storage into the correlator while it processes, the separate transfer step and its cost disappear, further tilting the economics toward the cloud.
- Storage pricing is the largest single cloud line item, so if regional storage prices fall as they have historically, the cloud-vs-cluster crossover moves further toward cloud even under optimistic cluster utilization assumptions.
Signed reviews
Editorial analysis
A structured set of objections, weighed in public.
Referee Report
Summary. The paper proposes and benchmarks a cloud-based architecture for correlating wideband VLBI data using the DiFX-2.5.2 software correlator on the Google Cloud Platform. It measures correlation time as a function of the number of vCPUs and the number of stations, fits a quadratic scaling law (Eq. 1), measures Google Cloud Storage to VM transfer rates for one and two VMs, and constructs a cost model comparing cloud correlation with a hypothetical 1000-core cluster for a 1.2 PB, 10-station observation. The production example uses 3000 VMs in six waves of 500, with a stated correlation time of about 4 hours and total cloud cost of roughly $131k for a 64 Gbps experiment. The authors conclude that cloud correlation is an alternative worth exploring for high-data-rate, low-duty-cycle wideband VLBI, while explicitly deferring an end-to-end test to future work.
Significance. If the benchmark results hold at production scale, this work provides a useful quantitative starting point for a credible cloud-based path for petabyte-scale VLBI correlation. The benchmark methodology is clearly described, repeated measurements agree to better than 1%, the scaling fit has R^2 = 0.998, and the cost model is transparent about its assumptions and about the fact that cloud prices are a moving target. These are genuine strengths. The central claim is, however, explicitly exploratory rather than a demonstrated production capability, and the paper's own Section 8 acknowledges that an end-to-end test observation is still needed. The main contribution is therefore a well-documented feasibility study rather than a validated operational pipeline.
major comments (3)
- [§5.4, Fig. 6; §6.3] The reported ~4-hour production wall-clock is compute-only. In the benchmark operational model, correlation does not begin until raw data has been transferred in full to the VMs (Section 6.3), and Figure 6 lists a per-VM data transfer time of 530 s. With six sequential waves of 500 VMs, the total elapsed time is 6 × (2400 + 530) s ≈ 4.9 hours, not 4 hours; the 0.88-hour transfer time is presented alongside but is never added to the correlation time. Please report a total elapsed time or clearly show how transfer is pipelined across waves, and adjust the abstract and Section 5.4 if the headline number is meant to be total wall-clock time.
- [§5.3, §5.4] The production design assumes that the ~6 Gbps per-VM transfer rate from Google Cloud Storage is independent of concurrency, but this was measured only with one and two VMs (Section 5.3). The production configuration uses 500 VMs per wave, and Section 5.4 conditions the extrapolation on the assumption that bottlenecks are not encountered. If aggregate bucket or regional egress bandwidth saturates, per-VM transfer time and cost increase, which would raise both the wall-clock estimate and the $540 transfer cost. This is an untested assumption that is load-bearing for the production estimate; it should either be validated at higher concurrency or presented with a sensitivity estimate.
- [§4, §5.2] All compute benchmarks use 20-second subscans from a single EHT recording duplicated into synthetic 10- and 20-station arrays, and Section 4 asserts that 'the 20-second benchmark results can be scaled linearly to longer scans' without a dedicated test. The production example subdivides 5-minute scans into 20-second subscans, so the per-subscan correlation time carries over, but the linear-scaling claim itself is unverified. Since Section 5.2 notes that setup and teardown time may be substantial for short subscans, a short benchmark with a longer scan (or an explicit accounting of the setup/teardown component) is needed to support the scaling statement.
minor comments (5)
- [Table 3] The table header '4.8 GB data set' should read '4.8 PB data set'.
- [Figure 6] The labels 'Total correlation time' and 'Total data transfer time' are easy to misread as a single pipeline total; consider adding a third label for the combined wall-clock time or a note that transfer and correlation are sequential in the benchmark model.
- [§5.1] The sentence 'The 16 and 32-vCPU benchmarks were only done up to 5 and 6 stations, respectively' is ambiguous because the figure shows 16-vCPU data to 5 stations and 32-vCPU data to 6 stations; please clarify the correspondence.
- [§2.2] There is a typo in 'satelliterangenetwork' near the discussion of the satellite range network; a space is missing.
- [Eq. (1)] The fitted coefficients 1003, 1060, and 285.3 have units of seconds but this is not stated; please add the units explicitly.
Circularity Check
No circularity: the paper reports benchmarks and fitted scaling curves as measurements, and its production estimates are explicitly labeled extrapolations.
full rationale
The paper's derivation chain is empirical and self-contained: it measures DiFX-2.5.2 correlation times on GCP VMs, measures GCS-to-VM transfer rates, and combines these with published cloud prices. Equation (1) is explicitly a fit to measured data, not a first-principles prediction: 'The measured computational time in seconds as a function of the number of stations was fit with a quadratic with a R2 of 0.998.' The headline 4-hour production figure uses the directly measured ~2400 s per 10-station, 96-vCPU, 20-second subscan, and the 0.88-hour transfer figure uses the measured ~530 s. The paper also clearly labels its extrapolations as assumptions, e.g., 'with the assumption that bottlenecks are not encountered' when scaling transfer to 500 VMs, and 'the 20-second benchmark results can be scaled linearly to longer scans.' It explicitly defers an end-to-end demonstration: 'A test observation is envisaged as an acid test of the operational framework.' These are limitations and extrapolations, not circular reductions. Agreement with cluster correlation on identical datasets provides an independent external benchmark, and no load-bearing self-citation or imported uniqueness theorem is used. No fitted parameter is renamed as a prediction, and no result is equivalent to its inputs by construction.
Assumptions & free parameters
free parameters (3)
- Quadratic scaling coefficient 1003 =
1003 seconds
- Quadratic scaling coefficient 1060 =
1060 seconds
- Quadratic scaling coefficient 285.3 =
285.3 seconds
assumptions (6)
- domain assumption The 20-second subscan benchmark results can be scaled linearly to longer scans.
- domain assumption The synthetic array with all stations as copies of the same recording is representative of real VLBI arrays for correlation performance.
- domain assumption Data transfer rate from Google Cloud Storage to VMs is independent of the number of simultaneous VMs.
- domain assumption Google Transfer Appliances (GTAs) can record data reliably at telescope sites.
- domain assumption Preemptible VMs will not be terminated during the approximately 4-hour correlation window.
- domain assumption The cluster cost prorating assumptions (8% cluster utilization, 25% media utilization) are valid for a fair comparison.
Cite this review
Pith. "Pith review of Prospects for Wideband VLBI Correlation in the Cloud." pith.science (2026). https://pith.science/paper/4KUHS6AN
@misc{pith2026190803991,
  author       = {Pith},
  title        = {Pith review of: Prospects for Wideband VLBI Correlation in the Cloud},
  year         = {2026},
  howpublished = {\url{https://pith.science/paper/4KUHS6AN}},
  note         = {Machine review of arXiv:1908.03991}
}
read the original abstract
This paper proposes a cloud architecture for the correlation of wide bandwidth VLBI data. Cloud correlation facilitates processing of entire experiments in parallel using flexibly allocated and practically unlimited compute resources. This approach offers a potential improvement over dedicated correlation clusters, which are constrained by a fixed number of installed processor nodes and playback units. Additionally, cloud storage offers an alternative to maintaining a fleet of hard-disk drives that might be utilized intermittently. We describe benchmarks of VLBI correlation using the DiFX-2.5.2 software on the Google Cloud Platform to assess cloud-based correlation performance. The number of virtual CPUs per Virtual Machine was varied to determine the optimum configuration of cloud resources. The number of stations was varied to determine the scaling of correlation time with VLBI arrays of different sizes. Data transfer rates from Google Cloud Storage to the Virtual Machines performing the correlation were also measured. We also present an example cloud correlation configuration. Current cloud service and equipment pricing data is used to compile cost estimates allowing an approximate economic comparison between cloud and cluster processing. The economic comparisons are based on cost figures which are a moving target, and are highly dependent on factors such as the utilization of cluster and media, which are a challenge to estimate. Our model suggests that shifting to the cloud is an alternative path for high data rate, low duty cycle wideband VLBI correlation that should continue to be explored. In the production phase of VLBI correlation, the cloud has the potential to significantly reduce data processing times and allow the processing of more science experiments in a given year for the petabyte-scale data sets increasingly common in both astronomy and geodesy VLBI applications.
Figures

Figures from the paper (4 more)


Reference graph
Works this paper leans on
-
[1]
Abbott, B. P. et al. (2017). A gravitational-wave standard siren measurement of the Hubble constant . Nature , 551(7678):85--88
work page 2017
-
[2]
Akiyama, K. et al. (2015). 230 GHz VLBI observations of M87: event-horizon-scale structure during an enhanced very-high-energy -ray state in 2012 . ApJ , 807(2):150
work page 2015
-
[3]
Bartel , N. et al. (2000). The Changing Morphology and Increasing Deceleration of Supernova 1993J in M81 . Science , 287:112--116
work page 2000
-
[4]
F., De Colle, F., Granot, J., Bartel, N., and Soderberg, A
Bietenholz, M. F., De Colle, F., Granot, J., Bartel, N., and Soderberg, A. M. (2014). Radio limits on off-axis GRB afterglows and VLBI observations of SN 2003gk . MNRAS , 440(1):821--832
work page 2014
-
[5]
Cappallo, R., Ruszczyk, C., and Whitney, A. (2013). Mark6: Design and Status . Haystack Mark 6 Memo Series, Memo 005
work page 2013
-
[6]
Clark , B. G., Cohen , M. H., and Jauncey , D. L. (1967). Angular Size of 3c 273B . ApJL , 149:L151
work page 1967
-
[7]
Deller, A. T., Brisken, W. F., Phillips, C. J., Morgan, J., Alef, W., Cappallo, R., Middelberg, E., Romney, J., Rottmann, H., Tingay, S. J., and Wayth, R. (2011). DiFX -2: A more flexible, efficient, robust, and powerful software correlator. PASP , 123(901):275--287
work page 2011
-
[8]
Deller, A. T., Tingay, S. J., Bailes, M., and West, C. (2007). DiFX : A software correlator for very long baseline interferometry using multiprocessor computing environments. PASP , 119(853):318--336
work page 2007
Show all 41 references
-
[9]
Doeleman, S. et al. (2008). Event-horizon-scale structure in the supermassive black hole candidate at the Galactic Centre . Nature , 455:78
2008
-
[10]
Doeleman , S. et al. (2009). Imaging an Event Horizon: submm-VLBI of a Super Massive Black Hole . In Astro2010: The Astronomy and Astrophysics Decadal Survey , volume 2010, page 68
2009
-
[11]
Doeleman , S. S. et al. (2012). Jet-Launching Structure Resolved Near the Supermassive Black Hole in M87 . Science , 338(6105):355
2012
-
[12]
S., Hough, D
Doeleman, S. S., Hough, D. H., Kulkarni, S. R., Lonsdale, C. J., Marscher, A. P., O'Dea, C. P., Taylor, G. B., Wilner, D. J., and Wrobel, J. M. (2004). Mapping the F uture of VLBI S cience in the US
2004
-
[13]
Event Horizon Telescope Collaboration et al. (2019a). First M87 Event Horizon Telescope Results. I. The Shadow of the Supermassive Black Hole . ApJ , 875(1):L1
2019
-
[14]
Event Horizon Telescope Collaboration et al. (2019b). First M87 Event Horizon Telescope Results. II. Array and Instrumentation . ApJ , 875(1):L2
2019
-
[15]
Event Horizon Telescope Collaboration et al. (2019c). First M87 Event Horizon Telescope Results. IV. Imaging the Central Supermassive Black Hole . ApJ , 875(1):L4
2019
-
[16]
Fish , V. et al. (2013). High-Angular-Resolution and High-Sensitivity Science Enabled by Beamformed ALMA . arXiv e-prints , page arXiv:1309.3519
2013 arXiv
-
[17]
Fish , V. L. et al. (2011). 1.3 mm Wavelength VLBI of Sagittarius A*: Detection of Time-variable Emission on Event Horizon Scales . ApJ , 727(2):L36
2011
-
[18]
Johnson, M. D. et al. (2015). Resolved Magnetic-Field Structure and Variability Near the Event Horizon of Sagittarius A* . Science , 350(6265):1242--1245
2015
-
[19]
Koopmans , L. V. E. and Treu , T. (2002). The Stellar Velocity Dispersion of the Lens Galaxy in MG 2016+112 at z=1.004 . ApJL , 568:L5--L8
2002
-
[20]
Lu , R. S. et al. (2018). Detection of Intrinsic Source Structure at 3 Schwarzschild Radii with Millimeter-VLBI Observations of SAGITTARIUS A ^ * . ApJL , 859:60
2018
-
[21]
J., and Koopmans , L
Mao , S., Witt , H. J., and Koopmans , L. V. E. (2001). The influence of central black holes on gravitational lenses . MNRAS , 323:301--307
2001
-
[22]
D., Crew, G
Matthews, L. D., Crew, G. B., Doeleman, S. S., et al. (2017). The ALMA phasing system: A beamforming capability for ultra-high-resolution science at (sub)millimeter wavelengths. PASP , 130(983):015002
2017
-
[23]
Miller-Jones , J. C. A., Jonker , P. G., Dhawan , V., Brisken , W., Rupen , M. P., Nelemans , G., and Gallo , E. (2009). The First Accurate Parallax Distance to a Black Hole . ApJ , 706(2):L230--L234
2009
-
[24]
M., Crowther, P
Moran, J. M., Crowther, P. P., Burke, B. F., Barrett, A. H., Rogers, A. E. E., Ball, J. A., Carter, J. C., and Bare, C. C. (1967). Spectral line interferometry with independent time standards at stations separated by 845 kilometers. Science , 157(3789):676--677
1967
-
[25]
A., Wilson , R
Patel , N. A., Wilson , R. W., Primiani , R., Weintroub , J., Test , J., and Young , K. (2014). Characterizing the Performance of a High-Speed ADC for the Sma Digital Backend . Journal of Astronomical Instrumentation , 3:1
2014
-
[26]
Reid, M. J. et al. (2009). Trigonometric Parallaxes of Massive Star Forming Regions: VI. Galactic Structure, Fundamental Parameters and Non-Circular Motions . ApJ , 700(1):137--148
2009
-
[27]
Reid , M. J. and Honma , M. (2014). Microarcsecond Radio Astrometry . Annu. Rev. Astronomy and Astrophysics , 52:339--372
2014
-
[28]
J., McClintock , J
Reid , M. J., McClintock , J. E., Narayan , R., Gou , L., Remillard , R. A., and Orosz , J. A. (2011). The Trigonometric Parallax of Cygnus X-1 . ApJ , 742(2):83
2011
-
[29]
and Behrend, D
Schl \"u ter, W. and Behrend, D. (2007). The International VLBI Service for Geodesy and Astrometry (IVS): current capabilities and future prospects . J. Geodesy , 81(6):379--387
2007
-
[30]
and Behrend, D
Schuh, H. and Behrend, D. (2012). VLBI: A fascinating technique for geodesy and astrometry . Journal of Geodynamics , 61:68 -- 80
2012
-
[31]
A., Cockerill, T
Stewart, C. A., Cockerill, T. M., Foster, I., Hancock, D., Merchant, N., Skidmore, E., Stanzione, D., Taylor, J., Tuecke, S., Turner, G., Vaughn, M., and Gaffney, N. I. (2015). Jetstream: A self-provisioned, scalable science and engineering cloud environment. In Proceedings of...
2015
-
[32]
B., Frail, D
Taylor, G. B., Frail, D. A., Kulkarni, S. R., Shepherd, D. S., Feroci, M., and Frontera, F. (1998). The Discovery of the Radio Afterglow from the Optically Dim Gamma-Ray Burst of 1998 March 29 . ApJ , 502(2):L115--L118
1998
-
[33]
R., Moran , J
Thompson , A. R., Moran , J. M., and Swenson , Jr., G. W. (2017). Interferometry and Synthesis in Radio Astronomy, 3rd Edition
2017
-
[34]
Towns , J. et al. (2014). XSEDE: Accelerating Scientific Discovery . Computing in Science and Engineering , 16(5):62--74
2014
-
[35]
van Langevelde , H. J. (2006). Data processing software for radio astronomy . In Proceedings of the 8th European VLBI Network Symposium , page 55
2006
-
[36]
B., McWhirter, S
Vertatschitsch, L., Primiani, R., Young, A., Weintroub, J., Crew, G. B., McWhirter, S. R., Beaudoin, C., Doeleman, S., and Blackburn, L. (2015). R2DBE: A Wideband Digital Backend for the Event Horizon Telescope . PASP , 127(958):1226--1239
2015
-
[37]
Walker, C., Romney, J., Brisken, W., and Durand, S. (2007). A proposal to increase the sensitivity of the VLBA . NRAO VLBA Memo 15
2007
-
[38]
C., Ruthven , A., Davies , G., Lagos , B., and Christie , D
Weston , S., Gulyaev , S., Kim , B., Litchfield , A., Hall , D., Curtis , J., Yun , T. C., Ruthven , A., Davies , G., Lagos , B., and Christie , D. (2017). Towards Cloud Correlation of VLBI Data. In Haas , R. and Elgered , G., editors, 23rd European VLBI Group for Geodesy and ...
2017
-
[39]
Whitney , A. R. et al. (2013). Demonstration of a 16 Gbps Station ^ -1 Broadband-RF VLBI System . PASP , 125:196
2013
-
[40]
N., Rusin, D., and Kochanek, C
Winn, J. N., Rusin, D., and Kochanek, C. S. (2004). The Central image of a gravitationally lensed quasar . Nature , 427:613
2004
-
[41]
and Riehm , T
Zackrisson , E. and Riehm , T. (2010). Gravitational Lensing as a Probe of Cold Dark Matter Subhalos . Advances in Astronomy , 2010:478910
2010
Reviewed August 14, 2026 · model on record in the stance chip above.
Discussion (0). Continue with ORCID to comment.