REVIEW 2 major objections 1 minor 46 references
Center-to-limb variations of solar active regions: Observations of spots, faculae, and network in the 6173 \AA\ continuum
T0 review · 2 major / 1 minor · reviewed 2026-06-30 · grok-4.3
Pith's one-line read Solar active region components except umbra show reduced limb darkening after stray light correction, unlike PHOENIX and ATLAS models.
desk verdict New separated CLV profiles for umbra/penumbra/faculae/network from five regions; models miss the limb behavior but sample is narrow. read the letter →
The pith
A machine-rendered reading of the paper's core claim, the machinery that carries it, and where it could break.
The reading
What carries the argument
Center-to-limb variation profiles of 6173 Å continuum intensity for spots, faculae, and network, derived from HMI observations after stray light correction.
What would settle it
High-resolution observations of a large sample of diverse active regions that show umbra-like darkening or no contrast peak near μ=0.3 for faculae and network would falsify the reported CLV behaviors.
Extended reading notes
Core claim
Relative to the quiet Sun, all active region components except the umbra display reduced darkening toward the limb after stray light correction. Faculae and network exhibit contrast enhancements that peak near μ ≈ 0.3, reaching maxima of approximately 4% and 2% respectively, while the spot-to-quiet-Sun contrast rises to approximately 15% near the limb. This behavior occurs in both stable and strongly evolving regions and is not captured by synthetic CLVs based on PHOENIX and ATLAS model atmospheres.
Load-bearing premise
The four simple round alpha-sunspots plus one evolving region are representative of solar active regions in general.
Editorial extensions
If this is right
- Three-dimensional structure and viewing geometry changes near the limb drive the observed contrast shifts in active regions.
- Standard one-dimensional model atmospheres are insufficient for accurate modeling of stellar activity effects.
- Strongly evolving active regions produce CLV profiles similar to stable ones.
- Improved treatments of active region structure are required for radial-velocity and transmission-spectroscopy studies of exoplanets.
Reading between the lines
- Three-dimensional magnetohydrodynamic models of active regions may be needed to reproduce the measured contrast peaks.
- The μ ≈ 0.3 contrast maximum could introduce systematic errors in stellar variability corrections for transit spectroscopy.
- Extending these continuum measurements to other wavelengths would test whether the CLV mismatch is wavelength-dependent.
- A larger statistical sample of active regions would clarify how representative the reported profiles are.
Signed reviews
Editorial analysis
A structured set of objections, weighed in public.
Referee Report
Summary. The manuscript reports center-to-limb variation (CLV) measurements of the 6173 Å continuum intensity for solar active region components (spots including umbra/penumbra, faculae, network) and quiet Sun using SDO/HMI data. The study is based on four simple round α-sunspots plus one strongly evolving region. After stray-light correction, the authors find reduced limb darkening (except for umbra), facular/network contrast excesses peaking near μ ≈ 0.3 at ~4% and ~2%, and spot-to-quiet-Sun contrast rising to ~15% near the limb. Evolving regions show no significant CLV difference from stable ones, and the observed behaviors are not reproduced by PHOENIX or ATLAS synthetic CLVs.
Significance. If the results hold, they supply empirical CLV constraints on solar active regions that are directly relevant to stellar activity modeling for exoplanet radial-velocity and transmission spectroscopy. The reported discrepancy with standard 1D model atmospheres underscores the importance of 3D structure in ARs. Use of public HMI data with an explicit stray-light correction is a methodological strength.
major comments (2)
- [Abstract] Abstract: The central claims about CLV behavior of solar active regions in general rest on a sample of only four simple round α-sunspots and one strongly evolving region. No evidence or justification is given that this sample spans the range of AR sizes, magnetic complexities, field strengths, or evolutionary states needed to support generalization of the quantitative contrast values and the statement that 'this behavior is not captured by synthetic CLVs'.
- [Abstract] Abstract: The additional claim that 'strongly evolving active regions do not appear to display significantly altered CLV profiles compared to stable active regions' is based on a single evolving region (n=1). Without reported uncertainties, statistical tests, or error analysis, this conclusion lacks a clear basis for assessing significance.
minor comments (1)
- The abstract and presumably the methods section provide limited detail on data selection criteria, exact stray-light correction procedure, error propagation, and statistical significance of the reported contrast maxima (4%, 2%, 15%). These should be expanded for reproducibility.
Simulated Author's Rebuttal
We thank the referee for the constructive report and for recognizing the potential relevance of these CLV measurements to stellar activity modeling. We address each major comment below. The limited sample size is a genuine constraint on generalization, and we have revised the manuscript to qualify our statements accordingly while preserving the observational results from the regions studied.
read point-by-point responses
-
Referee: [Abstract] Abstract: The central claims about CLV behavior of solar active regions in general rest on a sample of only four simple round α-sunspots and one strongly evolving region. No evidence or justification is given that this sample spans the range of AR sizes, magnetic complexities, field strengths, or evolutionary states needed to support generalization of the quantitative contrast values and the statement that 'this behavior is not captured by synthetic CLVs'.
Authors: We agree that the sample of four simple round α-sunspots plus one evolving region does not span the full diversity of active-region properties, and the manuscript provides no explicit justification for broad generalization. The study was designed as an initial measurement using well-characterized, isolated regions to enable clean stray-light correction and CLV extraction. We have revised the abstract and added a paragraph in the discussion section to state that the reported contrast values and the model discrepancy apply to the observed sample, and that extension to a wider range of AR sizes, complexities, and evolutionary states requires a larger statistical sample. The core observational result—that the measured CLV deviates from PHOENIX and ATLAS predictions in these regions—remains unchanged. revision: yes
-
Referee: [Abstract] Abstract: The additional claim that 'strongly evolving active regions do not appear to display significantly altered CLV profiles compared to stable active regions' is based on a single evolving region (n=1). Without reported uncertainties, statistical tests, or error analysis, this conclusion lacks a clear basis for assessing significance.
Authors: We acknowledge that the statement rests on a single evolving region and that no formal uncertainty or statistical comparison was provided. We have revised the abstract to read that, in the one strongly evolving region examined, the CLV profiles appear similar to those of the stable regions within the measurement precision. We have also added error bars derived from the standard deviation across the four stable regions and a brief methods note on how the comparison was performed. A statistically robust test of evolutionary effects will require additional evolving regions and is noted as future work. revision: yes
Circularity Check
No circularity; direct observational measurements
full rationale
The paper reports direct measurements of center-to-limb intensity variations in the 6173 Å continuum from HMI observations of four α-sunspots plus one evolving region, after stray-light correction. No derivations, fitted parameters, or model equations are presented whose outputs reduce by construction to the inputs; the quantitative CLV contrasts (e.g., facular/network excess peaking near μ≈0.3) are extracted from the data. Model comparisons to PHOENIX/ATLAS are external and falsifiable. No self-citation chains or ansatzes underpin the central claims, so the analysis is self-contained.
Assumptions & free parameters
assumptions (2)
- domain assumption The quiet Sun provides a uniform reference intensity for contrast calculations.
- domain assumption Stray light correction accurately removes instrumental effects without biasing CLV profiles.
Cite this review
Pith. "Pith review of Center-to-limb variations of solar active regions: Observations of spots, faculae, and network in the 6173 \AA\ continuum." pith.science (2026). https://pith.science/paper/4QF2CJYV
@misc{pith2026260628887,
  author       = {Pith},
  title        = {Pith review of: Center-to-limb variations of solar active regions: Observations of spots, faculae, and network in the 6173 \AA\ continuum},
  year         = {2026},
  howpublished = {\url{https://pith.science/paper/4QF2CJYV}},
  note         = {Machine review of arXiv:2606.28887}
}
abstract
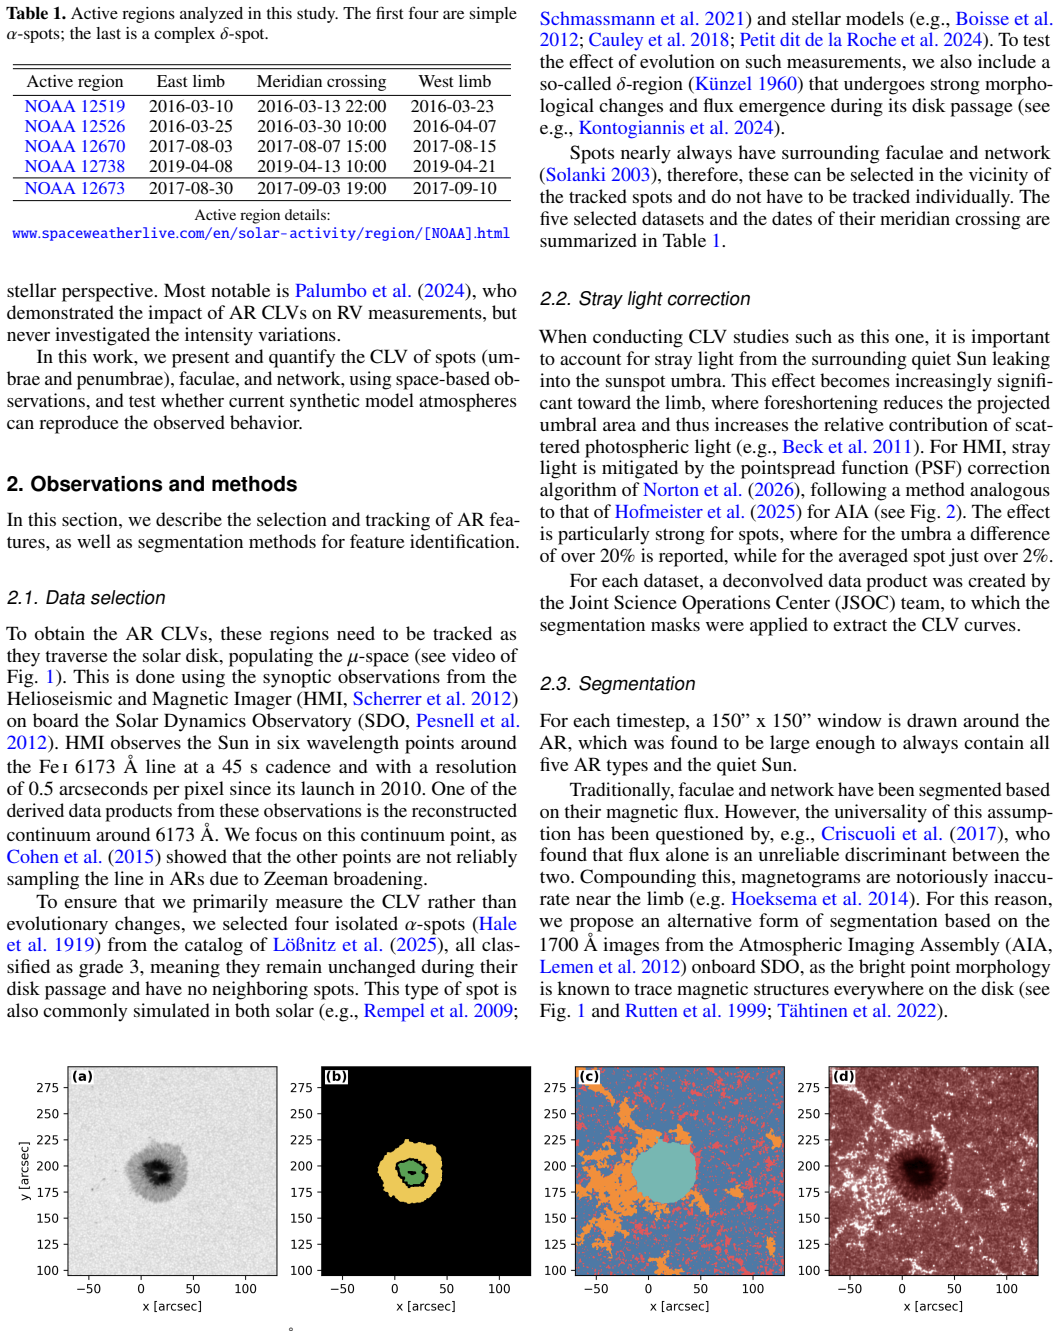
Accurate modeling of stellar active regions (ARs) remains a major bottleneck for radial-velocity and transmission-spectroscopy studies aimed at finding Earth-like planets. While much effort has been devoted to AR modeling, their center-to-limb variations (CLV) have been largely overlooked. We take a step toward remedying this by measuring the CLV of the 6173 {\AA} continuum intensity for sunspots (the whole spot, and separate umbrae and penumbrae), faculae, network, and the quiet Sun using the Helioseismic and Magnetic Imager (HMI) onboard the Solar Dynamics Observatory (SDO). This study is based on four simple round $\alpha$-sunspots and their surroundings, as well as one strongly evolving region. After correcting for stray light, we find that relative to the quiet Sun, all components except for the umbra display reduced darkening towards the limb. Additionally, strongly evolving active regions do not appear to display significantly altered CLV profiles compared to stable active regions. Faculae and network show contrast enhancements that peak near $\mu \approx 0.3$ before declining toward the limb, reaching maxima of approximately 4% and 2% respectively in contrast excess relative to the quiet Sun, while the spot-to-quiet-Sun contrast rises to approximately 15% near the limb. For both types of AR, this change in CLV behavior near the limb is likely related to the three-dimensional structure of the active regions and the rapidly changing viewing geometry. This behavior is not captured by synthetic CLVs based on PHOENIX and ATLAS model atmospheres with solar values and a different effective temperature, underscoring the need for more realistic treatments of stellar activity.
Figures


Figures from the paper (3 more)


Reference graph
Works this paper leans on
- [1]
- [2]
-
[3]
Albert, K., Krivova, N. A., Hirzberger, J., et al. 2023, A&A, 678, A163
work page 2023
- [4]
- [5]
- [6]
-
[7]
Boisse, I., Bonfils, X., & Santos, N. C. 2012, A&A, 545, A109
work page 2012
-
[8]
W., Kuckein, C., Redfield, S., et al
Cauley, P. W., Kuckein, C., Redfield, S., et al. 2018, AJ, 156, 189
work page 2018
Show all 46 references
-
[9]
2024, A&A, 685, A173
Deline, A. 2024, A&A, 685, A173
2024
-
[10]
P., Criscuoli, S., Farris, L., & Tritschler, A
Cohen, D. P., Criscuoli, S., Farris, L., & Tritschler, A. 2015, Sol. Phys., 290, 689
2015
-
[11]
Cretignier, M., Pietrow, A. G. M., & Aigrain, S. 2024, MNRAS, 527, 2940
2024
-
[12]
2017, ApJ, 847, 93
Criscuoli, S., Norton, A., & Whitney, T. 2017, ApJ, 847, 93
2017
-
[13]
& Jordán, A
Espinoza, N. & Jordán, A. 2015, MNRAS, 450, 1879
2015
-
[14]
D., Wyller, A
Fay, T. D., Wyller, A. A., & Yun, H. S. 1972, Sol. Phys., 23, 58
1972
-
[15]
1991, ApJ, 383, L89 Gunár, S., Koza, J., Schwartz, P., Heinzel, P., & Liu, W
Foukal, P., Harvey, K., & Hill, F. 1991, ApJ, 383, L89 Gunár, S., Koza, J., Schwartz, P., Heinzel, P., & Liu, W. 2021, ApJS, 255, 16
1991
-
[16]
E., Ellerman, F., Nicholson, S
Hale, G. E., Ellerman, F., Nicholson, S. B., & Joy, A. H. 1919, ApJ, 49, 153
1919
-
[17]
T., Liu, Y ., Hayashi, K., et al
Hoeksema, J. T., Liu, Y ., Hayashi, K., et al. 2014, Sol. Phys., 289, 3483
2014
-
[18]
J., Savin, D
Hofmeister, S. J., Savin, D. W., & Hahn, M. 2025, ApJS, 278, 8
2025
-
[19]
2013, A&A, 553, A6
Husser, T.-O., Wende-von Berg, S., Dreizler, S., et al. 2013, A&A, 553, A6
2013
-
[20]
& Young, P
Kayshap, P. & Young, P. R. 2024, ApJ, 977, 141
2024
-
[21]
Kontogiannis, I., Pietrow, A. G. M., Druett, M. K., et al. 2024, A&A, 691, A119
2024
-
[22]
2026, A&A, 708, A51
Korda, D., Jurˇcák, J., Bello González, N., & Schmassmann, M. 2026, A&A, 708, A51
2026
-
[23]
Kotov, V . A. & Koutchmy, S. 1994, in IAU Symposium, V ol. 154, Infrared Solar Physics, ed. D. M. Rabin, J. T. Jefferies, & C. Lindsey, 265 Künzel, H. 1960, Astron. Nachr., 285, 271
1994
-
[24]
R., Title, A
Lemen, J. R., Title, A. M., Akin, D. J., et al. 2012, Sol. Phys., 275, 17 Lößnitz, E. J., Pietrow, A. G. M., Chakraborty, H., et al. 2025, A&A, 703, A187
2012
-
[25]
& Morimoto, M
Makita, M. & Morimoto, M. 1960, PASJ, 12, 63
1960
-
[26]
1969, Sol
Mattig, W. 1969, Sol. Phys., 6, 413
1969
-
[27]
1953, Annales d’Astrophysique, 16, 217
Michard, R. 1953, Annales d’Astrophysique, 16, 217
1953
-
[28]
Morosin, R., de la Cruz Rodríguez, J., Vissers, G. J. M., & Yadav, R. 2020, A&A, 642, A210
2020
-
[29]
& Labs, D
Neckel, H. & Labs, D. 1994, Sol. Phys., 153, 91
1994
-
[30]
A., Duvall, Jr., T
Norton, A. A., Duvall, Jr., T. L., Schou, J., et al. 2026, ApJS, 282, 36
2026
-
[31]
K., Domingo, V ., Fligge, M., & Sanahuja, B
Ortiz, A., Solanki, S. K., Domingo, V ., Fligge, M., & Sanahuja, B. 2002, A&A, 388, 1036
2002
-
[32]
2025, Experimental Astronomy, 59, 29
Palle, E., Biazzo, K., Bolmont, E., et al. 2025, Experimental Astronomy, 59, 29
2025
-
[33]
L., Saar, S
Palumbo, M. L., Saar, S. H., & Haywood, R. D. 2024, ApJ, 973, 11
2024
-
[34]
D., Thompson, B
Pesnell, W. D., Thompson, B. J., & Chamberlin, P. C. 2012, Sol. Phys., 275, 3 Petit dit de la Roche, D. J. M., Chakraborty, H., Lendl, M., et al. 2024, A&A, 692, A83
2012
-
[35]
Pietrow, A. G. M., Kiselman, D., Andriienko, O., et al. 2023, A&A, 671, A130
2023
-
[36]
Pietrow, A. G. M., Kiselman, D., de la Cruz Rodríguez, J., et al. 2020, A&A, 644, A43
2020
-
[37]
Pietrow, A. G. M., Kuckein, C., Verma, M., et al. 2026, A&A, 705, A116
2026
-
[38]
2009, ApJ, 691, 640 Rödberg, H
Rempel, M., Schüssler, M., & Knölker, M. 2009, ApJ, 691, 640 Rödberg, H. 1966, Nature, 211, 394
2009
-
[39]
J., de Pontieu, B., & Lites, B
Rutten, R. J., de Pontieu, B., & Lites, B. 1999, in Astronomical Society of the Pacific Conference Series, V ol. 183, High Resolution Solar Physics: Theory, Observations, and Techniques, ed. T. R. Rimmele, K. S. Balasubramaniam, & R. R. Radick, 383
1999
-
[40]
H., Schou, J., Bush, R
Scherrer, P. H., Schou, J., Bush, R. I., et al. 2012, Sol. Phys., 275, 207
2012
-
[41]
2021, A&A, 656, A92 Simões, P
Schmassmann, M., Rempel, M., Bello González, N., Schlichenmaier, R., & Jurˇcák, J. 2021, A&A, 656, A92 Simões, P. J. A., Reid, H. A. S., Milligan, R. O., & Fletcher, L. 2019, ApJ, 870, 114
2021
-
[42]
Solanki, S. K. 2003, A&A Rev., 11, 153
2003
-
[43]
Spruit, H. C. 1976, Sol. Phys., 50, 269 Tähtinen, I., Virtanen, I. I., Pevtsov, A. A., & Mursula, K. 2022, A&A, 664, A2 Vicente Arévalo, A., Borrero, J. M., Mili´c, I., et al. 2026, A&A, 708, A351
1976
-
[44]
1939, Astronomische Mitteilungen der Eidgenössischen Stern- warte Zurich, 14, 470
Waldmeier, M. 1939, Astronomische Mitteilungen der Eidgenössischen Stern- warte Zurich, 14, 470
1939
-
[45]
L., Solanki, S
Yeo, K. L., Solanki, S. K., & Krivova, N. A. 2013, A&A, 550, A95
2013
-
[46]
& Dumusque, X
Zhao, Y . & Dumusque, X. 2023, A&A, 671, A11 Article number, page 6 of 6
2023
Reviewed June 30, 2026 · model on record in the stance chip above.
Discussion (0). Continue with ORCID to comment.