Iron Fluorescence in X-class Solar Flares: Aditya-L1/SoLEXS Observations
Pith reviewed 2026-05-22 03:33 UTC · model grok-4.3
The pith
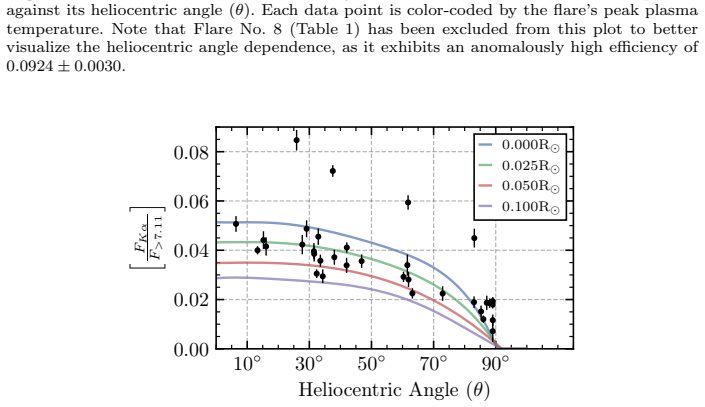
Observations from 47 X-class solar flares show iron fluorescence efficiency varying with position on the solar disk in a way that can help constrain coronal source heights.
A machine-rendered reading of the paper's core claim, the machinery that carries it, and where it could break.
Core claim
The paper establishes a well-determined relationship between Fe Kα flux and the exciting flux above 7.11 keV for 47 X-class flares. The derived fluorescence efficiencies exhibit a center-to-limb dependence consistent with theoretical models, offering a potential diagnostic to probe coronal source heights and viewing geometries. The mean fluorescence efficiency during the flare peak provides a potential constraint on the effective coronal source height, although this derivation remains subject to a fundamental degeneracy because the estimated source height cannot be uniquely determined without assuming a specific value for the photospheric iron abundance. These findings demonstrate that SDDs,
What carries the argument
fluorescence efficiency, defined as the ratio of observed Fe Kα line flux to the incident X-ray flux above the iron K-edge at 7.11 keV, together with its variation as a function of heliocentric angle
If this is right
- The center-to-limb dependence of fluorescence efficiency can serve as a diagnostic for coronal source heights and viewing geometries.
- The mean efficiency value during the flare peak supplies a constraint on the effective height of the coronal X-ray source.
- Silicon drift detectors can function as a diagnostic tool for iron fluorescence even though they have lower spectral resolution than crystal spectrometers.
- Statistical uncertainties currently restrict the ability to follow rapid changes in source height on short timescales.
Where Pith is reading between the lines
- Independent measurements of photospheric iron abundance from other methods could remove the degeneracy and allow absolute source-height determinations.
- Applying the same analysis to a larger sample that includes weaker flares would test whether the diagnostic works across a wider range of event sizes.
- Pairing fluorescence data with simultaneous imaging or spectroscopy at other wavelengths could help separate height effects from abundance effects.
- If the center-to-limb pattern holds, future missions equipped with similar detectors could use it for routine estimates of flare geometry.
Load-bearing premise
The estimated coronal source height cannot be uniquely determined without assuming a specific value for the photospheric iron abundance.
What would settle it
A set of flares observed at a range of positions from disk center to limb that produce fluorescence efficiencies showing no systematic center-to-limb trend matching any combination of source height and iron abundance.
Figures



read the original abstract
Iron fluorescence is produced by the irradiation of the solar photosphere by coronal X-rays during flares. This study presents the first comprehensive analysis of iron K$\alpha$ fluorescence characteristics in 47 X-class flares observed during the inaugural year of the Solar Low Energy X-ray Spectrometer (SoLEXS) on board India's Aditya-L1 mission. Leveraging the capability of modern silicon drift detectors (SDDs) for simultaneous broadband continuum and line measurements, the Fe K$\alpha$ flux and the exciting flux ($F_{>7.11 \text{ keV}}$) are quantified for each event, establishing a well-determined relationship between them across the sample. The derived fluorescence efficiencies exhibit a center-to-limb dependence consistent with theoretical models, offering a potential diagnostic to probe coronal source heights and viewing geometries. While statistical uncertainties currently limit the ability to track rapid height variations on short timescales, the mean fluorescence efficiency during the flare peak provides a potential constraint on the effective coronal source height. However, this derivation remains subject to a fundamental degeneracy, as the estimated source height cannot be uniquely determined without assuming a specific value for the photospheric iron abundance. These findings demonstrate that SDDs, despite having lower spectral resolution than traditional crystal spectrometers, provide a new diagnostic for the solar iron fluorescence observations.
Editorial analysis
A structured set of objections, weighed in public.
Referee Report
Summary. The manuscript presents the first comprehensive analysis of iron Kα fluorescence in 47 X-class solar flares observed by the SoLEXS instrument on Aditya-L1. It quantifies the Fe Kα flux and the exciting flux above 7.11 keV for each event, establishes their relationship, derives fluorescence efficiencies that show a center-to-limb dependence consistent with theoretical models, and discusses the mean efficiency during flare peak as a potential constraint on effective coronal source height, while explicitly noting the degeneracy with assumed photospheric iron abundance. The work highlights the utility of silicon drift detectors for such observations despite lower spectral resolution than crystal spectrometers.
Significance. If the reported center-to-limb trend and flux relationship hold after detailed verification of methods, this provides a new diagnostic capability for probing coronal source heights and viewing geometries in solar flares using modern SDD instrumentation. The explicit flagging of the iron abundance degeneracy and the use of a large sample of X-class events strengthen the analysis; the work could be significant for solar flare physics if the efficiencies can be used to test models of photospheric irradiation.
major comments (2)
- The central relationship between Fe Kα flux and F>7.11 keV is presented as well-determined, but without access to the specific data-selection criteria, background subtraction procedure, or error budget in the methods section, it is difficult to assess whether post-hoc choices influence the reported trend or the center-to-limb variation. A dedicated subsection detailing these steps, including any cuts on flare phase or signal-to-noise, would be required to support the claim.
- While the degeneracy with photospheric iron abundance is correctly flagged in the abstract for the source-height inference, the manuscript should include a quantitative sensitivity analysis (e.g., showing how assumed abundance values shift the derived height range) in the discussion to make the potential constraint on coronal source height more robust and falsifiable.
minor comments (2)
- Figure captions should explicitly state the number of flares contributing to each bin in the center-to-limb plot and whether error bars include both statistical and systematic uncertainties.
- The abstract states that SDDs provide a 'new diagnostic'; a brief comparison in the introduction to prior crystal-spectrometer results (e.g., from earlier missions) would clarify the incremental advance.
Simulated Author's Rebuttal
We thank the referee for their constructive comments and positive assessment of our manuscript. We address each major comment below and will revise the manuscript to incorporate the suggested improvements for greater clarity and robustness.
read point-by-point responses
-
Referee: The central relationship between Fe Kα flux and F>7.11 keV is presented as well-determined, but without access to the specific data-selection criteria, background subtraction procedure, or error budget in the methods section, it is difficult to assess whether post-hoc choices influence the reported trend or the center-to-limb variation. A dedicated subsection detailing these steps, including any cuts on flare phase or signal-to-noise, would be required to support the claim.
Authors: We agree that additional methodological details are necessary to allow full assessment of the analysis. In the revised manuscript we will insert a new dedicated subsection in the Methods section that explicitly describes the data-selection criteria, background subtraction procedure, full error budget, and any applied cuts on flare phase or signal-to-noise ratio. revision: yes
-
Referee: While the degeneracy with photospheric iron abundance is correctly flagged in the abstract for the source-height inference, the manuscript should include a quantitative sensitivity analysis (e.g., showing how assumed abundance values shift the derived height range) in the discussion to make the potential constraint on coronal source height more robust and falsifiable.
Authors: We appreciate this suggestion. To strengthen the discussion of the source-height diagnostic, we will add a quantitative sensitivity analysis in the Discussion section that illustrates how the inferred coronal source height range changes under different assumed photospheric iron abundance values, using the observed mean fluorescence efficiency during flare peak. revision: yes
Circularity Check
No significant circularity detected
full rationale
The paper performs direct observational analysis of SoLEXS SDD spectra for 47 X-class flares, measuring Fe Kα line flux and the exciting continuum flux above 7.11 keV on a per-event basis. Fluorescence efficiency is computed as the ratio of these two independently extracted quantities, and the resulting efficiencies are then plotted against heliocentric angle to reveal an observed center-to-limb trend that is compared with existing theoretical models. No parameter is fitted to a subset of the data and then re-labeled as a prediction; no self-citation supplies a uniqueness theorem or ansatz that the present work relies upon; and the degeneracy between source height and photospheric iron abundance is explicitly stated rather than concealed inside a fitted value. The derivation chain therefore consists of measurement, ratio formation, and empirical comparison, all of which remain independent of the reported results.
Axiom & Free-Parameter Ledger
free parameters (1)
- photospheric iron abundance
axioms (1)
- domain assumption Theoretical fluorescence efficiency versus heliocentric angle follows standard models without significant deviations from non-uniform photospheric iron or scattering effects.
Lean theorems connected to this paper
-
IndisputableMonolith/Cost/FunctionalEquation.leanwashburn_uniqueness_aczel unclear?
unclearRelation between the paper passage and the cited Recognition theorem.
The observed fluorescence efficiency (Γ′=FKα/F>7.11) … plotted against heliocentric angle … overlaid with theoretical predictions for a 20 MK plasma … using … Drake, Ercolano, and Swartz (2008)
What do these tags mean?
- matches
- The paper's claim is directly supported by a theorem in the formal canon.
- supports
- The theorem supports part of the paper's argument, but the paper may add assumptions or extra steps.
- extends
- The paper goes beyond the formal theorem; the theorem is a base layer rather than the whole result.
- uses
- The paper appears to rely on the theorem as machinery.
- contradicts
- The paper's claim conflicts with a theorem or certificate in the canon.
- unclear
- Pith found a possible connection, but the passage is too broad, indirect, or ambiguous to say the theorem truly supports the claim.
Reference graph
Works this paper leans on
-
[1]
Acton, L.W.: 1965, Contribution of Characteristic X-rays to the Radiation of Solar Flares. Nature207,
work page 1965
-
[2]
DOI.URL. Acton, L.W., Culhane, J.L., Gabriel, A.H., Bentley, R.D., Bowles, J.A., Firth, J.G., Finch, M.L., Gilbreth, C.W., Guttridge, P., Hayes, R.W., Joki, E.G., Jones, B.B., Kent, B.J., Leibacher, J.W., Nobles, R.A., Patrick, T.J., Phillips, K.J.H., Rapley, C.G., Sheather, P.H., Sherman, J.C., Stark, J.P., Springer, L.A., Turner, R.F., Wolfson, C.J.: 19...
work page 1980
-
[3]
DOI. ADS. Allred, J.C., Kowalski, A.F., Carlsson, M.: 2015, A UNIFIED COMPUTATIONAL MODEL FOR SOLAR AND STELLAR FLARES.The Astrophysical Journal809,
work page 2015
-
[4]
Arnaud, K., Gordon, C., Dorman, B., Rutkowski, K.: 2025,XSPEC: Users’ Guide for version 12.15.0
DOI.URL. Arnaud, K., Gordon, C., Dorman, B., Rutkowski, K.: 2025,XSPEC: Users’ Guide for version 12.15.0. HEASARC, Astrophysics Science Division, NASA/GSFC, Greenbelt, MD, USA. HEASARC, Astrophysics Science Division, NASA/GSFC. Available at: https://heasarc.gsfc. nasa.gov/xanadu/xspec/XspecManual.pdf. Asplund, M., Grevesse, N., Sauval, A.J., Scott, P.: 20...
work page 2025
-
[5]
DOI. ADS. SOLA: iron_fluorescence_solexs.tex; 22 May 2026; 1:16; p. 26 Iron Fluorescence in X-class Solar Flares Bai, T.: 1979, Iron Kalpha-fluorescence in solar flares: A probe of the photospheric iron abundance.Solar Physics62,
work page 2026
-
[6]
DOI. ADS. Bambynek, W., CRASEMANN, B., FINK, R.W., FREUND, H.-U., MARK, H., SWIFT, C.D., PRICE, R.E., RAO, P.V.: 1972, X-Ray Fluorescence Yields, Auger, and Coster-Kronig Transition Probabilities.Reviews of Modern Physics44, 716–813. DOI.URL. Basko, M.M.: 1978, K-fluorescence lines in spectra of X-ray binaries.Astrophysical Journal 223,
work page 1972
-
[7]
DOI. ADS. Basko, M.M.: 1979, Iron K α fluorescence due to solar flares.Astronomicheskii Zhurnal56,
work page 1979
-
[8]
Benz: 2017, Flare Observations.Living Reviews in Solar Physics14,
ADS. Benz: 2017, Flare Observations.Living Reviews in Solar Physics14,
work page 2017
-
[9]
DOI.URL. Bevington, P.R., Robinson, D.K.: 2003,Data Reduction and Error Analysis for the Physical Sciences, 3rd edn. McGraw-Hill. ISBN 0-07-247227-8. Brown, J.C.: 1971, The deduction of energy spectra of non-thermal electrons in flares from the observed dynamic spectra of hard X-ray bursts.Solar Physics18,
work page 2003
-
[10]
DOI.URL. Burke, D., Laurino, O., wmclaugh, G¨ unther, H.M., Marie-Terrell, dtnguyen2, Siemiginowska, A., Cheer, H., Budynkiewicz, J., Aldcroft, T., Deil, C., Sip˝ ocz, B., Buchner, J., nplee, Donath, A., Laginja, I., Leinweber, K., Todd: 2023, sherpa/sherpa: Sherpa 4.16.0, Zenodo. Creative Commons Attribution 4.0 International. DOI.URL. Caspi, A., Lin, R....
work page 2023
-
[11]
DOI.URL. Culhane, J.L.: 1969, Thermal Continuum Radiation from Coronal Plasmas at Soft X-ray Wavelengths.Monthly Notices of the Royal Astronomical Society144,
work page 1969
-
[12]
DOI.URL. Culhane, J.L., Hiei, E., Doschek, G.A., Cruise, A.M., Ogawara, Y., Uchida, Y., Bentley, R.D., Brown, C.M., Lang, J., Watanabe, T., Bowles, J.A., Deslattes, R.D., Feldman, U., Fludra, A., Guttridge, P., Henins, A., Lapington, J., Magraw, J., Mariska, J.T., Payne, J., Phillips, K.J.H., Sheather, P., Slater, K., Tanaka, K., Towndrow, E., Trow, M.W.,...
work page 1991
-
[13]
DOI. ADS. Del Zanna, G., Mason, H.E.: 2018, Solar UV and X-ray Spectral Diagnostics.Living Reviews in Solar Physics15,
work page 2018
-
[14]
DOI.URL. Doe, S., Nguyen, D., Stawarz, C., Refsdal, B., Siemiginowska, A., Burke, D., Evans, I., Evans, J., McDowell, J., Houck, J., Nowak, M.: 2007, Developing Sherpa with Python. In: Shaw, R.A., Hill, F., Bell, D.J. (eds.)Astronomical Data Analysis Software and Systems XVI, Astronomical Society of the Pacific Conference Series376,
work page 2007
-
[15]
ADS. Doschek, G.A., Warren, H.P., Harra, L.K., Culhane, J.L., Watanabe, T., Hara, H.: 2018, Photospheric and Coronal Abundances in an X8.3 Class Limb Flare.The Astrophysical Journal853,
work page 2018
-
[16]
DOI.URL. Drake, J.J., Ercolano, B., Swartz, D.A.: 2008, X-Ray-fluorescent Fe Kalpha Lines from Stellar Photospheres.Astrophysical Journal678,
work page 2008
-
[17]
DOI. ADS. Dufresne, R.P., Del Zanna, G., Young, P.R., Dere, K.P., Deliporanidou, E., Barnes, W.T., Landi, E.: 2024, CHIANTI—An Atomic Database for Emission Lines—Paper. XVIII. Version 11, Advanced Ionization Equilibrium Models: Density and Charge Transfer Effects.The Astrophysical Journal974,
work page 2024
-
[18]
DOI.URL. Emslie, A.G.: 1978, The collisional interaction of a beam of charged particles with a hydrogen target of arbitrary ionization level.The Astrophysical Journal224,
work page 1978
-
[19]
Gu, M.F.: 2003, Indirect X-Ray Line-Formation Processes in Iron L-Shell Ions.Astrophys
DOI.URL. Gu, M.F.: 2003, Indirect X-Ray Line-Formation Processes in Iron L-Shell Ions.Astrophys. J. 582,
work page 2003
-
[20]
DOI. ADS. Hudson, H.S., Wolfson, C.J., Metcalf, T.R.: 2006, White-Light Flares: A TRACE/RHESSI Overview.Solar Physics234,
work page 2006
-
[21]
DOI.URL. Kane, S.R., McTiernan, J., Loran, J., Fenimore, E.E., Klebesadel, R.W., Laros, J.G.: 1992, Stereoscopic observations of a solar flare hard X-ray source in the high corona.The Astrophysical Journal390,
work page 1992
-
[22]
DOI.URL. Kowalski, A.F., Allred, J.C., Daw, A., Cauzzi, G., Carlsson, M.: 2017, The Atmospheric Response to High Nonthermal Electron Beam Fluxes in Solar Flares. I. Modeling the Brightest NUV Footpoints in the X1 Solar Flare of 2014 March 29.The Astrophysical Journal836,
work page 2017
-
[23]
DOI. URL. Krucker, S., Battaglia, M., Cargill, P.J., Fletcher, L., Hudson, H.S., MacKinnon, A.L., Masuda, S., Sui, L., Tomczak, M., Veronig, A.L., Vlahos, L., White, S.M.: 2008, Hard X-ray emission from the solar corona.The Astronomy and Astrophysics Review16,
work page 2008
-
[24]
SOLA: iron_fluorescence_solexs.tex; 22 May 2026; 1:16; p
DOI.URL. SOLA: iron_fluorescence_solexs.tex; 22 May 2026; 1:16; p. 27 Sarwade et al. Krucker, S., Hurford, G.J., Grimm, O., Kogl, S., et al.: 2020, The Spectrometer/Telescope for Imaging X-rays (STIX).Astronomy and Astrophysics642, A15. DOI. ADS. Laming, J.M.: 2021, The FIP and Inverse-FIP Effects in Solar Flares.The Astrophysical Journal 909,
work page 2026
-
[25]
DOI.URL. Li, Y., Liu, X., Jing, Z., Chen, W., Li, Q., Su, Y., Song, D.-C., Ding, M.D., Feng, L., Li, H., Gan, W.: 2024, Various Features of the X-class White-light Flares in Super Active Region NOAA 13664.The Astrophysical Journal Letters972, L1. DOI.URL. Mart´ ınez Oliveros, J.-C., Hudson, H.S., Hurford, G.J., Krucker, S., Lin, R.P., Lindsey, C., Couvida...
work page 2024
-
[26]
DOI.URL. Moore, C.S., Caspi, A., Woods, T.N., Chamberlin, P.C., Dennis, B.R., Jones, A.R., Mason, J.P., Schwartz, R.A., Tolbert, A.K.: 2018, The Instruments and Capabilities of the Miniature X-Ray Solar Spectrometer (MinXSS) CubeSats.Solar Physics293. DOI.URL. Neupert, W.M., Gates, W., Swartz, M., Young, R.: 1967, Observation of the Solar Flare X-Ray Emis...
work page 2018
-
[27]
10.3847/1538-4357/ad9b0a. DOI.URL. Niculae, A., Lechner, P., Soltau, H., Lutz, G., Str¨ uder, L., Fiorini, C., Longoni, A.: 2006, Optimized readout methods of silicon drift detectors for high-resolution X-ray spec- troscopy.Nuclear Instruments and Methods in Physics Research Section A: Accelerators, Spectrometers, Detectors and Associated Equipment568,
-
[28]
DOI.URL. Parmar, A.N., Culhane, J.L., Rapley, C.G., Wolfson, C.J., Acton, L.W., Phillips, K.J.H., Dennis, B.R.: 1984, SMM observations of K-alpha radiation from fluorescence of photospheric iron by solar flare X-rays.Astrophysical Journal279,
work page 1984
-
[29]
DOI. ADS. Phillips, K.J.H.: 2004, The Solar Flare 3.8-10 keV X-Ray Spectrum.The Astrophysical Journal 605,
work page 2004
-
[30]
Phillips, K.J.H., Neupert, W.M.: 1973, K? line emission during solar X-ray bursts.Solar Physics 32,
DOI.URL. Phillips, K.J.H., Neupert, W.M.: 1973, K? line emission during solar X-ray bursts.Solar Physics 32,
work page 1973
-
[31]
DOI.URL. Phillips, K.J.H., Feldman, U., Landi, E.: 2008,Ultraviolet and X-ray Spectroscopy of the Solar Atmosphere, Cambridge University Press. ISBN 9780511585968. DOI.URL. Phillips, K.J.H., Pike, C.D., Lang, J., Watanbe, T., Takahashi, M.: 1994, Iron K beta Line Emis- sion in Solar Flares Observed by YOHKOH and the Solar Abundance of Iron.Astrophysical J...
work page 2008
-
[32]
DOI. ADS. Phillips, K.J.H., Rainnie, J.A., Harra, L.K., Dubau, J., Keenan, F.P., Peacock, N.J.: 2004, Improved data for solar flare X-ray spectral analysis.Astronomy and Astrophysics416,
work page 2004
-
[33]
DOI.URL. Sankarasubramanian, K., Bug, M., Sarwade, A., Sharan, V., Kumar, Kushwaha, A., Verma, S., Ramadevi, M.C., Lakshmipathaiah, K., Thakur, M.K., Gupta, K., Sharma, N., Justin, E.L., Narendra, S., Adoni, A., Srikanth, M., Subramanian, V., Sahu, S.N., Pai, V.K., Mustafa, S.F., Parate, N., Shamrao, Dey, A., T, S., Upadhyay, P., T, R., Malhotra, G., Saty...
-
[34]
DOI.URL. Shibata, K., Magara, T.: 2011, Solar Flares: Magnetohydrodynamic Processes.Living Reviews in Solar Physics8. DOI.URL. Tolbert, K., Schwartz, R.: 2020, OSPEX: Object Spectral Executive, Astrophysics Source Code Library, record ascl:2007.018. ADS. Warmuth, A., Mann, G.: 2016, Constraints on energy release in solar flares from RHESSI and GOES X-ray ...
work page 2011
-
[35]
10.3847/1538-4357/acef13. DOI.URL. Zarro, D.M., Dennis, B.R., Slater, G.L.: 1992, Impulsive phase Fe K-alpha emission in a flare of 1989 March.The Astrophysical Journal391,
-
[36]
SOLA: iron_fluorescence_solexs.tex; 22 May 2026; 1:16; p
DOI.URL. SOLA: iron_fluorescence_solexs.tex; 22 May 2026; 1:16; p. 29 Sarwade et al. T able 1.Parameters of X-class flares observed by SoLEXS. The table lists the date, peak time, GOES class, heliographic location, heliocentric angle ( θ), peak plasma temperature ( Tpeak), EMpeak, and the observed fluorescence efficiency (Γ ′ =F Kα /F>7.11) for each event...
work page 2026
discussion (0)
Sign in with ORCID, Apple, or X to comment. Anyone can read and Pith papers without signing in.