REVIEW 4 major objections 4 minor 31 references
The uncertainty estimation of feature-based forecast combinations
T0 review · 4 major / 4 minor · reviewed 2026-08-14 · deepseek-v4-flash
Pith's one-line read Using time-series features to choose and weight forecast models produces more reliable prediction intervals than any individual method or simple averaging.
desk verdict A solid, honest extension of FFORMA-style feature-based combination to prediction intervals, with a clean GRATIS-to-M4 split and a load-bearing but explicitly acknowledged transferability assumption. read the letter →
The pith
A machine-rendered reading of the paper's core claim, the machinery that carries it, and where it could break.
The reading
What carries the argument
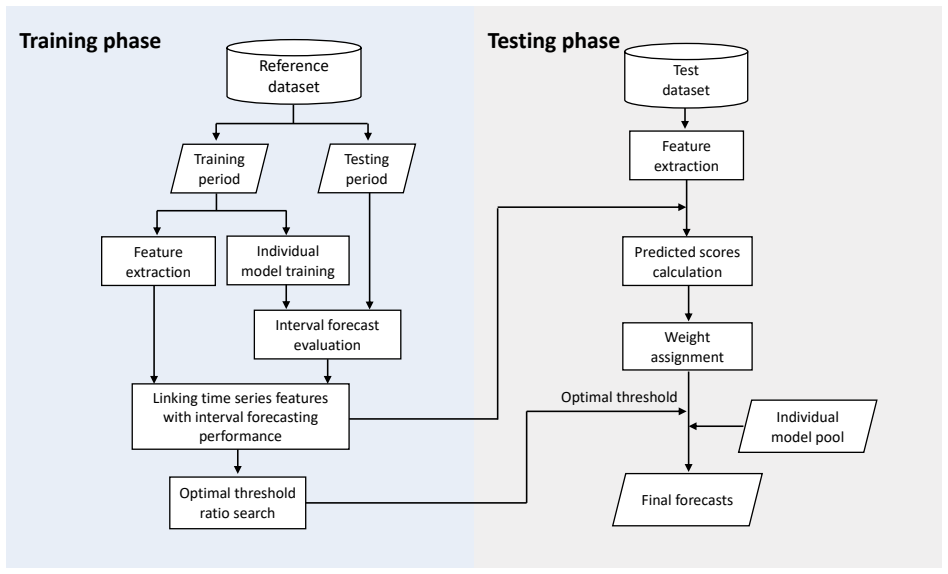
The load-bearing object is a two-stage weighting mechanism. First, a generalized additive model (GAM) is fitted for each method in the pool, with $\log(\text{MSIS})$ as the response and 43 time-series features as covariates, so each method's interval performance is predicted purely from features. Second, an adjusted softmax, effectively a softargmin, maps the fitted $\log(\text{MSIS})$ values into a convex weight vector for each series. A one-dimensional threshold search then keeps only methods whose weight ratio $P_k/\max_j P_j$ is at least $T_r$, and the prediction interval bounds are combined with those weights; the point forecast is the midpoint of the combined interval. This machinery turns feature-score relationships into an interpretable, series-specific model-selection and weighting rule.
What would settle it
Take a hold-out sample from M4, compute each method's actual MSIS rank per series, and correlate it with the rank the trained GAMs predict from features; if the predicted ranks are no better than chance, the weights are miscalibrated and the reported gains would not replicate. Alternatively, train the whole pipeline on GRATIS data deliberately restricted to a narrow feature region, apply it to full M4, and check whether the claimed superiority over simple averaging collapses.
Extended reading notes
Core claim
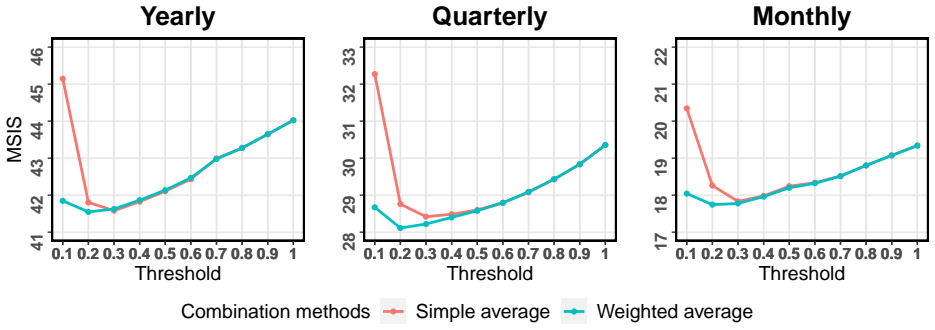
The central claim is that feature-driven weighting of prediction-interval forecasts generalizes and outperforms both individual methods and simple averaging. The paper reports that 'fuma (mean)', 'fuma (weighted)', and 'fuma (all weighted)' consistently outperform all individual methods and simple averaging in MSIS for each data frequency, with 'fuma (weighted)' ranking best on total MSIS across yearly, quarterly, and monthly M4 series. The weighted combination of the method subset selected by an optimal threshold (0.2 for weighted averaging, 0.3 for simple averaging) outperforms the weighted combination of all methods, and the resulting interval forecasts are competitive with the top M4 entries in MSIS and ACD. Point forecasts from the combined intervals, taken as the midpoints, are not sacrificed: fuma also improves MASE relative to the benchmarks.
Load-bearing premise
The whole transfer rests on the reference (GRATIS-generated) and test (M4) series being draws from the same population, so the feature-to-MSIS relationships learned in training remain valid on M4.
Editorial extensions
If this is right
- For a fresh batch of series, only the methods surviving the optimal threshold need to be fitted, so the framework cuts computation while improving interval accuracy.
- The gain applies to both interval and point forecasts: combined midpoints improve MASE, so the method supports operational decisions that need a single forecast plus its uncertainty.
- The optimal threshold is found once per frequency on the reference set, making the framework practical for large collections of series.
- Because the framework is scoring-rule based, the same pipeline could be applied to other interval scores, other confidence levels, or other method pools without redesign.
Reading between the lines
- Because the paper relies on GRATIS feature coverage without independently measuring it on M4, a direct check, such as an instance-space coverage measure, would show how much of the gain depends on that coverage.
- A testable extension is to train the same pipeline on a reference set built from a different generator, such as ARIMA or bootstrapping; the paper's assumption predicts that gains on M4 shrink as feature coverage degrades, and the size of that shrinkage would quantify how much of the result is feature matching rather than combination alone.
- The GAM partial-effect plots are themselves a diagnostic tool: a practitioner could use them to see which features make a method like auto-arima or ets reliable, which is information the paper does not exploit beyond weighting.
- One could tune the normalization in the adjusted softmax, the $\mu_i,\sigma_i$ standardization, as a free hyperparameter; the paper fixes it, and a small validation study would reveal whether its exact form matters.
Signed reviews
Editorial analysis
A structured set of objections, weighed in public.
Referee Report
Summary. This paper proposes a feature-based framework, referred to as 'fuma', for producing combined prediction intervals. The framework trains a GAM per candidate method on GRATIS-generated reference series, linking 43 time-series features to the log of the mean scaled interval score (MSIS); converts the predicted MSIS values into adjusted softmax weights; searches for an optimal threshold ratio on the reference set to select a subset of methods; and combines the selected methods' interval bounds, with point forecasts defined as the midpoints of the combined intervals. The method is evaluated on the yearly, quarterly, and monthly subsets of the M4 competition data against eight individual forecasting methods and an equally weighted combination, and it is also compared with the top M4 competition entries. The main claim is that the weighted thresholded variant consistently improves MSIS and MASE over all individual methods and simple averaging, with MCB tests indicating statistically significant rank improvements.
Significance. If the central claims are valid, the paper makes a useful contribution by extending feature-based meta-learning from point forecasts to interval forecasts, which is relevant to OR decisions such as inventory and safety-stock planning. The paper has several concrete strengths: the reference data (GRATIS) and test data (M4) are separated cleanly, the MCB test is applied to the main comparisons, the GAM effect analyses are interpretable, and an R package is provided for reproducibility. The central idea of using features to tailor interval forecast combinations is novel relative to the M4 practice of fixed equally weighted interval combinations. However, the significance is conditional on demonstrating that the GAMs trained on GRATIS series transfer to real M4 series; the current evidence is indirect because the paper relies on a citation for feature-space coverage rather than on a direct check of the conditional feature-MSIS relationship.
major comments (4)
- [Section 2.3] Section 2.3 states that the framework rests on the assumption that the reference dataset and the test dataset originate from the same population, but the only evidence offered for this is the citation of Kang et al. (2020) on feature-space coverage. The GAMs in Eq. (2) model the conditional expectation of log(MSIS) given features, and the softmax weights and threshold search are built on those conditional predictions. Marginal feature overlap does not imply that the conditional feature-MSIS relationship transfers from GRATIS to M4. This is load-bearing for the whole framework: if the conditional relationship is miscalibrated on M4, the gains in Table 3 and Figure 8 may be artifacts of the reference distribution. Please add a direct transferability check, for example by evaluating GAM-predicted log(MSIS) against actual MSIS values on a real-data holdout or a validation subset of M4 used for no other purpose, and discuss how any miscalibration would affect the chosen thresholds and weights.
- [Section 3.2 and Algorithm 1] The optimal threshold ratio is selected by evaluating the combined MSIS on the same reference series used to train the GAMs, and Algorithm 1 uses the fitted log(MSIS) values rather than out-of-sample predictions. This means the threshold ratio, which is a free parameter of the method, is tuned in-sample on the training reference data. As a result, the reported advantage of thresholded subset selection over 'simple averaging' may be optimistically biased when transferred to M4. Please select the threshold using a validation split or cross-validation within the reference set, and report the M4 performance under this honest selection procedure.
- [Section 4, Tables 3 and 4] No comparison against FFORMA or another feature-based forecast combination method is reported, despite FFORMA being discussed in the introduction as the most directly relevant M4 approach. Since FFORMA is a feature-based model-averaging method that performed strongly in M4, its absence leaves open the possibility that the observed improvements are attributable to feature-based weighting in general rather than to the specific interval-oriented mechanism proposed here. Please add FFORMA, or an equivalent feature-based model-averaging benchmark, to Table 3 and the MCB analysis, including its interval forecasts (for example, the equally weighted combination of naïve, theta, and seasonal naïve 95% bounds used in the M4 submission).
- [Section 3.3, Eq. (5)] Defining the point forecast as the midpoint of the combined prediction interval makes the point forecast depend on the nominal confidence level chosen by the user. This is visible in Table 3, where the MASE values for fuma differ between the 80% and 95% panels (for example, fuma (mean) yearly MASE is 3.031 at 80% and 3.049 at 95%). A point forecast should not vary with a user-selected interval coverage level. This undermines the claim that the framework provides a comprehensive and coherent outlook for both point forecasts and intervals. Please either define a separate point forecast combination rule that is independent of the interval level, or explicitly restrict the MASE claims to this midpoint construction and justify that choice.
minor comments (4)
- [Section 2.4 and Figure 4] The number of features is confusing: the text says 42 features are considered, then 43 after dummy encoding, while the caption of Figure 4 says the plots contain 40 features. Please reconcile these numbers and state which features are omitted from the figure.
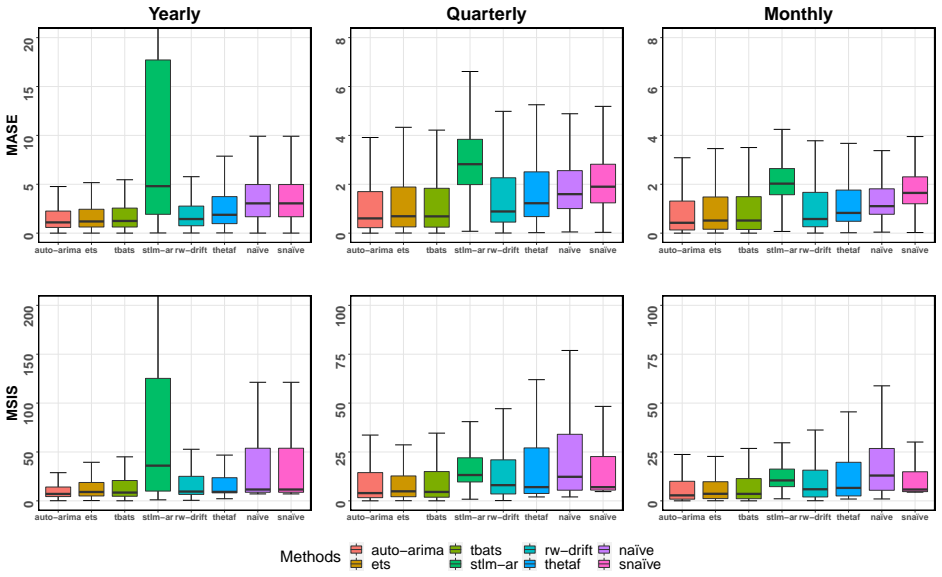
- [Section 4.2 and Figure 3] Figure 3 appears to include the snaïve method for yearly series, but Section 4.2 states that snaïve is not considered in the model pool for yearly series because it coincides with naïve. Please clarify or correct the figure for the yearly panel.
- [Table 4] The caution that comparisons with M4 participants should be treated with care appears only in the text, not in the table caption. Please add a note to the table itself so that readers who view the table in isolation are not misled about the difference in access to the test data.
- [Figure 8] The MCB plots would be more informative if the numerical values of the mean ranks and the interval widths were provided in a table or in the figure, rather than relying on visual inspection of overlapping intervals.
Circularity Check
No significant circularity: the GAM score models and threshold ratios are fit on the GRATIS reference set and then evaluated out-of-sample on M4, so the reported improvements are not forced by construction.
full rationale
The derivation chain is self-contained and out-of-sample. In the training phase, the authors generate a reference dataset with GRATIS, compute MSIS for each individual method on that reference set, fit GAMs (Eq. 2) relating features to log(MSIS), form softmax weights (Eq. 3), and select threshold ratios by minimizing average reference-set MSIS (Algorithm 1). The testing phase then applies these pre-trained GAMs and the selected thresholds to the M4 series, which were not used for fitting the GAMs or choosing the thresholds. Thus the claimed M4 MSIS/MASE gains in Table 3 and Fig. 8 are genuine out-of-sample evaluations rather than fits renamed as predictions. The explicit assumption in Section 2.3 that the reference and test sets originate from the same population is a stated transferability condition, not a circular reduction: GRATIS is an external, code-reproduced simulator, and the coverage claim from Kang et al. (2020), though co-authored by two present authors, is independently checkable and does not encode the target MSIS result. The GAM softmax and threshold-search mechanisms are designed to minimize MSIS, but their effectiveness on M4 is an empirical question answered by held-out data, not an identity. The paper's caveat about having access to M4 test data affects the fairness of comparisons with M4 submissions, not the internal derivation. No equation in the paper reduces a prediction to its input by construction.
Assumptions & free parameters
free parameters (1)
- optimal threshold ratio Tr =
0.3 for simple average, 0.2 for weighted average
assumptions (2)
- domain assumption The reference dataset and the test dataset originate from the same population (feature-space coverage).
- standard math GAM smooth terms estimated via penalized iterative least squares with generalized cross-validation provide adequate fits.
Cite this review
Pith. "Pith review of The uncertainty estimation of feature-based forecast combinations." pith.science (2026). https://pith.science/paper/4Z4XVFLX
@misc{pith2026190802891,
  author       = {Pith},
  title        = {Pith review of: The uncertainty estimation of feature-based forecast combinations},
  year         = {2026},
  howpublished = {\url{https://pith.science/paper/4Z4XVFLX}},
  note         = {Machine review of arXiv:1908.02891}
}
read the original abstract
Forecasting is an indispensable element of operational research (OR) and an important aid to planning. The accurate estimation of the forecast uncertainty facilitates several operations management activities, predominantly in supporting decisions in inventory and supply chain management and effectively setting safety stocks. In this paper, we introduce a feature-based framework, which links the relationship between time series features and the interval forecasting performance into providing reliable interval forecasts. We propose an optimal threshold ratio searching algorithm and a new weight determination mechanism for selecting an appropriate subset of models and assigning combination weights for each time series tailored to the observed features. We evaluate our approach using a large set of time series from the M4 competition. Our experiments show that our approach significantly outperforms a wide range of benchmark models, both in terms of point forecasts as well as prediction intervals.
Figures

Figures from the paper (5 more)



Reference graph
Works this paper leans on
-
[1]
assimakopoulos2000theta APACrefauthors Assimakopoulos, V. \ Nikolopoulos, K. APACrefauthors \ 2000 . The Theta model: a decomposition approach to forecasting The Theta model: a decomposition approach to forecasting . International Journal of Forecasting 16 4 521--530
work page 2000
-
[2]
cang2014combination APACrefauthors Cang, S. \ Yu, H. APACrefauthors \ 2014 . A combination selection algorithm on forecasting A combination selection algorithm on forecasting . European Journal of Operational Research 234 1 127--139
work page 2014
-
[3]
cleveland1990stl APACrefauthors Cleveland, R B. , Cleveland, W S. , McRae, J E. \ Terpenning, I. APACrefauthors \ 1990 . STL : A seasonal-trend decomposition STL : A seasonal-trend decomposition . Journal of Official Statistics 6 1 3--73
work page 1990
-
[4]
Fildes2008 APACrefauthors Fildes, R. , Nikolopoulos, K. , Crone, S F. \ Syntetos, A A. APACrefauthors \ 2008 . Forecasting and operational research: a review Forecasting and operational research: a review . Journal of the Operational Research Society 59 9 1150--1172
work page 2008
-
[5]
gneiting2007strictly APACrefauthors Gneiting, T. \ Raftery, A E. APACrefauthors \ 2007 . Strictly proper scoring rules, prediction, and estimation Strictly proper scoring rules, prediction, and estimation . Journal of the American Statistical Association 102 477 359--378
work page 2007
-
[6]
goodfellow2016deep APACrefauthors Goodfellow, I. , Bengio, Y. , Courville, A. \ Bengio, Y. APACrefauthors \ 2016 . Deep learning Deep learning \ ( 1)\ ( 2). MIT press Cambridge
work page 2016
-
[7]
hastie1990generalized APACrefauthors Hastie, T J. \ Tibshirani, R J. APACrefauthors \ 1990 . Generalized additive models Generalized additive models \ ( 43). CRC press
work page 1990
-
[8]
hora2004probability APACrefauthors Hora, S C. APACrefauthors \ 2004 . Probability judgments for continuous quantities: Linear combinations and calibration Probability judgments for continuous quantities: Linear combinations and calibration . Management Science 50 5 597--604
work page 2004
Show all 31 references
-
[9]
, Athanasopoulos, G
hyndman2018forecast APACrefauthors Hyndman, R J. , Athanasopoulos, G. , Bergmeir, C. , Caceres, G. , Chhay, L. , O'Hara-Wild, M. Yasmeen, F. APACrefauthors \ 2019 . forecast : Forecasting functions for time series and linear models forecast : Forecasting functions for time ser...
2019
-
[10]
, Kang, Y
rtsfeatures APACrefauthors Hyndman, R J. , Kang, Y. , Montero-Manso, P. , Talagala, T S. , Wang, E. , Yang, Y. \ O’Hara-Wild, M. APACrefauthors \ 2019 . tsfeatures: Time Series Feature Extraction tsfeatures: Time Series Feature Extraction \ [ ]. APACrefURL https://CRAN.R-proje...
2019
-
[11]
\ Koehler, A B
hyndman2006another APACrefauthors Hyndman, R J. \ Koehler, A B. APACrefauthors \ 2006 . Another look at measures of forecast accuracy Another look at measures of forecast accuracy . International Journal of Forecasting 22 4 679--688
2006
-
[12]
, Koehler, A B
hyndman2002state APACrefauthors Hyndman, R J. , Koehler, A B. , Snyder, R D. \ Grose, S. APACrefauthors \ 2002 . A state space framework for automatic forecasting using exponential smoothing methods A state space framework for automatic forecasting using exponential smoothing ...
2002
-
[13]
, Hyndman, R J
kang2020gratis APACrefauthors Kang, Y. , Hyndman, R J. \ Li, F. APACrefauthors \ 2020 . GRATIS : GeneRAting TIme Series with diverse and controllable characteristics GRATIS : GeneRAting TIme Series with diverse and controllable characteristics . Statistical Analysis and Data M...
2020
-
[14]
, Hyndman, R J
kang2017visualising APACrefauthors Kang, Y. , Hyndman, R J. \ Smith-Miles, K. APACrefauthors \ 2017 . Visualising forecasting algorithm performance using time series instance spaces Visualising forecasting algorithm performance using time series instance spaces . International...
2017
-
[15]
rgratis APACrefauthors Kang, Y. , Li, F. , Hyndman, R J. , O'Hara-Wild, M. \ Zhao, B. APACrefauthors \ 2020 . gratis : GeneRAting TIme Series with diverse and controllable characteristics gratis : GeneRAting TIme Series with diverse and controllable characteristics \ [ ]. APAC...
2020
-
[16]
, Franses, P H
koning2005m3 APACrefauthors Koning, A J. , Franses, P H. , Hibon, M. \ Stekler, H O. APACrefauthors \ 2005 . The M3 competition: Statistical tests of the results The M3 competition: Statistical tests of the results . International Journal of Forecasting 21 3 397--409
2005
-
[17]
, Grushka-Cockayne, Y
lichtendahl2013better APACrefauthors Lichtendahl Jr, K C. , Grushka-Cockayne, Y. \ Winkler, R L. APACrefauthors \ 2013 . Is it better to average probabilities or quantiles? Is it better to average probabilities or quantiles? Management Science 59 7 1594--1611
2013
-
[18]
, Spiliotis, E
makridakis2020m4 APACrefauthors Makridakis, S. , Spiliotis, E. \ Assimakopoulos, V. APACrefauthors \ 2020 . The M4 Competition: 100,000 time series and 61 forecasting methods The M4 competition: 100,000 time series and 61 forecasting methods . International Journal of Forecast...
2020
-
[19]
, Athanasopoulos, G
montero2020fforma APACrefauthors Montero-Manso, P. , Athanasopoulos, G. , Hyndman, R J. \ Talagala, T S. APACrefauthors \ 2020 . FFORMA : Feature-based forecast model averaging FFORMA : Feature-based forecast model averaging . International Journal of Forecasting 36 1 86--92
2020
-
[20]
, Netto, C
montero2018m4comp2018 APACrefauthors Montero-Manso, P. , Netto, C. \ Talagala, T S. APACrefauthors \ 2018 . M4comp2018 : Data from the M4-Competition M4comp2018 : Data from the M4-Competition \ [ ]. R package version: 0.1.0
2018
-
[21]
APACrefauthors \ 2020
Nikolopoulos2020-zi APACrefauthors Nikolopoulos, K. APACrefauthors \ 2020 . We need to talk about intermittent demand forecasting We need to talk about intermittent demand forecasting . European Journal of Operational Research in press . APACrefDOI doi:10.1016/j.ejor.2019.12.0...
2020 doi
-
[22]
, Hyndman, R J
Petropoulos2018-cl APACrefauthors Petropoulos, F. , Hyndman, R J. \ Bergmeir, C. APACrefauthors \ 2018 . Exploring the sources of uncertainty: Why does bagging for time series forecasting work? Exploring the sources of uncertainty: Why does bagging for time series forecasting ...
2018
-
[23]
, Makridakis, S
petropoulos2014horses APACrefauthors Petropoulos, F. , Makridakis, S. , Assimakopoulos, V. \ Nikolopoulos, K. APACrefauthors \ 2014 . ‘ Horses for Courses ’ in demand forecasting ‘ Horses for Courses ’ in demand forecasting . European Journal of Operational Research 237 1 152--163
2014
-
[24]
, Sarker, B R
Rahman2011 APACrefauthors Rahman, M A. , Sarker, B R. \ Escobar, L A. APACrefauthors \ 2011 . Peak demand forecasting for a seasonal product using Bayesian approach Peak demand forecasting for a seasonal product using bayesian approach . Journal of the Operational Research Soc...
2011
-
[25]
, Boylan, J E
inventoryreview APACrefauthors Syntetos, A A. , Boylan, J E. \ Disney, S M. APACrefauthors \ 2009 . Forecasting for inventory planning: a 50-year review Forecasting for inventory planning: a 50-year review . Journal of the Operational Research Society 60 sup1 S149--S160
2009
-
[26]
, Hyndman, R J
talagala2018meta APACrefauthors Talagala, T S. , Hyndman, R J. \ Athanasopoulos, G. APACrefauthors \ 2018 . Meta-learning how to forecast time series Meta-learning how to forecast time series . Monash Econometrics and Business Statistics Working Papers 6 18
2018
-
[27]
APACrefauthors \ 2017
Taylor2017-sk APACrefauthors Taylor, J W. APACrefauthors \ 2017 . Probabilistic forecasting of wind power ramp events using autoregressive logit models Probabilistic forecasting of wind power ramp events using autoregressive logit models . European Journal of Operational Resea...
2017
-
[28]
\ Wong, M C
Tung2009 APACrefauthors Tung, H K. \ Wong, M C. APACrefauthors \ 2009 . Financial risk forecasting with nonlinear dynamics and support vector regression Financial risk forecasting with nonlinear dynamics and support vector regression . Journal of the Operational Research Socie...
2009
-
[29]
\ Macready, W G
wolpert1997no APACrefauthors Wolpert, D H. \ Macready, W G. APACrefauthors \ 1997 . No free lunch theorems for optimization No free lunch theorems for optimization . IEEE Transactions on Evolutionary Computation 1 1 67--82
1997
-
[30]
APACrefauthors \ 2001
wood2001mgcv APACrefauthors Wood, S N. APACrefauthors \ 2001 . mgcv: GAMs and generalized ridge regression for R mgcv: GAMs and generalized ridge regression for R . R News 1 2 20--25
2001
-
[31]
\ Wood, M S
wood2015package APACrefauthors Wood, S N. \ Wood, M S. APACrefauthors \ 2019 . Package ‘mgcv’ Package ‘mgcv’ \ [ ]. APACrefURL https://CRAN.R-project.org/package=mgcv APACrefURL R package version 1.8-31
2019
Reviewed August 14, 2026 · model on record in the stance chip above.
Discussion (0). Continue with ORCID to comment.