REVIEW 2 major objections 6 minor 1 cited by
VisJSClassificator -- Manual Visual Collaborative Classification Graph-based Tool
T0 review · 2 major / 6 minor · reviewed 2026-08-14 · deepseek-v4-flash
Pith's one-line read This paper introduces a manual, collaborative, graph-based image-labeling tool for open-set classification, where labels and their number are discovered during labeling rather than fixed in advance.
desk verdict A small, honest tool paper: the graph-based labeling tool is real and open-source, the evaluation is explicitly anecdotal, and the central claim holds up enough for serious peer review. read the letter →
The pith
A machine-rendered reading of the paper's core claim, the machinery that carries it, and where it could break.
The reading
What carries the argument
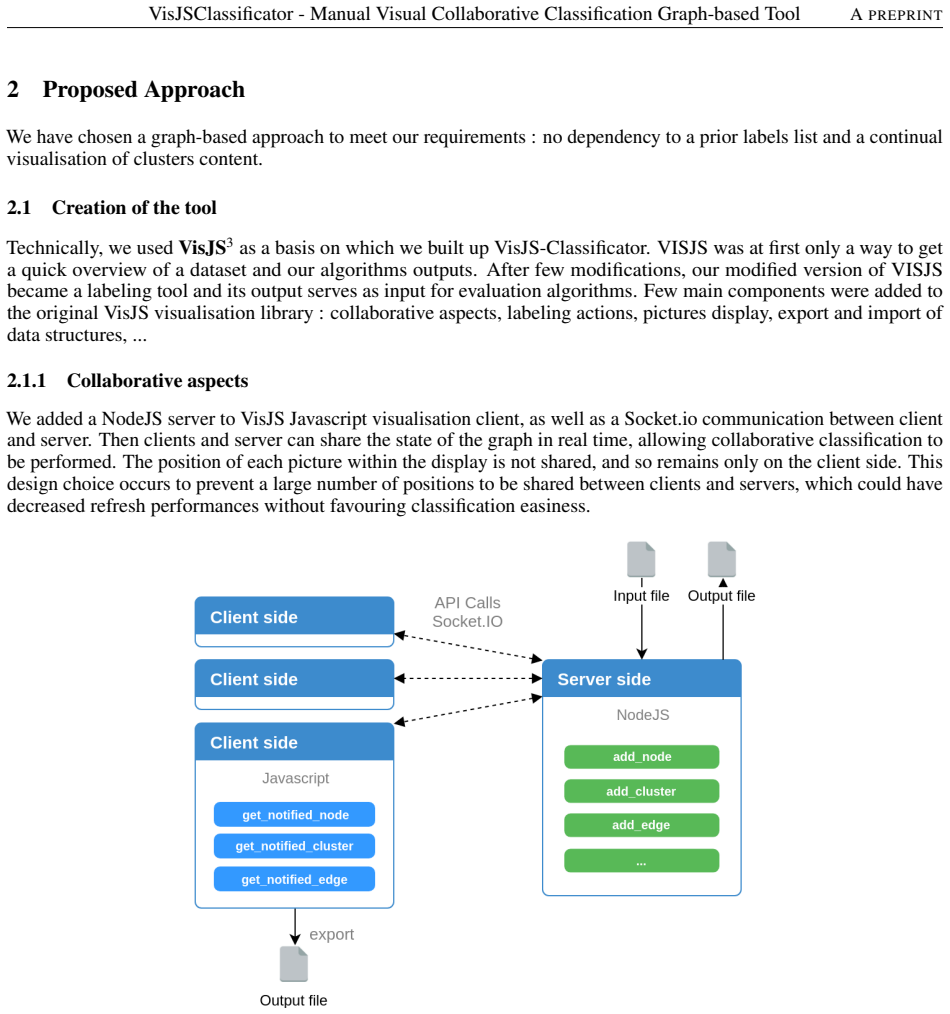
The load-bearing object is a labeled graph whose nodes are the images plus one "anchor" node per cluster; an edge from an image node to an anchor means the image belongs to that cluster, and the anchor's text label names the cluster. Making this graph the live interface is what lets a user compare an unlabeled picture against every picture already placed, so label consistency does not depend on memory. A real-time server shares the graph structure among collaborators, while picture positions stay client-side for performance. The exported graph—nodes, anchors, edges, and labels—doubles as the ground-truth file for training or evaluating automatic classifiers.
What would settle it
Run a controlled study where at least twenty annotators label the same 475-image dataset with both interfaces, measuring average pairwise label agreement and time per picture. If the graph interface does not produce measurably higher agreement per hour of effort, the paper's central quality claim fails.
Extended reading notes
Core claim
The central discovery is that a graph representation can serve as both the labeling interface and the ground-truth format for open-set image classification. A user drags pictures, selects a set, presses one key to create a cluster anchor, and names the anchor; because the graph is always visible, the user can see exactly what is already inside every cluster before assigning a new picture. The tool shares graph state across collaborators in real time, exports the resulting clusters and labels as structured data, and can load graphs up to thousands of pictures at usable frame rates. In the reported comparison, the graph-based tool took longer per picture than a conventional list-and-label tool, but the clusters it produced were judged more consistent and its labeling quality was rated 4.5 against 3 on a 5-point scale.
Load-bearing premise
The approach assumes that continuously seeing every picture already placed in a cluster improves labeling consistency enough to justify the slower interaction, an effect supported only by a handful of participants in the reported tests.
Editorial extensions
If this is right
- Datasets with unknown content can be labeled in one pass: no preliminary scanning of the whole dataset to fix a label list, and no second pass to relabel.
- Collaborators always see the same cluster structure in real time, so teams can split labeling work without losing a shared notion of each label.
- The exported graph provides a ground-truth representation, with clusters and labels, ready to feed automatic classification and image-matching evaluation.
- Because new labels can be created mid-task and are visible immediately, the tool is suited to open-set data such as scraped screenshots where the class inventory is not known ahead.
Reading between the lines
- The privacy of node positions suggests the shared state could be summarized and merged across sessions, so parallel labeling of disjoint image subsets may be combined without sending every layout detail.
- The reported "aversion to label creation" points to a concrete usability cost: if cluster naming is the bottleneck, adding cheap split, merge, and rename operations is the natural next experiment to test.
- A larger multi-annotator study comparing inter-rater agreement, not just speed, would turn the consistency hypothesis into a measurable property; the paper's current participant counts are too small for that.
- The same graph-based labeling loop could apply to any collection of visual or textual items where an item can be shown as a thumbnail, not only to screenshots.
Signed reviews
Editorial analysis
A structured set of objections, weighed in public.
Referee Report
Summary. The paper presents VisJSClassificator, an open-source, graph-based, collaborative manual image classification tool designed for open-set classification problems where the set of labels is not known in advance. The tool is built on VisJS with a NodeJS and Socket.io backend for real-time collaboration, supports clustering pictures by creating 'anchor' nodes, renaming clusters, and exporting/importing a JSON graph structure. The authors evaluate the tool with two small experiments comparing it against DataTurks, one with 85 images and three participants and one with 475 images and a single participant, plus a participant feedback questionnaire. The paper concludes that its main contribution is the introduction of the tool, which is available at github.com/Vincent-CIRCL/visjs_classificator.
Significance. If the tool is functional and maintained, it addresses a genuine niche: analysts who need to label datasets where both the labels and their number are unknown, while also needing collaborative work and continuous visualization of cluster contents. The manuscript's strengths include its clear architecture description (Section 2.1.1), the documented JSON data format (Listing 1), and an unusually honest treatment of the evaluation's limitations, with the authors explicitly stating that the results are not statistically representative. The open-source availability is explicitly named and is central to the contribution. The empirical comparison is underpowered and confounded, but the paper's central claim is the existence and design of the tool rather than a statistically validated performance superiority, so the evaluation weaknesses do not undermine the main contribution if properly framed as anecdotal.
major comments (2)
- [Section 3.3.2 and Table 3] The statement 'We have to highlight that the relative quality of clustering/labelling was lower with dataturks than with visjs' is presented as a finding, but it is based on a single participant and uncontrolled conditions. The paper itself acknowledges in Section 3 that the results are not statistically representative, so this claim should be reframed as an exploratory observation, not as a highlighted result. Please remove the 'We have to highlight' phrasing and explicitly state that this is one participant's experience.
- [Section 3.3.1 and Table 1] The 85-picture comparison is confounded: participant 1 was given labels and already knew the dataset, while participants 2 and 3 had to define labels without prior dataset knowledge. Reporting the times side by side in a single table without per-row condition annotations makes the rows look directly comparable, which they are not. Add explicit footnotes or a separate design column so that the reader is not misled about the basis for the comparison.
minor comments (6)
- [Abstract] The phrase 'seemed limited' should read 'seem limited' to match the present tense of the rest of the abstract.
- [Section 1] The sentence 'In datasets become larger' is missing a word; it should be 'As datasets become larger'.
- [Section 3.2] The caption of Figure 4a says 'On the right-hand side is the picture to be labelled, on the right-hand side are labels to choose from'; one of these should presumably be 'left-hand side'.
- [Section 3.3.3] The text refers to 'Results are presented in Figure 3', but the feedback results are presented in Table 3; the cross-reference should be corrected.
- [Listing 1] The JSON listing is hard to read in the preprint because many spaces and line breaks appear to have been collapsed; please format the listing with proper indentation.
- [Section 3.3.1] The bullet 'Improvement in speed is clear' is ambiguous: the table shows VisJS is slower than DataTurks, so the improvement is not in tool speed but in the participant's speed over the course of a single dataset. Please reword to avoid confusion.
Circularity Check
No circularity: the paper reports a software contribution with a small, explicitly non-representative user study, and no derived quantity is defined in terms of the tool's own output.
full rationale
The paper's central claim is that VisJSClassificator is an open-source, manual, collaborative, graph-based labeling tool for open-set classification, supported by an architecture description, interaction design, data-structure listing, and link to the repository. There are no fitted parameters, equations, or statistical predictions derived from the tool's own output. The user study compares VisJSClassificator with DataTurks, an external baseline, and the paper explicitly states 'These results are not statistically representative', so the evaluative observations are presented as insights rather than as forced conclusions. No result is defined in terms of itself, no cited prior work supplies a load-bearing uniqueness argument, and no ansatz is smuggled in via self-citation. The only caution is the untested reproducibility of the repository itself, which is a verification matter, not a circularity issue. The analysis therefore finds no significant circularity.
Assumptions & free parameters
assumptions (3)
- domain assumption Human manual labels produced by this tool are treated as ground truth for training or evaluating automatic classifiers.
- domain assumption Continuous visualization of all cluster members improves labeling consistency.
- domain assumption Real-time state sharing via Socket.io preserves collaborative consistency without degrading performance.
Cite this review
Pith. "Pith review of VisJSClassificator -- Manual Visual Collaborative Classification Graph-based Tool." pith.science (2026). https://pith.science/paper/5DVG6ZNP
@misc{pith2026190802941,
  author       = {Pith},
  title        = {Pith review of: VisJSClassificator -- Manual Visual Collaborative Classification Graph-based Tool},
  year         = {2026},
  howpublished = {\url{https://pith.science/paper/5DVG6ZNP}},
  note         = {Machine review of arXiv:1908.02941}
}
read the original abstract
Analysts need to classify, search and correlate numerous images. Automatic classification tools improve the efficiency of such tasks. However, classified data is a prerequisite to develop these tools. Labelling tools are of great use in case of already known classes, but seemed limited for Open Set Classification. This paper presents a manual and collaborative classification tool, which uses graph representation.
Figures


Figures from the paper (2 more)


Forward citations
Cited by 1 Pith paper
-
Douglas-Quaid -- Open Source Image Matching Library
Douglas-Quaid is an open-source image matching library that combines fuzzy hashes and ORB with decision fusion and self-calibration, reporting 80% accuracy on a CERT screenshot dataset.
Reference graph
Works this paper leans on
-
[1]
AIL - The design and implementation of an Analysis Information Leak framework,
S. Mokaddem, G. Wagener, and A. Dulaunoy, “AIL - The design and implementation of an Analysis Information Leak framework,” in2018 IEEE International Conference on Big Data (Big Data) , pp. 5049–5057
-
[2]
Vincent-CIRCL, “Classificator for pictures matching and clustering. Fast and visual.: Vincent- CIRCL/visjs_classificator.” [Online]. Available: https://github.com/Vincent-CIRCL/visjs_classificator 9
Reviewed August 14, 2026 · model on record in the stance chip above.
Discussion (0). Continue with ORCID to comment.