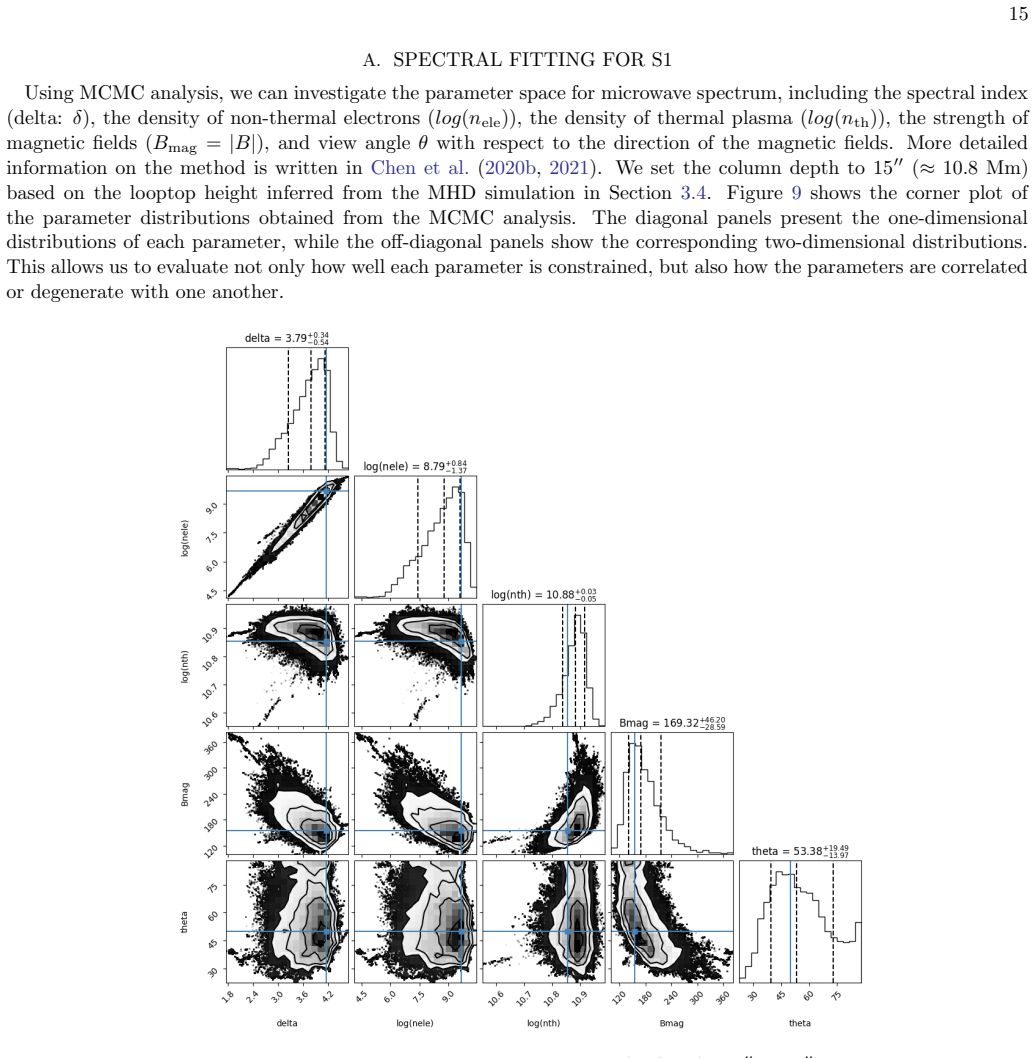
Non-thermal Sources from Stereoscopic Hard X-ray and Earth-based Microwave Observations in a Data-Constrained Magnetohydrodynamic Simulation
Pith reviewed 2026-06-30 04:28 UTC · model grok-4.3
The pith
Data-constrained MHD simulation reproduces the observed heights of both the main looptop and secondary non-thermal sources in the 2024 X7.1 flare.
A machine-rendered reading of the paper's core claim, the machinery that carries it, and where it could break.
Core claim
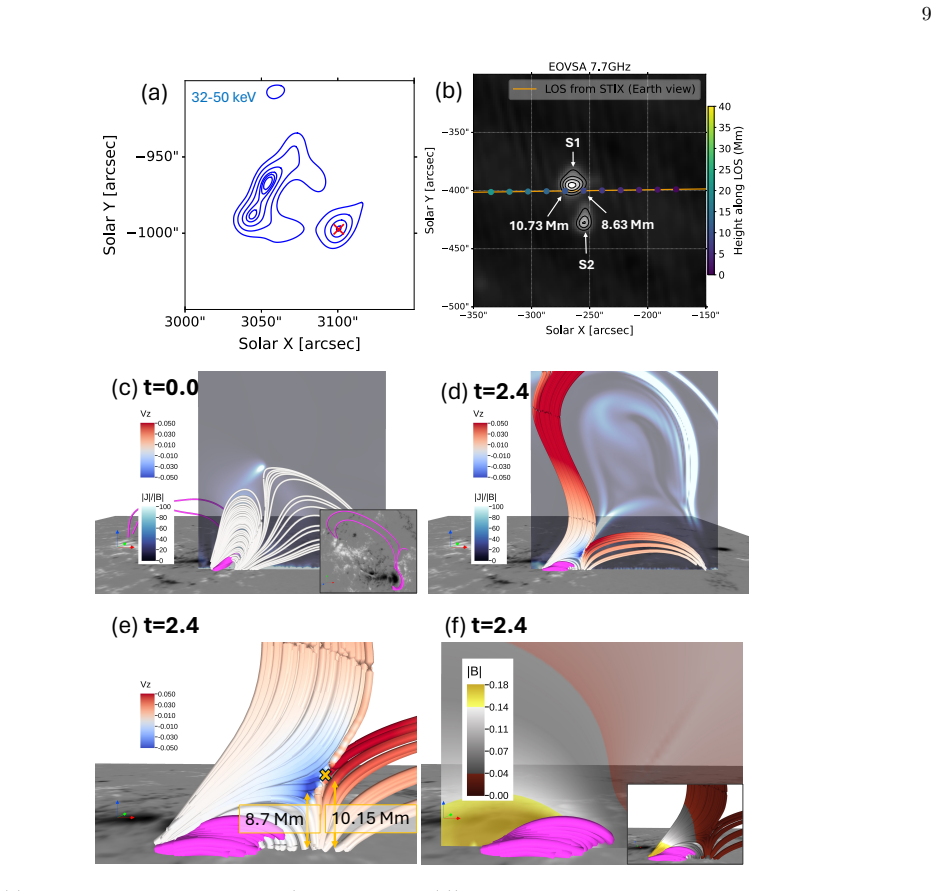
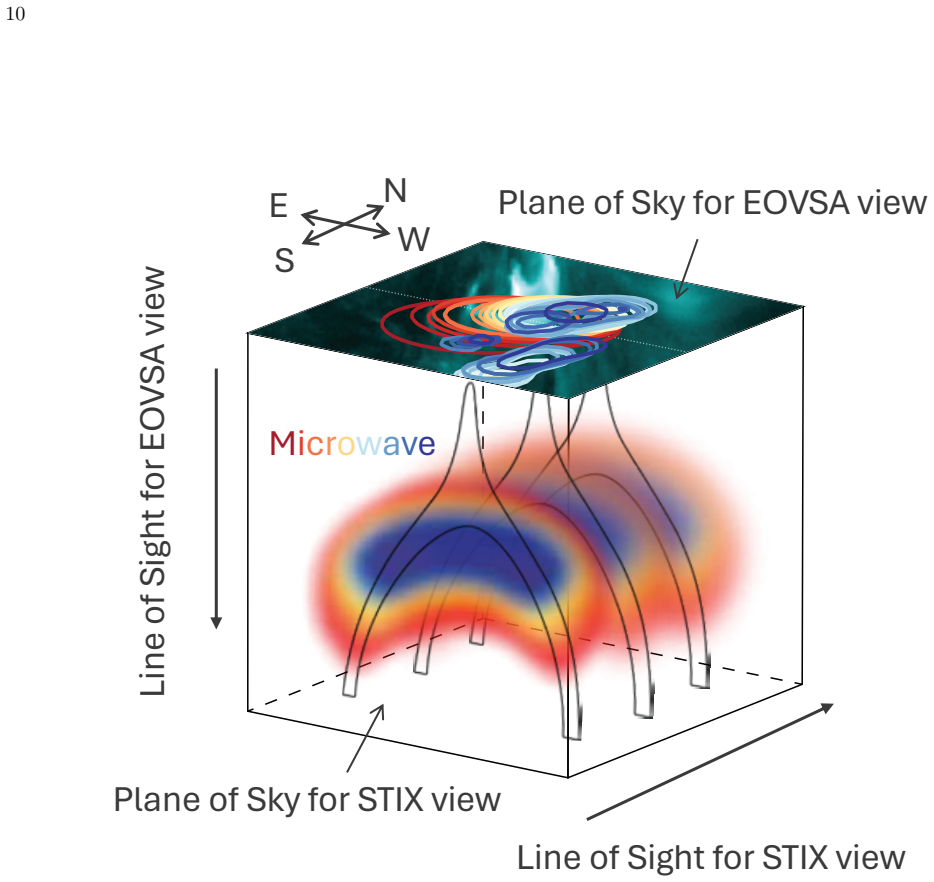
The height of the non-thermal looptop source is consistent between the stereoscopic analysis and the MHD simulation. The height of the secondary source is consistent between the stereoscopic analysis and the MHD simulation. Microwave spectral fitting suggests a higher low-energy cutoff for non-thermal electrons in the secondary microwave source than in the main looptop source. This may reflect the transport of electrons pre-accelerated near the looptop source by the southward plasma ejection.
What carries the argument
Data-constrained three-dimensional magnetohydrodynamic simulation initialized from a nonlinear force-free field extrapolation and further constrained by the stereoscopically measured height of the non-thermal looptop source.
If this is right
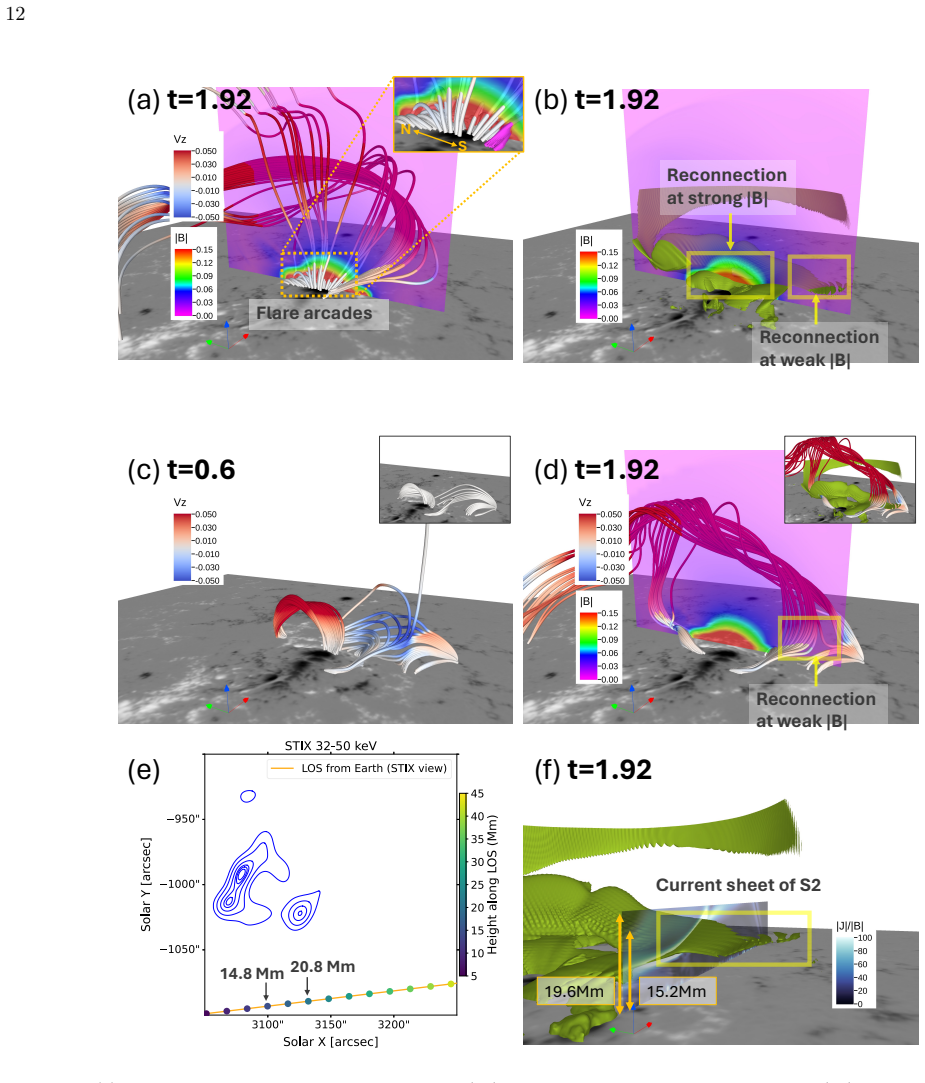
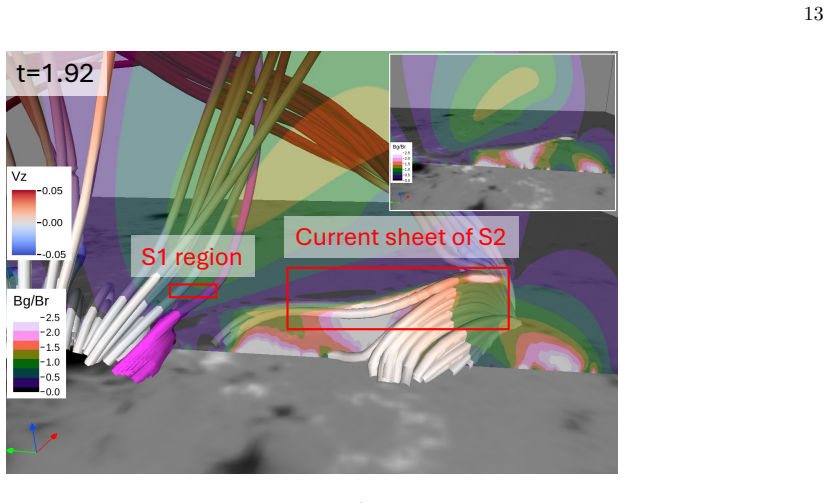
- Reconnection in strong-field regions of the current sheet produces flare arcades with dominant looptop emission while reconnection in weaker southern regions produces secondary microwave emission at higher altitudes.
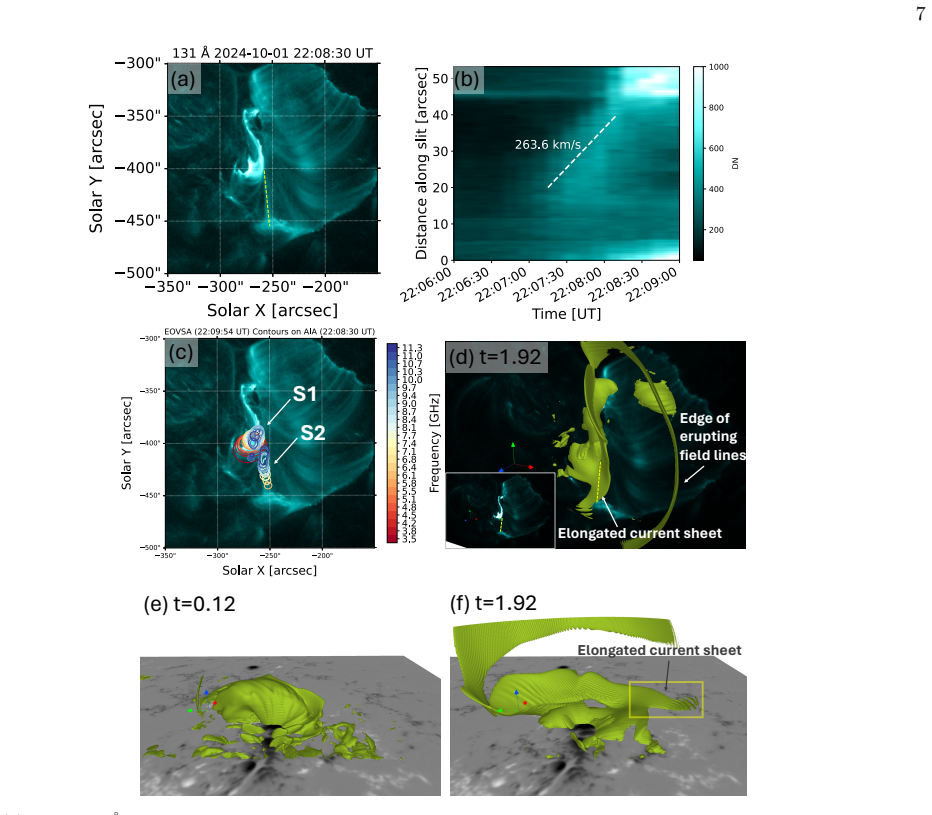
- The secondary microwave source is localized to the southern segment of the elongated current sheet even though the sheet grows in multiple directions.
- The higher low-energy cutoff inferred for the secondary source is consistent with electrons being pre-accelerated near the looptop and then transported outward by the plasma ejection.
Where Pith is reading between the lines
- The same data-constrained approach could be used on other well-observed flares to test whether the distribution of non-thermal emission along a current sheet is systematically controlled by local magnetic field strength.
- If the transport interpretation holds, time-resolved microwave spectra during the ejection phase should show a progressive hardening or cutoff increase at the secondary site.
- The simulation results imply that large-scale source heights are robust against unresolved small-scale magnetic structure in this event, which could be checked by comparing runs with added sub-grid turbulence.
Load-bearing premise
The nonlinear force-free field extrapolation from photospheric vector magnetograms supplies an initial magnetic configuration whose subsequent evolution under the data-constrained MHD simulation faithfully reproduces the observed non-thermal source heights without significant influence from unresolved small-scale fields or projection effects in the stereoscopic measurements.
What would settle it
New stereoscopic hard X-ray observations of a similar flare that place the looptop or secondary source at a height measurably different from the height produced by an otherwise identical data-constrained MHD run would falsify the claimed consistency.
Figures
read the original abstract
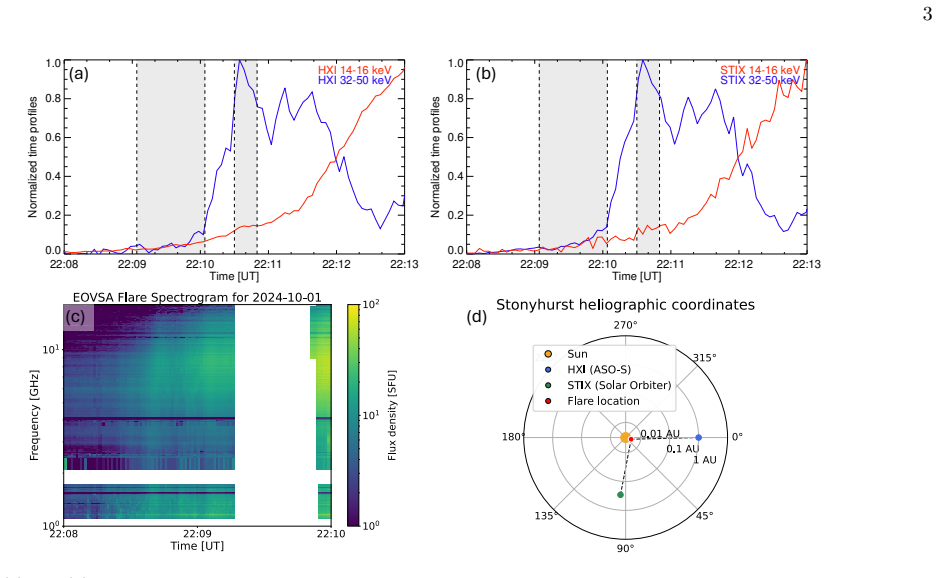
We analyze the X7.1 flare on 2024 October 1 from NOAA AR 13842 using hard X-ray (HXR) imaging, microwave observations by the Expanded Owens Valley Solar Array (EOVSA), and a three-dimensional Magnetohydrodynamic (MHD) simulation. The flare was observed from two vantage points, with Solar Orbiter/Spectrometer Telescope for Imaging X-rays viewing the flare near the limb and Advanced Space-based Solar Observatory/Hard X-ray Imager and EOVSA observing it on the disk. We carried out a data-constrained MHD simulation using a nonlinear force-free field extrapolation as the initial condition and constrained the height of the non-thermal looptop source from stereoscopic HXR and microwave observations. The height is consistent between the stereoscopic analysis and the MHD simulation. A secondary non-thermal microwave source aligned with a southward plasma ejection corresponds to an elongated current sheet. Although the current sheet grows in multiple directions, the secondary microwave emission is observed only from the southern segment. This localization suggests reconnection in regions with different magnetic field strengths. Reconnection in strong-field regions produces flare arcades with dominant looptop emission, whereas reconnection in weaker southern regions gives rise to secondary microwave emission at higher altitudes. The height of the secondary source is consistent between the stereoscopic analysis and the MHD simulation. Microwave spectral fitting suggests a higher low-energy cutoff for non-thermal electrons in the secondary microwave source than in the main looptop source. This may reflect the transport of electrons pre-accelerated near the looptop source by the southward plasma ejection.
Editorial analysis
A structured set of objections, weighed in public.
Referee Report
Summary. The manuscript analyzes the 2024 October 1 X7.1 flare using stereoscopic HXR imaging from Solar Orbiter/STIX and ASO-S/HXI together with EOVSA microwave data and a data-constrained 3D MHD simulation initialized from an NLFFF extrapolation. The central claims are that (i) the height of the main non-thermal looptop source is consistent between stereoscopic measurements and the simulation, (ii) a secondary microwave source aligned with a southward plasma ejection and elongated current sheet has a height also consistent with the simulation, and (iii) spectral fitting shows a higher low-energy cutoff for non-thermal electrons in the secondary source than in the looptop source, interpreted as transport by the ejection.
Significance. If the height consistencies were shown to be independent of the imposed constraint, the work would provide a concrete demonstration that data-constrained MHD models can locate non-thermal sources and distinguish reconnection regimes in strong versus weak field regions. The reported difference in low-energy cutoffs would then supply a falsifiable signature of electron transport between sites. The current constraint step, however, removes the ability to test whether the NLFFF initial condition plus MHD evolution reproduces the observed heights on its own.
major comments (2)
- [MHD simulation description] MHD simulation description (abstract and methods): the simulation is explicitly 'constrained the height of the non-thermal looptop source from stereoscopic HXR and microwave observations' and then reports that 'the height is consistent'. Because the looptop height is an input constraint rather than an output prediction, the reported agreement is enforced by construction and does not constitute an independent verification of the NLFFF+MHD model. This directly weakens the central consistency claim for the main source; the secondary-source consistency may be independent but is not distinguished in the text.
- [Results on secondary source] Results on secondary source: the claim that the secondary microwave source 'corresponds to an elongated current sheet' and that emission is localized to the southern segment relies on the simulation geometry, yet no quantitative comparison (e.g., current-sheet thickness, field strength at the two segments, or predicted versus observed microwave brightness) is provided to show that the localization is a model prediction rather than a post-hoc interpretation.
minor comments (2)
- [Spectral fitting] The abstract and text state that 'microwave spectral fitting suggests a higher low-energy cutoff' but supply neither the fitting method, the functional form used, nor the formal uncertainties on the cutoff energies; these details are required to assess whether the reported difference is statistically significant.
- [Observation analysis] Error budgets and projection effects for the stereoscopic height measurements are not quantified; the reader's weakest-assumption note on unresolved small-scale fields and projection effects should be addressed with explicit sensitivity tests.
Simulated Author's Rebuttal
We thank the referee for the constructive comments on our manuscript. We address each major comment below and will incorporate revisions to strengthen the presentation.
read point-by-point responses
-
Referee: MHD simulation description (abstract and methods): the simulation is explicitly 'constrained the height of the non-thermal looptop source from stereoscopic HXR and microwave observations' and then reports that 'the height is consistent'. Because the looptop height is an input constraint rather than an output prediction, the reported agreement is enforced by construction and does not constitute an independent verification of the NLFFF+MHD model. This directly weakens the central consistency claim for the main source; the secondary-source consistency may be independent but is not distinguished in the text.
Authors: We agree that the main looptop source height was imposed as a constraint, so the reported consistency for that source is by construction and does not provide an independent test of the NLFFF+MHD evolution. The secondary source height was not constrained. We will revise the abstract, methods, and discussion sections to explicitly distinguish the two cases, clarify the nature of the constraint, and temper the language on verification for the main source while highlighting the independent check provided by the secondary source. revision: yes
-
Referee: Results on secondary source: the claim that the secondary microwave source 'corresponds to an elongated current sheet' and that emission is localized to the southern segment relies on the simulation geometry, yet no quantitative comparison (e.g., current-sheet thickness, field strength at the two segments, or predicted versus observed microwave brightness) is provided to show that the localization is a model prediction rather than a post-hoc interpretation.
Authors: We acknowledge the need for quantitative support. In the revised manuscript we will add direct measurements from the simulation of current-sheet thickness, magnetic field strengths along the northern versus southern segments, and forward-modeled microwave brightness using the derived non-thermal electron distributions. These additions will demonstrate that the observed southern localization follows from the model rather than post-hoc interpretation. revision: yes
Circularity Check
Looptop height consistency is enforced by the explicit data constraint in the MHD simulation rather than independently verified.
specific steps
-
fitted input called prediction
[Abstract]
"We carried out a data-constrained MHD simulation using a nonlinear force-free field extrapolation as the initial condition and constrained the height of the non-thermal looptop source from stereoscopic HXR and microwave observations. The height is consistent between the stereoscopic analysis and the MHD simulation."
The simulation is initialized and run with the looptop height explicitly set to reproduce the observed stereoscopic value; reporting consistency afterward is therefore enforced by the constraint step itself and does not constitute an independent test of whether the NLFFF+MHD evolution would have produced that height.
full rationale
The paper explicitly states that a data-constrained MHD simulation was performed by constraining the non-thermal looptop source height to match stereoscopic observations, then reports that the height is consistent. This reduces the central consistency claim for the main source to a tautology by construction. The secondary source consistency and microwave spectral fitting are not directly forced by the same constraint and retain independent content, so the overall circularity is partial rather than total. No other load-bearing steps (self-citations, ansatzes, or renamings) are evident from the provided text.
Axiom & Free-Parameter Ledger
free parameters (1)
- low-energy cutoff energy
axioms (2)
- domain assumption Nonlinear force-free field extrapolation from photospheric magnetograms supplies a valid initial coronal magnetic configuration.
- domain assumption Stereoscopic HXR and microwave observations yield accurate source heights free of major projection or calibration biases.
Reference graph
Works this paper leans on
-
[1]
Aschwanden, M. J., Wuelser, J.-P., Nitta, N. V., et al. 2012, ApJ, 756, 124, doi: 10.1088/0004-637X/756/2/124
-
[2]
Aschwanden, M. J., W¨ ulser, J.-P., Nitta, N. V., & Lemen, J. R. 2008, ApJ, 679, 827, doi: 10.1086/529542
-
[3]
2018, ApJ, 862, 80, doi: 10.3847/1538-4357/aac820
Ball, D., Sironi, L., & ¨Ozel, F. 2018, ApJ, 862, 80, doi: 10.3847/1538-4357/aac820
-
[4]
Bastian, T. S., Benz, A. O., & Gary, D. E. 1998, ARA&A, 36, 131, doi: 10.1146/annurev.astro.36.1.131
-
[5]
2025, ApJ, 978, 150, doi: 10.3847/1538-4357/ad98e6
Beck, C., Prasad, A., Hu, Q., et al. 2025, ApJ, 978, 150, doi: 10.3847/1538-4357/ad98e6
-
[6]
Glesener, L. 2021, ApJL, 908, L55, doi: 10.3847/2041-8213/abe471
-
[7]
Chen, B., Yu, S., Reeves, K. K., & Gary, D. E. 2020a, ApJL, 895, L50, doi: 10.3847/2041-8213/ab901a
-
[8]
Chen, B., Shen, C., Gary, D. E., et al. 2020b, Nature Astronomy, 4, 1140, doi: 10.1038/s41550-020-1147-7
-
[9]
2024, ApJ, 971, 85, doi: 10.3847/1538-4357/ad531a
Chen, B., Kong, X., Yu, S., et al. 2024, ApJ, 971, 85, doi: 10.3847/1538-4357/ad531a
-
[10]
2025, ApJL, 990, L50, doi: 10.3847/2041-8213/adfa71
Chen, X., Chen, B., Yu, S., et al. 2025, ApJL, 990, L50, doi: 10.3847/2041-8213/adfa71
-
[11]
Cheung, M. C. M., Boerner, P., Schrijver, C. J., et al. 2015, ApJ, 807, 143, doi: 10.1088/0004-637X/807/2/143
-
[12]
Dahlin, J. T., Drake, J. F., & Swisdak, M. 2016, Physics of Plasmas, 23, 120704, doi: 10.1063/1.4972082
-
[13]
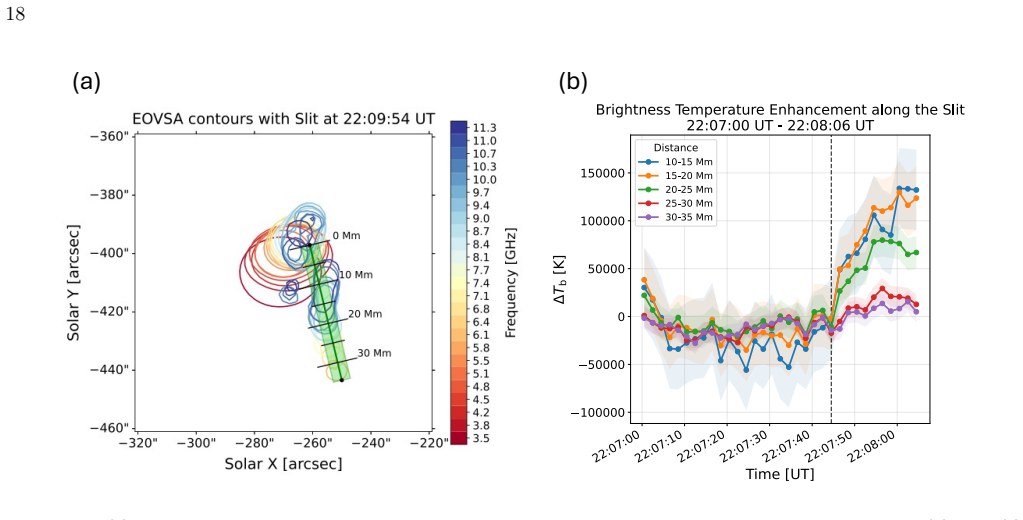
Dedner, A., Kemm, F., Kr¨ oner, D., et al. 2002, Journal of Computational Physics, 175, 645, doi: 10.1006/jcph.2001.6961 18 (a) (b) Figure 11.(a) Microwave observations observed by EOVSA at 22:09:54 UT, identical to those shown in Figures 3 (d) and 4(c), with the slit placed along S2. The slit width is 3 pixels, corresponding to about 6 arcsec (4.35 Mm). ...
-
[14]
Fleishman, G. D., & Kuznetsov, A. A. 2010, ApJ, 721, 1127, doi: 10.1088/0004-637X/721/2/1127
-
[15]
Fletcher, L., Dennis, B. R., Hudson, H. S., et al. 2011, SSRv, 159, 19, doi: 10.1007/s11214-010-9701-8
-
[16]
Gary, D. E., Fleishman, G. D., & Nita, G. M. 2013, SoPh, 288, 549, doi: 10.1007/s11207-013-0299-3
-
[17]
Gary, D. E., Chen, B., Dennis, B. R., et al. 2018, ApJ, 863, 83, doi: 10.3847/1538-4357/aad0ef
-
[18]
Gary, G. A. 2001, SoPh, 203, 71, doi: 10.1023/A:1012722021820
-
[19]
2007, SoPh, 243, 63, doi: 10.1007/s11207-007-0182-1
Golub, L., DeLuca, E., Austin, G., et al. 2007, SoPh, 243, 63, doi: 10.1007/s11207-007-0182-1
-
[20]
2016, Physics of Plasmas, 23, 055708, doi: 10.1063/1.4948284
Guo, F., Li, H., Daughton, W., Li, X., & Liu, Y.-H. 2016, Physics of Plasmas, 23, 055708, doi: 10.1063/1.4948284
-
[21]
1974, SoPh, 34, 323, doi: 10.1007/BF00153671
Hirayama, T. 1974, SoPh, 34, 323, doi: 10.1007/BF00153671
-
[22]
2016, Progress in Earth and Planetary Science, 3, 19, doi: 10.1186/s40645-016-0084-7
Inoue, S. 2016, Progress in Earth and Planetary Science, 3, 19, doi: 10.1186/s40645-016-0084-7
-
[23]
Inoue, S., Hayashi, K., Magara, T., Choe, G. S., & Park, Y. D. 2014a, ApJ, 788, 182, doi: 10.1088/0004-637X/788/2/182
-
[24]
Inoue, S., Magara, T., Pandey, V. S., et al. 2014b, ApJ, 780, 101, doi: 10.1088/0004-637X/780/1/101
-
[25]
Ishikawa, S., Krucker, S., Takahashi, T., & Lin, R. P. 2011, ApJ, 737, 48, doi: 10.1088/0004-637X/737/2/48
-
[26]
2023, ApJL, 942, L3, doi: 10.3847/2041-8213/aca97c
Jin, C., Zhou, G., Ruan, G., et al. 2023, ApJL, 942, L3, doi: 10.3847/2041-8213/aca97c
-
[27]
Kaiser, M. L., Kucera, T. A., Davila, J. M., et al. 2008, SSRv, 136, 5, doi: 10.1007/s11214-007-9277-0
-
[28]
Kaltman, T., Yu, S., Fleishman, G. D., & Ryan, D. F. 2026, A&A, 707, A158, doi: 10.1051/0004-6361/202557507
-
[29]
Kopp, R. A., & Pneuman, G. W. 1976, SoPh, 50, 85, doi: 10.1007/BF00206193
-
[30]
2022, Nature Communications, 13, 7680, doi: 10.1038/s41467-022-35377-0
Kou, Y., Cheng, X., Wang, Y., et al. 2022, Nature Communications, 13, 7680, doi: 10.1038/s41467-022-35377-0
-
[31]
Krucker, S., Hudson, H. S., Glesener, L., et al. 2010, ApJ, 714, 1108, doi: 10.1088/0004-637X/714/2/1108
-
[32]
Krucker, S., Hurford, G. J., Grimm, O., et al. 2020, A&A, 642, A15, doi: 10.1051/0004-6361/201937362
-
[33]
Kuroda, N., Fleishman, G. D., Gary, D. E., et al. 2020, Frontiers in Astronomy and Space Sciences, 7, 22, doi: 10.3389/fspas.2020.00022
-
[34]
The Atmospheric Imaging Assembly (AIA) on the Solar Dynamics Observatory (SDO).Sol
Lemen, J. R., Title, A. M., Akin, D. J., et al. 2012, SoPh, 275, 17, doi: 10.1007/s11207-011-9776-8
-
[35]
2019, Atmosphere, 10, 488, doi: 10.3390/atmos10090488
Li, S., Jaroszynski, S., Pearse, S., Orf, L., & Clyne, J. 2019, Atmosphere, 10, 488, doi: 10.3390/atmos10090488
-
[36]
2015, ApJL, 811, L24, doi: 10.1088/2041-8205/811/2/L24 —
Li, X., Guo, F., Li, H., & Li, G. 2015, ApJL, 811, L24, doi: 10.1088/2041-8205/811/2/L24 —. 2017, ApJ, 843, 21, doi: 10.3847/1538-4357/aa745e 19
-
[37]
2025, ApJ, 983, 38, doi: 10.3847/1538-4357/adba56
Liu, N., Inoue, S., Wang, Y., & Wang, H. 2025, ApJ, 983, 38, doi: 10.3847/1538-4357/adba56
-
[38]
Massa, P., Schwartz, R., Tolbert, A. K., et al. 2020, ApJ, 894, 46, doi: 10.3847/1538-4357/ab8637
-
[39]
Massa, P., Battaglia, A. F., Volpara, A., et al. 2022, SoPh, 297, 93, doi: 10.1007/s11207-022-02029-x
-
[40]
1994, Nature, 371, 495, doi: 10.1038/371495a0
Masuda, S., Kosugi, T., Hara, H., Tsuneta, S., & Ogawara, Y. 1994, Nature, 371, 495, doi: 10.1038/371495a0
-
[41]
2025a, ApJ, 991, 77, doi: 10.3847/1538-4357/adfa20
Matsumoto, K., Inoue, S., Hayashi, K., et al. 2025a, ApJ, 991, 77, doi: 10.3847/1538-4357/adfa20
-
[42]
2025b, ApJ, 985, 20, doi: 10.3847/1538-4357/adcac2
Matsumoto, K., Inoue, S., Liu, N., et al. 2025b, ApJ, 985, 20, doi: 10.3847/1538-4357/adcac2
-
[43]
2026, ApJL, 998, L28, doi: 10.3847/2041-8213/ae4000 M¨ uller, D., St
Matsumoto, K., Inoue, S., Wang, M., et al. 2026, ApJL, 998, L28, doi: 10.3847/2041-8213/ae4000 M¨ uller, D., St. Cyr, O. C., Zouganelis, I., et al. 2020, A&A, 642, A1, doi: 10.1051/0004-6361/202038467
-
[44]
2026, ApJ, 997, 51, doi: 10.3847/1538-4357/ae2122
Roddanavar, A., Inoue, S., Hayashi, K., et al. 2026, ApJ, 997, 51, doi: 10.3847/1538-4357/ae2122
-
[45]
Ryan, D. F., Massa, P., Battaglia, A. F., et al. 2024a, SoPh, 299, 114, doi: 10.1007/s11207-024-02341-8
-
[46]
F., Laube, S., Nicula, B., et al
Ryan, D. F., Laube, S., Nicula, B., et al. 2024b, A&A, 681, A61, doi: 10.1051/0004-6361/202347212
-
[47]
1982, SoPh, 76, 301, doi: 10.1007/BF00170988
Sakurai, T. 1982, SoPh, 76, 301, doi: 10.1007/BF00170988
-
[48]
Scherrer, P. H., Schou, J., Bush, R. I., et al. 2012, SoPh, 275, 207, doi: 10.1007/s11207-011-9834-2
-
[49]
Z., Bajnokov´ a, N., & Krucker, S
Stiefel, M. Z., Bajnokov´ a, N., & Krucker, S. 2025a, arXiv e-prints, arXiv:2511.09108, doi: 10.48550/arXiv.2511.09108
-
[50]
Z., Kuhar, M., Limousin, O., et al
Stiefel, M. Z., Kuhar, M., Limousin, O., et al. 2025b, A&A, 694, A138, doi: 10.1051/0004-6361/202452574
-
[51]
Stiefel, M. Z., Battaglia, A. F., Barczynski, K., et al. 2023, A&A, 670, A89, doi: 10.1051/0004-6361/202245044
-
[52]
Sturrock, P. A. 1966, Nature, 211, 695, doi: 10.1038/211695a0
-
[53]
2012, Living Reviews in Solar Physics, 9, 5, doi: 10.12942/lrsp-2012-5
Wiegelmann, T., & Sakurai, T. 2012, Living Reviews in Solar Physics, 9, 5, doi: 10.12942/lrsp-2012-5
-
[54]
2022, ApJ, 940, 119, doi: 10.3847/1538-4357/ac9df4
Yamasaki, D., Inoue, S., Bamba, Y., Lee, J., & Wang, H. 2022, ApJ, 940, 119, doi: 10.3847/1538-4357/ac9df4
-
[55]
Yu, S., Chen, B., Reeves, K. K., et al. 2020, ApJ, 900, 17, doi: 10.3847/1538-4357/aba8a6
-
[56]
2019, Research in Astronomy and Astrophysics, 19, 160, doi: 10.1088/1674-4527/19/11/160
Zhang, Z., Chen, D.-Y., Wu, J., et al. 2019, Research in Astronomy and Astrophysics, 19, 160, doi: 10.1088/1674-4527/19/11/160
discussion (0)
Sign in with ORCID, Apple, or X to comment. Anyone can read and Pith papers without signing in.