REVIEW 3 major objections 6 minor 42 references
Simulation-based inference with neural posterior estimation applied to X-ray spectral fitting II -- High-resolution spectroscopy with the X-ray Integral Field Unit
T0 review · 3 major / 6 minor · reviewed 2026-08-07 · deepseek-v4-flash
Pith's one-line read Summary statistics make X-ray fitting 10 to 100 times faster
desk verdict Useful, mostly honest empirical comparison of summary statistics for high-resolution X-ray SBI, but the 'well-calibrated' claim outruns the evidence and needs a coverage test. read the letter →
The pith
A machine-rendered reading of the paper's core claim, the machinery that carries it, and where it could break.
The reading
What carries the argument
The central object is the hand-crafted summary-statistic vector: the total, mean, and standard deviation of the counts; counts in 50 logarithmically spaced energy bins; hardness ratios and differential ratios between adjacent bins; and, for line-rich models, count-weighted mean energies in four selected line complexes. This vector replaces the full 20k-to-24k channel spectrum before being passed to a neural posterior estimator built from masked autoregressive normalising flows. The compression does the main work: it reduces the mapping the flow must learn, removes redundant highly-correlated information, and lets the network interpolate instead of overfitting. Multi-round inference uses truncated proposals to concentrate simulations near the observation, while single-round inference builds an amortized network that answers many spectra at once.
What would settle it
Take a simulated X-IFU observation whose spectrum has a narrow line or a shape change in an energy band not represented by the 50 logarithmic bins or the four line complexes, and run the SBI pipeline with the paper's summary statistics. If the resulting posterior is offset from the true parameter or its credible intervals are systematically too narrow compared with nested sampling, the claim that hand-crafted summaries are sufficient would be refuted. A simpler version: repeat the two-plasma test with one line complex removed and check redshift and velocity calibration.
Extended reading notes
Core claim
The paper's central claim is that a high-resolution X-ray spectrum can be replaced by a small set of physically motivated summary statistics without losing the information needed for parameter inference, and that neural posterior estimation on those summaries matches exact nested-sampling results at a fraction of the cost. The authors demonstrate this on three regimes: a smooth Comptonised continuum, a relativistic reflection model, and a two-temperature plasma model with emission lines. In each case, the compressed summary vector, roughly one hundred numbers compared with tens of thousands of spectral channels, produces posteriors compatible with nested sampling, in the line-free cases with about 10 to 100 times less computation. The paper also finds that single-round amortized training, while expensive to build, can be reused to constrain many spectra and to map which parameters an observation can actually measure. Finally, they show that line information needs dedicated summary statistics: count-weighted mean energies in selected line complexes are necessary to recover redshift and velocity.
Load-bearing premise
The load-bearing premise is that the handful of hand-picked statistics preserves all the information the parameters can imprint on the spectrum; the paper's own result shows this is fragile, since redshift and velocity are badly recovered until dedicated line-complex statistics are added, and those statistics were chosen after examining the test problems.
Editorial extensions
If this is right
- Multi-round inference with about 25k simulated spectra matches nested-sampling posteriors for smooth models, replacing millions of response convolutions with a 10 to 100 times faster workflow.
- Single-round amortized inference, though trained on roughly 200k simulations, can be reused on many spectra and enables feasibility studies that map which parameters an observational setup can constrain.
- For models with emission lines, the summary statistics must include line-aware quantities such as count-weighted mean energies per line complex; otherwise redshift and velocity posteriors are biased and too broad.
- The surrogate posterior distributions are close to, but slightly wider than, the exact posteriors, and can be used to initialise or propose for exact methods to make those methods faster.
- Adding a background spectrum is straightforward in this likelihood-free setup, since a Poisson background realisation can be added during simulation without any marginalisation step.
- The surrogate posterior distributions are close to, but slightly wider than, the exact posteriors, and can be used to initialise or propose for exact methods to make those methods faster.
Reading between the lines
- Because the summary statistics were chosen after seeing the test models, the claimed efficiency is tied to those models; a parameter whose effect appears only in a part of the spectrum not covered by the summaries would likely be missed, as the paper itself shows for redshift and velocity before adding line-complex statistics.
- A natural extension is to apply the same recipe to other high-resolution instruments, or to replace hand-picked line complexes with data-driven summaries such as wavelet scattering transforms, which the authors mention as future work.
- At very high signal-to-noise the posterior volume shrinks and the amortized network's mapping degrades; restricting the training prior to the relevant count range, as the paper suggests, is a testable way to recover performance.
- The success of simple summaries suggests a general heuristic for likelihood-free inference on high-dimensional spectra: invest in domain-motivated compression before increasing network capacity.
Editorial analysis
A structured set of objections, weighed in public.
Referee Report
Summary. This manuscript extends the authors' earlier SBI-NPE work to high-resolution X-IFU spectroscopy. The central idea is to compress simulated spectra before feeding them to a normalizing-flow posterior estimator. Two compression schemes are compared: hand-crafted summary statistics (global count moments, counts in 50 logarithmically spaced bins, hardness and differential ratios, and weighted energies in selected line complexes) and learned embeddings with fully connected networks, with raw spectra as a baseline. The method is benchmarked against BXA nested sampling on three simulated spectral models (tbabs*(comptt+powerlaw), tbabs*relxillNS, and tbabs*(bapec+bapec)), using both multi-round and single-round inference, and an additional real-data application to an XMM-Newton spectrum is included in Appendix C. The main claims are that simple summary statistics are much more efficient than full spectra or learned embeddings, that multi-round inference converges quickly to results comparable to nested sampling, that single-round inference enables amortized feasibility studies, and that the method "delivers well calibrated posteriors."
Significance. If the central claims hold, this is a practically useful contribution for X-IFU science: a 10-100x speedup over nested sampling, an open implementation (the SIXSA fork bsixsa is publicly available), and a real-data validation are all positive features. The paper also gives a clear demonstration that emission-line information requires dedicated summary statistics, which is an important and honest finding. However, the strongest advertised conclusion, that SBI "delivers well calibrated posteriors," is not supported by the evidence presented. The kT example in Fig. 1 is a concrete case of overconfidence on an unidentifiable parameter, and no coverage or simulation-based calibration test is reported. The contribution is therefore significant but needs additional validation before the calibration claim can be accepted.
major comments (3)
- [Sec. 3.1, Fig. 1] The paper's own Fig. 1 shows that for tbabs*(comptt+powerlaw), BXA produces an essentially flat marginal for kT, while the MRI summary-statistics posterior is narrow. The authors attribute this to a known limitation of normalizing flows in expressing discontinuous distributions (Sec. 3.1). This is not a benign discrepancy: on an unidentifiable parameter, the surrogate posterior is overconfident, which is exactly the failure mode that the abstract's and Sec. 7's "well calibrated posteriors" claim must exclude. No coverage or simulation-based calibration check (e.g. simulation-based calibration) is reported anywhere. I request either a quantitative calibration/coverage analysis on all three models and all parameters, or a revised, more limited statement that does not claim calibrated posteriors. This is load-bearing because the main advertised benefit is replacing exact inference.
- [Sec. 5, Fig. D.3, Sec. 6.3] The summary statistics are not shown to be sufficient for the parameters of interest, and the paper itself admits in Sec. 6.3 that the choice of summaries is motivated a posteriori. Fig. D.3 demonstrates that without the line-complex weighted energies, redshift and velocity are poorly recovered. Thus the central performance claim is conditional on hand-picked statistics that were selected after seeing the benchmark problems. The active-subspace sensitivity analysis in Sec. 6.3 is interpretability, not a sufficiency or robustness check. To make the central claim defensible, please either demonstrate robustness on at least one model not used to design the summaries, or provide a principled procedure for constructing and validating summaries for new models.
- [Sec. 6.2, Fig. 7] Fig. 7 shows that the posterior log-probability distributions produced by SBI are systematically wider and lower than those from BXA, and Sec. 6.2 concedes that the surrogate distributions include parameter values worse than those obtained with exact techniques. Combined with Fig. 2, where the lower energy score of MRI with summary statistics is attributed to the artificially narrow kT distribution, the evidence does not support "posterior distributions comparable to those from exact computation" as a general statement. The comparison is based primarily on visual corner plots from a single simulated realization per model. Please report quantitative discrepancy measures (e.g. coverage across repeated simulations, maximum mean discrepancy, or proper scoring rules) and clarify what "comparable" means in the presence of the observed systematic broadening and the kT overconfidence.
minor comments (6)
- [Sec. 7] The first sentence contains a typo: "In tpaper,aper" should be "In this paper, we".
- [Sec. 5] The text contains typos: "suing" should be "using" and "sumarry statistics" should be "summary statistics".
- [Appendix C] The real-data validation uses an XMM-Newton EPIC-PN spectrum, not a high-resolution X-IFU spectrum; the text should state this caveat explicitly, since the paper's headline is high-resolution X-IFU performance.
- [Sec. 6.2, Acknowledgements] "cstatminimisation" should be "Cstat minimisation" in Sec. 6.2, and "scypi" should be "scipy" in the Acknowledgements.
- [Fig. 2] The numeric labels above the heatmap are not defined clearly; please state in the caption what the three values (0.23, 0.17, 0.38) refer to.
- [References] The Kaastra & Bleeker (2016) reference is malformed; the journal is Astronomy & Astrophysics, 587, A151.
Circularity Check
No significant circularity: the central performance claim is benchmarked against external exact inference (BXA) and real XMM-Newton data; self-citations and a-posteriori summary-statistic choices are not load-bearing in the derivation.
full rationale
The paper's derivation chain is anchored externally rather than to its own outputs. The claim that summary statistics yield posteriors comparable to exact computation is tested directly against BXA nested-sampling runs on the same simulated X-IFU observations (Sec. 3.1, Fig. 1; Sec. 4, Fig. 3; Sec. 5, Fig. D.2), and against a real XMM-Newton spectrum of NGC 7793 ULX-4 in Appendix C. These are independent references, not quantities constructed from the SBI posteriors. The line-complex weighted energies in Sec. 5 are fixed functions of the spectrum (mean energies weighted by counts), and the evidence for their benefit is an ablation (Fig. D.3) rather than a fitted parameter renamed as a prediction. The paper explicitly concedes in Sec. 6.3 that the summaries were 'motivate[d] a posteriori' and in Sec. 6.2 that the surrogate posteriors 'include parameter values that are worse than the one obtained using exact techniques'; these are in-sample-selection and calibration limitations, not circular reductions, because the summary statistics are not derived from the target parameters by construction and the mapping from summaries to parameters is learned from simulations. Self-citations to Paper I (Barret & Dupourqué 2024) supply the SIXSA codebase and prior low-resolution validation, but the high-resolution conclusions do not rest on any asserted theorem or ansatz from that paper. Finally, the abstract's 'well calibrated posteriors' claim is unsupported by a coverage test and is tensioned by the admitted normalising-flow smoothing of an unconstrained kT (Sec. 3.1); that is a correctness risk, which per the analysis rules is not counted as circularity. No quoted equation reduces one of the paper's predictions to its inputs by definition.
Assumptions & free parameters
free parameters (5)
- Number of coarse energy bins for sum statistics =
50
- Summary statistic set composition =
mean, sum, standard deviation, hardness ratios, differential ratios
- Line complex energy bands =
O VIII 0.62-0.66 keV; Fe XXIV+Ne X 0.97-1.2 keV; Fe XXIV+Mg XII 1.4-1.55 keV; Fe XXV 6.4-6.65 keV
- Number of rounds and simulations =
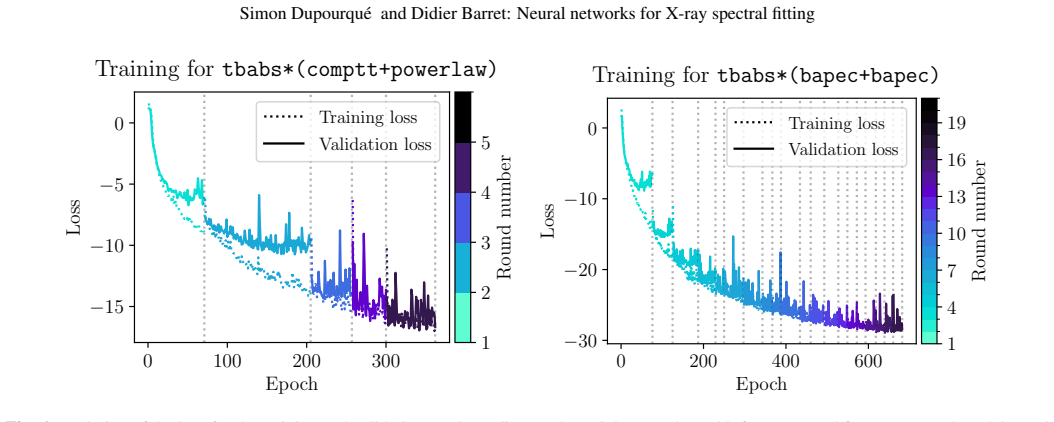
5 rounds x 5k (comptt), 20 rounds x 10k (bapec), 200k (SRI)
- MAF architecture =
10 transforms, 100 hidden units
assumptions (5)
- domain assumption XSPEC spectral models (comptt, relxillNS, bapec) provide an accurate description of the physical emission and of X-IFU observations.
- domain assumption The Poisson realization of model-predicted counts is sufficient to reproduce the measurement distribution, making SBI asymptotically equivalent to Cstat inference.
- ad hoc to paper The chosen summary statistics are approximately sufficient statistics for the parameters of interest.
- ad hoc to paper The neural density estimator (MAF) converges to a reliable approximation of the posterior.
- standard math Standard probability theory and normalizing-flow properties as described in the cited literature.
Cite this review
Pith. "Pith review of Simulation-based inference with neural posterior estimation applied to X-ray spectral fitting II -- High-resolution spectroscopy with the X-ray Integral Field Unit." pith.science (2026). https://pith.science/paper/5K6EBWA6
@misc{pith2026250605911,
  author       = {Pith},
  title        = {Pith review of: Simulation-based inference with neural posterior estimation applied to X-ray spectral fitting II -- High-resolution spectroscopy with the X-ray Integral Field Unit},
  year         = {2026},
  howpublished = {\url{https://pith.science/paper/5K6EBWA6}},
  note         = {Machine review of arXiv:2506.05911}
}
read the original abstract
X-ray spectral fitting in high-energy astrophysics can be reliably accelerated using Machine Learning. In particular, Simulation-based Inference (SBI) produces accurate posterior distributions in the Gaussian and Poisson regime for low-resolution spectra, much faster than other exact approaches such as Monte Carlo Markov Chains or Nested Sampling. We now aim to highlight the capabilities of SBI for high-resolution spectra, as what will be provided by the newAthena X-ray Integral Field Unit (X-IFU). The large number of channels encourages us to use compressed representations of the spectra, taking advantage of the likelihood-free inference aspect of SBI. Two compression schemes are explored, using either simple summary statistics, such as the counts in arbitrary bins or ratios between these bins. We benchmark the efficiency of these approaches using simulated X-IFU spectra with various spectral models, including smooth comptonised spectra, relativistic reflexion models and plasma emission models. We find that using simple and meaningful summary statistics is much more efficient than working directly with the full spectrum, and can derive posterior distributions comparable to those from exact computation using nested sampling. Multi-round inference converges quickly to the good solution. Amortized single round inference requires more simulations, hence longer training time, but can be used to infer model parameters from many observations afterwards. Information from the emission lines must be accounted for using dedicated summary statistics. SBI for X-ray spectral fitting is a robust technique that delivers well calibrated posteriors. This approach shows great promises for high-resolution spectra, offering its potential for the scientific exploitation of the X-IFU. We now plan to apply it to the current era of high-resolution telescopes, and further challenge this approach with real data.
Figures


Figures from the paper (5 more)




Reference graph
Works this paper leans on
-
[1]
Abadi, M., Agarwal, A., Barham, P., et al. 2015, TensorFlow: Large-Scale Ma- chine Learning on Heterogeneous Systems, software available from tensor- Article number, page 10 of 16 Simon Dupourqué and Didier Barret: Neural networks for X-ray spectral fitting flow.org
work page 2015
-
[2]
2020, Journal of Machine Learn- ing Research, 21, 1
Andreux, M., Angles, T., Exarchakis, G., et al. 2020, Journal of Machine Learn- ing Research, 21, 1
work page 2020
-
[3]
Arnaud, K. A. 1996, in Astronomical Society of the Pacific Conference Series, V ol. 101, Astronomical Data Analysis Software and Systems V , ed. G. H. Jacoby & J. Barnes, 17
1996
-
[4]
Ayesha, S., Hanif, M. K., & Talib, R. 2020, Information Fusion, 59, 44
work page 2020
- [5]
- [6]
- [7]
-
[8]
Betancourt, M. J. & Girolami, M. 2013, Hamiltonian Monte Carlo for Hierarchi- cal Models
work page 2013
Show all 42 references
-
[9]
& Gallo, L
Bonson, K. & Gallo, L. C. 2016, MNRAS, 458, 1927
2016
-
[10]
& Boorman, P
Buchner, J. & Boorman, P. 2024, Statistical Aspects of X-ray Spectral Analy- sis, ed. C. Bambi & A. Santangelo (Singapore: Springer Nature Singapore), 5403–5451
2024
-
[11]
2014, A&A, 564, A125
Buchner, J., Georgakakis, A., Nandra, K., et al. 2014, A&A, 564, A125
2014
-
[12]
A., Steiner, J
Choudhury, K., Garcia, J. A., Steiner, J. F., & Bambi, C. 2017, ApJ, 851, 57, arXiv:1711.02416 [astro-ph]
2017 arXiv
-
[13]
G., Dow, E., & Wang, Q
Constantine, P. G., Dow, E., & Wang, Q. 2014, SIAM Journal on Scientific Com- puting, 36, A1500
2014
-
[14]
2025, Nature Astronomy, 9, 36 de Plaa, J., Kaastra, J
Cruise, M., Guainazzi, M., Aird, J., et al. 2025, Nature Astronomy, 9, 36 de Plaa, J., Kaastra, J. S., Gu, L., Mao, J., & Raassen, T. 2019, SPEX: High- Resolution Spectral Modeling and Fitting for X-ray Astronomy
2025
-
[15]
H., & Gonçalves, P
Deistler, M., Macke, J. H., & Gonçalves, P. J. 2022, Proceedings of the National Academy of Sciences, 119, e2207632119 Dupourqué, S., Barret, D., Diez, C. M., Guillot, S., & Quintin, E. 2024, A&A, 690, A317 García, J. A., Dauser, T., Ludlam, R., et al. 2022, ApJ, 926, 13
2022
-
[16]
& Raftery, A
Gneiting, T. & Raftery, A. E. 2007, Journal of the American Statistical Associa- tion, 102, 359
2007
-
[17]
S., Nonnenmacher, M., & Macke, J
Greenberg, D. S., Nonnenmacher, M., & Macke, J. H. 2019, Automatic Posterior Transformation for Likelihood-Free Inference
2019
-
[18]
R., Millman, K
Harris, C. R., Millman, K. J., van der Walt, S. J., et al. 2020, Nature, 585, 357
2020
-
[19]
Hastings, W. K. 1970, Biometrika, 57, 97
1970
-
[20]
2015, Deep Residual Learning for Image Recognition
He, K., Zhang, X., Ren, S., & Sun, J. 2015, Deep Residual Learning for Image Recognition
2015
-
[21]
Hinton, S. R. 2016, The Journal of Open Source Software, 1, 00045
2016
-
[22]
Houck, J. C. & Denicola, L. A. 2000, in Astronomical Society of the Pacific Con- ference Series, V ol. 216, Astronomical Data Analysis Software and Systems IX, ed. N. Manset, C. Veillet, & D. Crabtree, 591
2000
-
[23]
Hunter, J. D. 2007, Computing in science & engineering, 9, 90
2007
-
[24]
2018, MNRAS, 475, 4739 Kaastra & Bleeker
Ichinohe, Y ., Yamada, S., Miyazaki, N., & Saito, S. 2018, MNRAS, 475, 4739 Kaastra & Bleeker. 2016, antike und abendland, 587, A151
2018
-
[25]
Kingma, D. P. & Ba, J. 2017, Adam: A Method for Stochastic Optimization
2017
-
[26]
2010, in Proceedings of the 9th Python in Science Conference, ed
McKinney, W. 2010, in Proceedings of the 9th Python in Science Conference, ed. S. van der Walt & J. Millman, 51 – 56
2010
-
[27]
2013, arXiv e-prints, arXiv:1306.2307
Nandra, K., Barret, D., Barcons, X., et al. 2013, arXiv e-prints, arXiv:1306.2307
2013 arXiv
-
[28]
2017, in Advances in Neural Infor- mation Processing Systems, V ol
Papamakarios, G., Pavlakou, T., & Murray, I. 2017, in Advances in Neural Infor- mation Processing Systems, V ol. 30 (Curran Associates, Inc.)
2017
-
[29]
L., Lieu, M., & Matzeu, G
Parker, M. L., Lieu, M., & Matzeu, G. A. 2022, MNRAS, 514, 4061
2022
-
[30]
2017, in NIPS AutodiffWorkshop
Paszke, A., Gross, S., Chintala, S., et al. 2017, in NIPS AutodiffWorkshop
2017
-
[31]
2011, Journal of Machine Learning Research, 12, 2825
Pedregosa, F., Varoquaux, G., Gramfort, A., et al. 2011, Journal of Machine Learning Research, 12, 2825
2011
-
[32]
2025, Experimental Astronomy, 59, 18
Peille, P., Barret, D., Cucchetti, E., et al. 2025, Experimental Astronomy, 59, 18
2025
-
[33]
A., Gúrpide, A., Bachetti, M., & Fürst, F
Quintin, E., Webb, N. A., Gúrpide, A., Bachetti, M., & Fürst, F. 2021, MNRAS, 503, 5485
2021
-
[34]
Rezende, D. J. & Mohamed, S. 2016, Variational Inference with Normalizing Flows, arXiv:1505.05770 [stat]
2016 arXiv
-
[35]
M., et al
Siemiginowska, A., Burke, D., Günther, H. M., et al. 2024, ApJ Supplement Series, 274, 43, publisher: The American Astronomical Society
2024
-
[36]
2006, Bayesian Analysis, 1, 833
Skilling, J. 2006, Bayesian Analysis, 1, 833
2006
-
[37]
K., Brickhouse, N
Smith, R. K., Brickhouse, N. S., Liedahl, D. A., & Raymond, J. C. 2001, ApJ, 556, L91, arXiv: astro-ph/0106478
2001 arXiv
-
[38]
2020, The Journal of Open Source Software, 5, 2505
Tejero-Cantero, A., Boelts, J., Deistler, M., et al. 2020, The Journal of Open Source Software, 5, 2505
2020
-
[39]
1994, ApJ, 434, 570
Titarchuk, L. 1994, ApJ, 434, 570
1994
-
[40]
2025, X-ray spectral fitting with Monte Carlo Dropout Neural Networks
Tutone, A., Anitra, A., Ambrosi, E., et al. 2025, X-ray spectral fitting with Monte Carlo Dropout Neural Networks
2025
-
[41]
E., et al
Virtanen, P., Gommers, R., Oliphant, T. E., et al. 2020, Nature Methods XRISM Science Team. 2020, Science with the X-ray Imaging and Spectroscopy Mission (XRISM)
2020
-
[42]
& Allen, S
Zanetta, F. & Allen, S. 2024, Scoringrules: a python library for probabilistic forecast evaluation Article number, page 11 of 16 A&A proofs:manuscript no. aa55215-25 Appendix A: Including the background Including a background spectrum in the inference using SBI is straightforw...
2024
Reviewed August 7, 2026 · model on record in the stance chip above.
Discussion (0). Sign in to comment.