REVIEW 4 major objections 6 minor 36 references
Theoretical model for the Seebeck coefficient in superlattice materials with energy relaxation
T0 review · 4 major / 6 minor · reviewed 2026-08-14 · deepseek-v4-flash
Pith's one-line read A superlattice's Seebeck coefficient is fixed by the two bulk Seebeck values and one energy relaxation length, via Eq. (16), which tracks quantum transport and experiment.
desk verdict A compact Seebeck formula for superlattices that works well in calibration against NEGF, but whose predictive power is unproven because the key parameter λE is extracted from the same simulations it is then tested against. read the letter →
The pith
A machine-rendered reading of the paper's core claim, the machinery that carries it, and where it could break.
The reading
What carries the argument
The load-bearing object is the exponential-decay ansatz for the average energy of the current flow, $\langle E(x)\rangle$: within each well the average energy decays from the barrier value $\langle E\rangle_B$ toward the equilibrium well value $\langle E\rangle_W$ on the length scale $\lambda_E$, obeying the second-order differential equation (A2) whose solution (11) meets the boundary conditions at both barriers and the large-well equilibrium limit. The energy relaxation length $\lambda_E$ is the third parameter; the paper does not derive it from first principles but extracts it by fitting the single-barrier profile (A5) to quantum transport data, or assigns it by hand in the experimental comparison. This ansatz is what converts electron-optical-phonon scattering from a complex quantum-kinetic process into a one-parameter spatial interpolation, and it is the reason the final formula needs only $S_B$, $S_W$, and $\lambda_E$.
What would settle it
Choose a fixed material pair, extract $\lambda_E$ from the average-energy profile of a single-barrier channel, then compute $S_{\rm sys}$ from Eq. (16) for a multi-barrier superlattice of the same materials as a function of well width $d$ spanning about $0.1\lambda_E$ to $10\lambda_E$; run the corresponding quantum transport simulation (or measure $S$ on a series of samples with those well widths). If the predicted $S(d)$ curve misses the simulation or measurement by more than the claimed few percent, or if the value of $\lambda_E$ needed to fit the $S(d)$ data differs systematically from the single-barrier value, the single-relaxation-length closure is disproved.
Extended reading notes
Core claim
On the paper's own terms, the central result is that the local Seebeck profile in a superlattice is an exponentially relaxing interpolation rather than an abrupt switch. Using $S(x)=(\langle E(x)\rangle - E_F)/(qT)$, the paper writes the spatially varying average energy of the current flow as a constant on top of each barrier and an exponential decay into each well with decay length $\lambda_E$. Integrating this profile gives Eq. (16): $S_{\rm sys}$ is a weighted combination of $S_B$, $S_W$, and a relaxed well value $S_{W,\rm relax}=S_W+(S_B-S_W)(2\lambda_E/d)[1-e^{-d/\lambda_E}(1+d/2\lambda_E)]$, with the limits $S_{W,\rm relax}\to S_W$ as $\lambda_E\to 0$ and $S_{W,\rm relax}\to S_B$ when $\lambda_E\gg d$. The paper validates this expression against quantum transport simulations for $S$ as a function of well size $d$, electron-phonon coupling strength $D_0$, and optical-phonon energy $\hbar\omega$, at two Fermi-level positions, finding agreement within roughly 1-5%, and against measured data for ErAs:InGaAs/InGaAlAs superlattices. Without the relaxation term the model no longer follows the simulations, which is the paper's evidence that energy relaxation is the missing physics in simpler weighted-average formulas.
Load-bearing premise
The load-bearing premise is that inside every well the average energy of the current relaxes toward the well's equilibrium value as a single exponential with one energy relaxation length $\lambda_E$, and that this $\lambda_E$ is a fixed material property independent of well size, neighboring barriers, and the way it was extracted.
Editorial extensions
If this is right
- With $S_B$, $S_W$, and $\lambda_E$ known, the Seebeck coefficient of any barrier/well geometry follows from Eq. (16) without full quantum transport simulations.
- Because $S_{W,\rm relax}$ approaches $S_B$ when $\lambda_E\gg d$, a well only a few relaxation lengths wide retains a significant part of the barrier's high Seebeck value, which the paper links to the power-factor enhancements observed in energy-filtered nanostructures.
- The variation of $S$ with well size $d$ saturates once $d$ is much larger than $\lambda_E$, so experiments on grain or period sizes should show a plateau on the scale of $\lambda_E$ if energy relaxation is the controlling physics.
- The model's accuracy when $D_0$ and $\hbar\omega$ are varied means optical-phonon coupling and phonon energy act as design levers for the Seebeck coefficient, not just fixed material constants.
Reading between the lines
- A direct test of the model's predictive power would be to extract $\lambda_E$ from a single-barrier thermopower measurement and then predict $S(d)$ for a multilayer stack of the same material pair; the model is falsifiable if that prediction fails even when the transport simulation agrees with the fit.
- The same exponential-interpolation idea could be extended to other energy-dependent transport coefficients, but the paper notes conductance has no direct map to $\langle E(x)\rangle$; a two-parameter version that also includes momentum relaxation would be the natural next step.
- Because $\lambda_E$ is treated as a geometry-independent material property, the model implicitly assumes optical-phonon scattering dominates energy relaxation; in doping regimes where ionized-impurity or acoustic-phonon scattering dominates, $\lambda_E$ would depend on doping and the three-parameter closure would need a doping-dependent input.
- The experimental comparison works with a hand-assigned $\lambda_E=30$ nm for InGaAs, suggesting that order-of-magnitude estimates of relaxation lengths from mobility data may be sufficient for screening material combinations with this formula.
Signed reviews
Editorial analysis
A structured set of objections, weighed in public.
Referee Report
Summary. The manuscript develops an analytical model for the Seebeck coefficient of semiconductor superlattice and nanocomposite structures, explicitly accounting for carrier energy relaxation due to electron-optical-phonon scattering. Starting from the local relation S(x)=(<E(x)>-E_F)/qT, the authors assume that the average energy of the current flow is constant across barriers and relaxes exponentially in wells with a single energy relaxation length λE, leading to the closed-form expression Eq. (16) involving only the bulk Seebeck coefficients S_B and S_W plus λE, together with geometric and thermal-conductivity factors. The model is compared with one-dimensional NEGF simulations as the well size d, the electron-phonon coupling strength D0, the optical phonon energy ℏω, and the Fermi-level position are varied, and with an experimental superlattice Seebeck-coefficient dataset. The paper reports agreement to within a few percent and concludes that the model can guide the design of thermoelectric nanostructures.
Significance. If the claimed predictive power were established, the model would be a useful compact design tool for thermoelectric superlattices and nanocomposites, going beyond simple weighted-average formulas by including energy-relaxation physics. The algebraic derivation from the exponential ansatz to Eq. (16) is straightforward, and the limiting cases in Eq. (13) (λE→0 giving S_W and λE≫d giving S_B) are correctly stated. The paper also clearly discloses its assumptions in Appendix A and provides comparisons against both NEGF simulations and an experiment. However, the central validation strategy is largely self-consistency: the model inputs λE, S_B, and S_W are extracted from the same NEGF simulations that produce the Seebeck-coefficient curves with which the model is compared. The independent predictive content of the model is therefore not demonstrated, and the experimental comparison relies on a hand-chosen λE with acknowledged large uncertainties.
major comments (4)
- [Section III, Figs. 3-5] The validation of the model against NEGF is not independent. For each value of D0 and ℏω, the energy relaxation length λE is obtained by fitting Eq. (A5) to the NEGF-computed <E(x)> from the same simulation that yields S_NEGF; since S_NEGF is computed by integrating <E(x)> according to Eqs. (4)-(6), the reported 1-3% agreement largely tests the internal consistency of the integral mapping rather than the predictive power of the exponential-decay ansatz. Even the d-sweep in Fig. 3(b), which uses a fixed λE, takes S_B, S_W, and λE all from NEGF on the same barrier/well system. A truly predictive test would require determining λE (and, where possible, S_B and S_W) from independent bulk simulations, analytical estimates, or experiments, and then using those values in Eq. (16) without refitting.
- [Section IV, Fig. 9] The experimental comparison does not establish λE as a transferable material parameter. The value λE = 30 nm is chosen by hand, with the text stating only that it is selected 'to reflect the higher mobility of InGaAs compared to Si,' and the paper immediately concedes 'large uncertainties' in the evaluation. No error bars, sensitivity analysis with respect to λE, or systematic variation of the scattering exponent r is provided. This comparison should be presented as a plausibility check rather than validation, or it should be supplemented with a sensitivity analysis showing how robust the predicted S is to the assumed λE and r.
- [Eq. (16), Section IIB] The claim that the total Seebeck coefficient is determined by only three material parameters, S_B, S_W, and λE, is not accurate in general because Eq. (16) explicitly contains the thermal conductivities κB and κW in both numerator and denominator. All NEGF validations in this work set κB = κW, which removes this dependence, but for an arbitrary superlattice κB/κW is an additional input. The parameter count and the scope of the three-parameter claim should be revised to state that the reduction holds only in the equal-thermal-conductivity case or that κB/κW is an additional required parameter.
- [Appendix A, Eq. (A2)] The exponential-relaxation form is an assumption, not a derived result. The differential equation (A2) is constructed precisely so that its solution (A3) satisfies the chosen boundary conditions and the large-d limit, with no microscopic derivation from the electron-phonon scattering kinetics. Consequently, λE functions as an empirical fitting parameter in this work. The model would be considerably strengthened by a derivation of the exponential decay from a scattering-rate model, or at least by a demonstration that the extracted λE values agree with independent estimates based on energy-relaxation times for the relevant materials.
minor comments (6)
- [Eqs. (2)-(3)] The notation for the total well length is inconsistent: Eq. (2) uses \(\tilde L_W\) as \(L_W + L'_W\), but the text below Eq. (3) redefines \(\tilde L_W = L_W + L'_W\) after having used \(L_W + L'_W\) in Eq. (2). Please unify the notation throughout.
- [Section IIIA, Fig. 3(b)] The sentence 'd increases by removing barriers sequentially one at a time while keeping L fixed' should explicitly state how the number of barriers n and the total barrier thickness L_B change for each data point in Eq. (16), since these quantities enter the formula directly.
- [Fig. 9 caption] There is a typo: 'blue-dahed' should be 'blue-dashed'.
- [Section IV, Eq. (21)] The scattering exponent r is set to 1/2, but the paper does not provide a sensitivity analysis for this choice. Given that the text acknowledges that other exponents could give a slightly better fit, a brief statement of how sensitive the final S values are to r would strengthen the comparison.
- [Eq. (4) and Figs. 3-5] The sign convention for the Seebeck coefficient should be clarified. With q = -|e| for electrons, Eq. (4) gives negative S, yet all figures show positive values. Please state explicitly whether the plotted quantity is |S| or the sign is reversed by convention.
- [Section V and Abstract] The abstract and conclusions state that the model is valid for nanocomposite materials, but the derivation assumes a periodic 1D superlattice with fixed barrier spacing and well size. The later qualification that the nanocomposite extension is only a first-order estimate should be reflected in the abstract and conclusions, where the statement currently appears stronger.
Circularity Check
Two of the three NEGF validation sweeps (D0, ℏω) refit λE point-by-point from the same NEGF ⟨E(x)⟩ that defines SNEGF, making those matches largely tautological; only the d-sweep uses a fixed λE.
-
fitted input called prediction
[Sec. III B, 'S vs D0' (Fig. 4)]
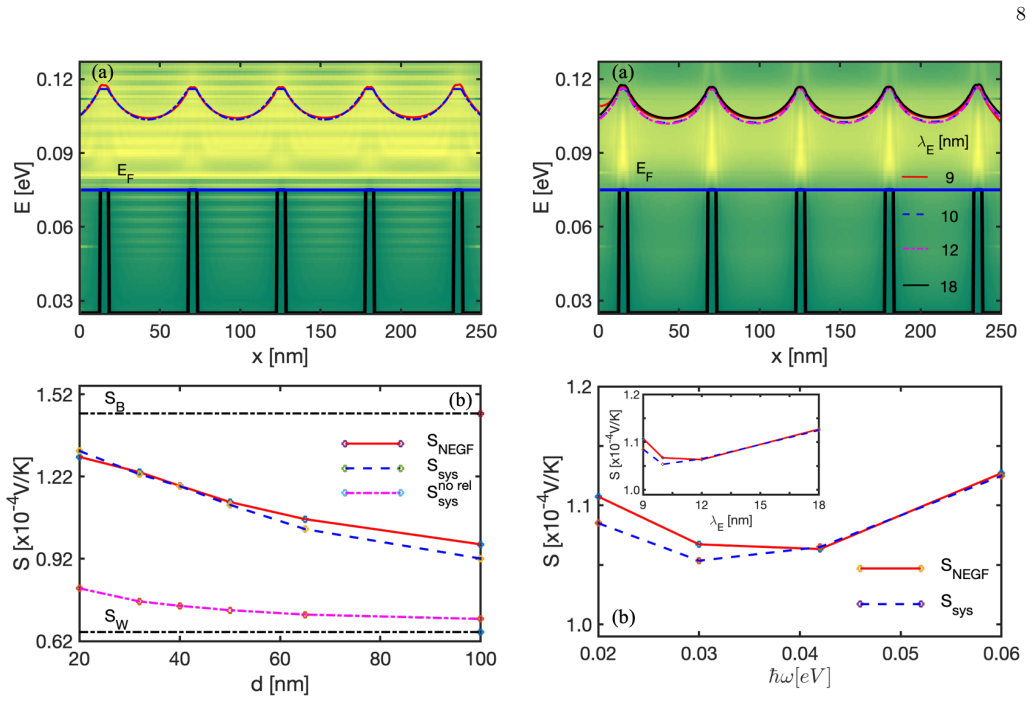
"Since the energy relaxation length λE decreases as D0 increases, for each value of D0 separately we made fitting of Eq. (A5) to the NEGF⟨E(x)⟩ as in Fig. 2(a) and extracted the corresponding values of λE."
SNEGF is computed from the NEGF simulation by integrating ⟨E(x)⟩ (Eqs. 4–6). Here λE is fitted to that very same NEGF ⟨E(x)⟩ for each D0 value, and SW is also redetermined per D0. Inserting these extracted values into Eq. (16) then reproduces SNEGF. The D0 dependence of the 'prediction' enters only through the refitted λE and SW; the model supplies no λE(D0) relation. The close agreement in Fig. 4(b) therefore tests the internal consistency of the exponential-integral mapping, not a predictive model of S vs D0.
-
fitted input called prediction
[Sec. III C, 'S vs ℏω' (Fig. 5)]
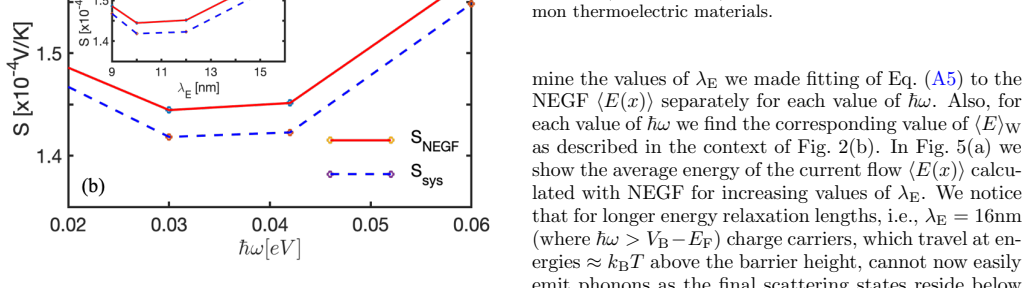
"In order to determine the values of λE we made fitting of Eq. (A5) to the NEGF⟨E(x)⟩ separately for each value of ℏω."
The same pointwise refitting procedure is applied: for each ℏω, λE is extracted from the NEGF ⟨E(x)⟩ whose energy integral defines SNEGF (Eqs. 4–6), and SW is also redetermined per ℏω. The claimed 1–2% agreement in Fig. 5(b) is therefore substantially guaranteed by construction. No functional relation λE(ℏω) is predicted or independently supplied, so the sweep validates the curve-fitting procedure rather than a predictive model of the phonon-energy dependence.
full rationale
The score is 6 because the paper's two most dramatic validation claims—S vs D0 (Fig. 4) and S vs ℏω (Fig. 5)—reduce by construction: for every data point, λE is fitted to the NEGF ⟨E(x)⟩, and SNEGF is computed from that same ⟨E(x)⟩ via Eqs. (4)–(6), with SW also refitted. Thus the agreement in those sweeps is largely tautological. Some independent content remains: the d-sweep in Fig. 3 uses a single λE (extracted once for the baseline parameters) and does test the exponential decay functional form against NEGF, and the experimental comparison (Sec. IV) tests the model against external data, although λE=30 nm is chosen by hand without sensitivity analysis. Even the d-sweep uses SB, SW, and λE all extracted from the same NEGF system, so transferability to truly unseen materials or geometries is unproven. Overall, the central prediction of a three-parameter model is partially circular because the key parameter λE is never predicted from first principles or independently measured.
Assumptions & free parameters
free parameters (4)
- Energy relaxation length λE =
16.5 nm (EF=VB-kBT), 17.5 nm (EF=VB), 30 nm (experiment)
- Barrier Seebeck coefficient SB =
2.06e-4 V/K (EF=0.05 eV); 1.4e-4 V/K (EF=VB); BTE estimate in Sec. IV
- Well Seebeck coefficient SW =
0.833e-4 V/K (EF=0.05 eV); 0.7e-4 V/K (EF=VB); BTE estimate in Sec. IV
- Scattering exponent r (experiment only) =
r = 1/2
assumptions (5)
- domain assumption Local Seebeck coefficient is S(x) = (⟨E(x)⟩ - EF)/(qT) (Eq. 4).
- domain assumption Lattice temperature equals carrier temperature, TL = T (Sec. II A).
- ad hoc to paper ⟨E(x)⟩ is constant on barriers (Eq. A1) and decays exponentially in wells as the solution of Eq. (A2).
- domain assumption Carriers are fully relaxed in barrier regions, so ⟨E⟩B is constant (beginning of Sec. II B).
- domain assumption NEGF simulations with only optical phonon scattering (described by D0 and ℏω) are the reference truth for validation.
Cite this review
Pith. "Pith review of Theoretical model for the Seebeck coefficient in superlattice materials with energy relaxation." pith.science (2026). https://pith.science/paper/5KZIDFRQ
@misc{pith2026190801090,
  author       = {Pith},
  title        = {Pith review of: Theoretical model for the Seebeck coefficient in superlattice materials with energy relaxation},
  year         = {2026},
  howpublished = {\url{https://pith.science/paper/5KZIDFRQ}},
  note         = {Machine review of arXiv:1908.01090}
}
read the original abstract
We present an analytical model for the Seebeck coefficient S of superlattice materials that explicitly takes into account the energy relaxation due to electron-optical phonon (e-ph) scattering. In such materials, the Seebeck coefficient is not only determined by the bulk Seebeck values of the materials but, in addition, is dependent on the energy relaxation process of charge carriers as they propagate from the less-conductive barrier region into the more-conductive well region. We calculate S as a function of the well size d, where carrier energy becomes increasingly relaxed within the well for d greater than l, where l is the energy relaxation length. We validate the model against more advanced quantum transport simulations based on the nonequilibrium Green function (NEGF) method and also with an experiment, and we find very good agreement. In the case in which no energy relaxation is taken into account, the results deviate substantially from the NEGF results. The model also yields accurate results with only a small deviation (up to ~3%) when varying the optical phonon energy hw or the e-ph coupling strength D0, physical parameters that would determine l. As a first order approximation, the model is valid for nanocomposite materials, and it could prove useful in the identification of material combinations and in the estimation of ideal sizes in the design of nanoengineered thermoelectric materials with enhanced power factor performance.
Figures


Figures from the paper (4 more)


Reference graph
Works this paper leans on
-
[1]
G. Ding, G. Y. Gao, Z. Huang, W. Zhang and K. Yao, Nanotechnology 27, 375703 (2016)
work page 2016
-
[2]
Huang, Y
H. Huang, Y. Cui, Q. Li, C. Dun, W. Zhou, W. Huang, L. Chen, C. A. Hewitt, and D. L. Carroll, Nano Energy 26, 172 (2016)
2016
- [3]
- [4]
-
[5]
C. Fu, S. Bai, Y. Liu, Y. Tang, L. Chen, X. Zhao, and T. Zhu, Nat. Commun. 6, 8144 (2015)
work page 2015
-
[6]
L.-D. Zhao, S.-H. Lo, Y. Zhang, H. Sun, G. Tan, C. Uher, C. Wolverton, V. P. Dravid, and M. G. Kanatzidis, Na- ture (London) 508, 373 (201)
-
[7]
D. Beretta, N. Neophytou, J. M. Hodges, M. G. Kanatzidis, D. Narducci, M. M.- Gonzalez, M. Beekman, B. Balke, G. Cerrettii, W. Tremel et al., ”Thermoelectrics: From history, a window to the future,” Mater. Sci. Eng. R Rep. (to be published)
- [8]
Show all 36 references
-
[9]
Thesberg, M
M. Thesberg, M. Pourfath, H. Kosina, and N. Neophy- tou, J. Appl. Phys. 118, 224301 (2015)
2015
-
[10]
Thesberg, H
M. Thesberg, H. Kosina, and N. Neophytou, J. Appl. Phys. 120, 234302 (2016)
2016
-
[11]
Y. M. Zhou and L.-D. Zhao, Adv. Mater. 29, 1702676 (2017)
2017
-
[12]
Priyadarshi, A
P. Priyadarshi, A. Sharma, S. Mukherjee, and B. Mu- ralidharan, J. Phys. D: Appl. Phys. 51, 185301 (2018)
2018
-
[13]
Venkatasubramanian, T
R. Venkatasubramanian, T. Colpitts, E. Watko, and J. Hutchby, in Proceedings IEEE 15th International Con- ference on Thermoelectrics (IEEE Service Centre, 1996)
1996
-
[14]
Ishida, T
A. Ishida, T. Yamada, D. Cao, Y. Inoue, M. Veis, and T. Kita, J. Appl. Phys. 106, 023718 (2009)
2009
-
[15]
G. Zeng, J. M. O. Zide, W. Kim, J. E. Bowers, A. C. Gos- sard, Z. Bian, Y. Zhang, A. Shakouri, S. L. Singer, and A. Majumdar, J. Appl. Phys. 101, 034502 (2007)
2007
-
[16]
Z. Bian, M. Zebarjadi, R. Singh, Y. Ezzahri, A. Shakouri, G. Zeng, J.-H. Bahk, J. E. Bowers, J. M. O. Zide, and A. C. Gossard, Phys. Rev. B 76, 205311 (2007)
2007
-
[17]
Neophytou, X
N. Neophytou, X. Zianni, H. Kosina, S. Frabboni, B. Lorenzi, and D. Narducci, Nanotechnology 24, 205402 (2013)
2013
-
[18]
The relaxation length is again extracted graphically by fitting Eq
that this is the optimal case for PF improvement if relaxation is suppressed. The relaxation length is again extracted graphically by fitting Eq. (A5) on the NEGF simulation result, which now yieldsλE = 17.5nm. Also, in the same manner as in the previous case, we find ⟨E⟩B = 0.1...
2020
-
[19]
Vargiamidis and N
V. Vargiamidis and N. Neophytou, Phys. Rev. B 99, 045405 (2019)
2019
-
[20]
Neophytou and H
N. Neophytou and H. Kosina, J. Appl. Phys. 114, 044315 (2013)
2013
-
[21]
Popescu, L
A. Popescu, L. Woods, J. Martin, and G. Nolas, Phys. Rev. B 79, 205302 (2009)
2009
-
[22]
C. Bera, M. Soulier, C. Navone, G. Roux, J. Simon, S. Volt, and N. Mingo, J. Appl. Phys.108, 124306 (2010)
2010
-
[23]
Bartkowiak, G
M. Bartkowiak, G. D. Mahan, and M. T. Terry, in Semi- conductors and Semimetals (Elsevier, 2001), Vol. 70, pp. 245-271
2001
-
[24]
S. O. Koswatta, S. Hasan, M. S. Lundstrom, M. P. Anantram, and D. E. Nikonov, IEEE Trans. Elec- tron Devices 54, 2339 (2007)
2007
-
[25]
M. P. Anantram, M. Lundstrom, and D. Nikonov, Proc. IEEE 96, 1511 (2008)
2008
-
[26]
Kim and M
R. Kim and M. Lundstrom, J. Appl. Phys. 110, 034511 (2011)
2011
-
[27]
Zianni and D
X. Zianni and D. Narducci, J. Appl. Phys. 117, 035102 (2015)
2015
-
[28]
Lundstrom, Fundamentals of Carrier Transport , Cambridge, UK: Cambridge Univ
M. Lundstrom, Fundamentals of Carrier Transport , Cambridge, UK: Cambridge Univ. Press, 2000
2000
-
[29]
Gonzalez, V
B. Gonzalez, V. Palankovski, H. Kosina, A. Hernandez, and S. Selberherr, Solid-State Electron. 43, 1791 (1999)
1999
-
[30]
Kim and M
R. Kim and M. Lundstrom, J. Appl. Phys. 111, 024508 (2012)
2012
-
[31]
Moyzhes and V
B. Moyzhes and V. Nemchinsky, Appl. Phys. Lett. 73, 1895 (1998)
1998
-
[32]
Neophytou, X
N. Neophytou, X. Zianni, H. Kosina, S. Frabboni, B. Lorenzi, and D. Narducci, J. Elec. Mater. 43, 1896 (2014)
2014
-
[33]
Thesberg, H
M. Thesberg, H. Kosina, and N. Neophytou, Phys. Rev. B 95, 125206 (2017). 12
2017
-
[34]
In experimental settings, one extracts the Seebeck coef- ficient from the open circuit voltage upon the applica- tion of a thermal gradient along the channel, as S = ∆V/∆T , which equivalently can also be computed by S =I(∆V =0)/G∆T . In [25], it was validated that the two meth...
-
[35]
J. Mao, J. Shuai, S. Song, Y. Wu, R. Dally, J. Zhou, Z. Liu, J. Sun, Q. Zhang, C. dela Cruz, S. Wilson, Y. Pei, D. J. Singh, G. Chen, C.-W. Chu, and Z. Ren, PNAS 114, 40, 10548 (2017)
2017
-
[36]
Thesberg, M
M. Thesberg, M. Pourfath, N. Neophytou and H. Kosina, J. Electron. Mater. 45, 1584 (2016)
2016
Reviewed August 14, 2026 · model on record in the stance chip above.
Discussion (0). Continue with ORCID to comment.