REVIEW 4 major objections 5 minor 52 references
Accurate electron correlation-energy functional: Expansion in an interaction renormalized by the random-phase approximation
T0 review · 4 major / 5 minor · reviewed 2026-08-12 · deepseek-v4-flash
Pith's one-line read A first-principles functional built from RPA-renormalized perturbation theory outperforms the standard local-density approximation on a 60-crystal benchmark.
desk verdict Genuinely new kite-diagram correction and a careful benchmark, but the missing V2 estimate and error-free stats leave the accuracy claim only conditional. read the letter →
The pith
A machine-rendered reading of the paper's core claim, the machinery that carries it, and where it could break.
The reading
What carries the argument
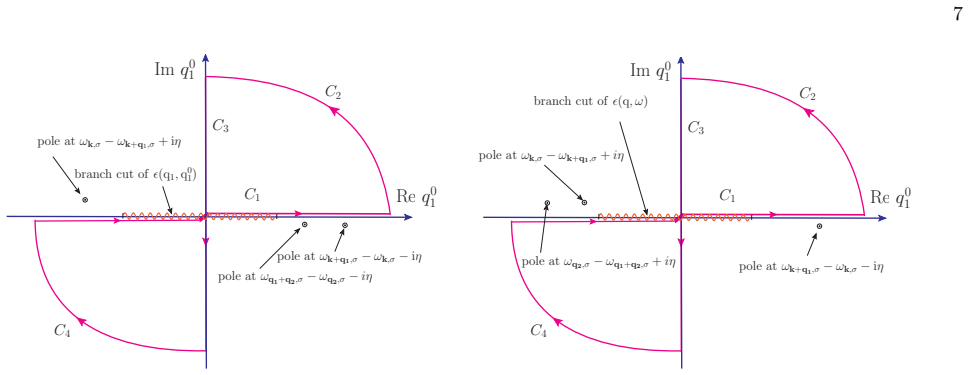
The central object is the RPA-renormalized interaction line, $\tilde{V}_{\mathrm{eff}}(q,q_0) = 4\pi e^2/(q^2\epsilon(q,q_0))$, the bare Coulomb interaction divided by the RPA dielectric function. The calculation is organized as a series in the number of such screened lines entering the Goldstone diagrams for the ground-state interaction energy. At leading order two diagram families contribute: the ring-diagram series of particle-hole bubbles, summed analytically and numerically, and the kite diagram, whose bare part is Onsager's constant $0.04836$ Ry and whose correction is evaluated as an 11-dimensional integral by stochastic integration after contour rotation. The functional is completed by analytic fits, Eq. (42) for the rings and Eq. (58) for the kite, constrained to reproduce the exact small-$r_s$ coefficient $c_L(\zeta)\ln r_s$, the large-$r_s$ behavior $-0.803/r_s^{3/4}$, and the known high-density expansion.
What would settle it
Compute the second-order term $V_2(r_s,\zeta)$ in the RPA-renormalized expansion and test whether $|V_2/V_1|$ stays small in the physical region; alternatively, compare RPAF correlation energies against accurate quantum Monte Carlo data for the spin-polarized uniform electron gas at $r_s$ between 1 and 6, where the finite-size extrapolation is reliable.
Extended reading notes
Core claim
The central claim is that the correlation energy of the uniform electron gas, and hence the local part of a density functional, can be computed accurately from a perturbation expansion in the RPA-renormalized interaction truncated at first order. In this expansion, the zeroth order is exchange, while the first order consists of the RPA ring-diagram series and the kite-diagram series: the second-order exchange diagram with one interaction line replaced by the RPA-screened line, evaluated with full frequency dependence. Calculating these diagrams and fitting their $r_s$ and spin-polarization dependence, the authors obtain the RPAF functional, which they show is more accurate than the standard local-density approximation for equilibrium lattice constants and bulk moduli across a 60-crystal benchmark set. The paper further claims that the previously neglected frequency-dependent correction to the kite diagram is significant in the physical density range, and that the success of the functional supports the convergence of the reorganized series.
Load-bearing premise
The load-bearing assumption is that, in the density range of real materials, the first-order term in the RPA-renormalized expansion already captures essentially all of the correlation energy, so that the uncomputed second- and higher-order terms are small.
Editorial extensions
If this is right
- The RPAF functional can be dropped into existing local-density DFT codes at the same computational cost as the standard local-density approximation, improving average lattice constants and bulk moduli on the benchmark set.
- The frequency-dependent screening of the kite diagram is a significant part of the correlation energy at physical densities; quasi-static approximations used elsewhere give a second-order exchange energy that differs by a large amount.
- The expansion is systematic: computing the next order in the RPA-renormalized interaction should improve the functional further, though the paper does not carry out that calculation.
- The functional's claimed validity is tied to the density range of real crystals; outside that range, for example in very dilute electron gases, the truncated expansion is not justified.
Reading between the lines
- Because the benchmark set is fixed and the new functional outperforms the standard LDA on average, a sharper test would be to apply RPAF to an independent set of solids, especially transition-metal compounds where errors in the standard LDA are largest.
- The paper's critique of finite-size extrapolation in quantum Monte Carlo data suggests that other local functionals fitted to those data may carry a systematic bias near $r_s \approx 2$; re-evaluating those fits with better extrapolation could change the comparison baseline.
- The systematic diagrammatic construction implies a natural route to nonlocal corrections: dressing additional interaction lines could yield gradient-level functionals with controlled error estimates, rather than fitted parametrizations.
Editorial analysis
A structured set of objections, weighed in public.
Referee Report
Summary. The paper constructs a new local-density approximation for the correlation energy of the uniform electron gas, called RPAF, based on a perturbative expansion in an RPA-renormalized electron-electron interaction. The first-order terms in this expansion are the ring-diagram series and the kite diagram with frequency-dependent screening; the paper computes these numerically, verifies them against known limits (Onsager's constant, the ln(r_s) coefficient, and the large-r_s asymptote), and fits the results to analytic forms as functions of r_s and spin polarization ζ. The functional is implemented in Quantum ESPRESSO and benchmarked on the 60-crystal set of Ref. 15, where it reports lower mean absolute relative errors for the lattice constant (1.41% vs 1.68%) and bulk modulus (14.2% vs 16.0%) than the Perdew-Wang LDA.
Significance. If the benchmark result is statistically solid, RPAF would be a useful systematically constructed LDA that improves over PW-LDA for ground-state properties. The paper's strengths include the analytical checks (Onsager's constant, the small-r_s ln(r_s) coefficient, the large-r_s behavior), the independent Monte Carlo verification of the kite-diagram integral, and the clean benchmark design (same list, same pseudopotentials, same code settings for both functionals). The work also opens a potentially systematic route to higher-order correlation functionals via the renormalized-interaction expansion.
major comments (4)
- [Sec. II.C (Eq. 20 and Fig. 7)] The convergence argument for the RPA-renormalized interaction series is incomplete. The paper states in Sec. II.C that the series in Eq. (20) converges fast as long as |V_{n+1}/V_n| is small, but the only evidence presented is Fig. 7, which shows |V_1/V_0| < 1 in the physical range. The relevant small parameter for the validity of the first-order truncation is |V_2/V_1|, not the ratio of the first-order correction to the zeroth-order exchange energy. The paper does not compute or bound V_2, and the final paragraph of Sec. VI explicitly defers the next-order correction to future work. Consequently, the central claim that the truncated expansion is justified in the density range of real materials is not established. The authors should either compute an estimate of V_2 (e.g., its leading diagrams or a bound) or soften the convergence claims and present the functional as an empirically successful construction guided by a diagrammatic expansion.
- [Sec. V and Table VII] The benchmark statistics reported in Table VII (MARE 1.41% for lattice constants and 14.2% for bulk moduli, versus 1.68% and 16.0% for PW) are quoted without any uncertainty estimates. The kite-diagram Monte Carlo data in Table IX have standard deviations that reach about 13% of the value (e.g., ζ=1, r_s=10, where the value is 8.8 mRy and the standard deviation is 12 mRy), and these uncertainties propagate through the fitted coefficients in Tables V and VI into the calculated lattice constants and bulk moduli. A difference of 1.68% versus 1.41% in mean absolute relative error may be statistically insignificant. The authors should provide error bars on the benchmark statistics, for example by resampling the 60 crystals or by propagating fit uncertainties, before concluding that RPAF outperforms PW.
- [Sec. II.C, Fig. 7] Even the ratio actually plotted, |V_1/V_0|, is not small for all spin polarizations in the physical density range. For ζ=0.8 and ζ=1.0, the ratio shown in Fig. 7 approaches about 0.8 near r_s≈5, which is not '"significantly smaller than unity" as claimed in the text. Because a convergent perturbative series requires the ratio of successive terms to be small, this large value of |V_1/V_0| underscores the need for an explicit estimate of V_2; the current figure does not support the stated conclusion that the series is rapidly convergent in the region realized in real materials.
- [Sec. III.B and Table IX] The spin-polarized interpolation for the kite diagram relies on Monte Carlo data with poor statistical quality in the fully polarized limit. For ζ=1.0 and r_s≈10, the reported value is 8.8 mRy with a standard deviation of 12 mRy, so the signal is not statistically significant. Fitting Eq. (58) and the ζ-interpolation in Eq. (59) to such noisy data may produce unstable coefficients in the high-polarization branch of the functional. The authors should either reduce the statistical errors at these points (for example, by increasing the number of Monte Carlo samples) or explicitly restrict the claimed validity of the spin-polarized functional to the range where the data are significant.
minor comments (5)
- [Eq. (14)] The definition of κ± in Eq. (14) contains an unclear expression "q2/1/2"; please clarify the notation for the Lindhard function.
- [Sec. II.C] The text contains a few typographical errors, including "brunch-cut" for "branch cut," and the sentence "which is given which is given" in Sec. II.B; these should be corrected.
- [Table IX caption] The caption of Table IX should specify explicitly that the numbers in parentheses are standard deviations in the last digits (e.g., 47.60 (10) means 47.60 ± 0.10 mRy), as this notation is not self-explanatory.
- [Figs. 22 and 23] The horizontal axes of Figs. 22 and 23 label each crystal with a single tick but no readable labels; a supplementary table or a labeled axis would help identify individual materials.
- [Abstract] The abstract's claim that the functional is "more accurate than the currently available most popular one" should be qualified as "on the 60-crystal benchmark considered here," since the paper does not establish superiority for all ground-state properties.
Circularity Check
No significant circularity: RPAF is derived from explicitly computed electron-gas diagrams and benchmarked on an external crystal list without fitting to the target observables.
full rationale
The paper's derivation chain is self-contained and non-circular. The functional is constructed from the many-body expression Eq. (5) for the interaction-energy expectation value, then reorganized as an expansion in the RPA-renormalized interaction. The ring-diagram series is evaluated by numerical quadrature of Eq. (12), and the kite-diagram series is evaluated by Monte Carlo integration of Eqs. (28) and (29); both are independent computations from the stated diagrammatic rules. The analytic small- and large-rs constraints (e.g., cL from Eq. (16), e0 from Appendix B, Onsager's ϵ0_2b) are derived within the paper or taken from external literature, not from the benchmarked materials. The fitted analytic forms in Section III (Eqs. (42), (52), (55)-(59)) are fits to these internally computed electron-gas data, not to any experimental lattice constant or bulk modulus. The benchmark in Section V uses the external 60-crystal list from Refs. [15-17] and compares RPAF against PW with no RPAF parameter adjusted to improve those results. The main caveat is the convergence argument in Section II.C: the paper uses |V1/V0| < 1 as evidence of convergence, which does not actually bound the neglected V2 term. The paper itself concedes the next order is 'cumbersome' but 'achievable'. This is a genuine correctness risk about the truncation, not a circularity, because the missing V2 is not hidden inside the inputs or defined into the claim. There is also no load-bearing self-citation chain: the relevant cited results (Gell-Mann-Brueckner, Onsager, Hedin, Loos-Gill) are external, and the authors do not invoke their own prior work to force the functional form. The accuracy comparison against PW is an external benchmark, so the central claim is not equivalent to its inputs by construction.
Assumptions & free parameters
free parameters (3)
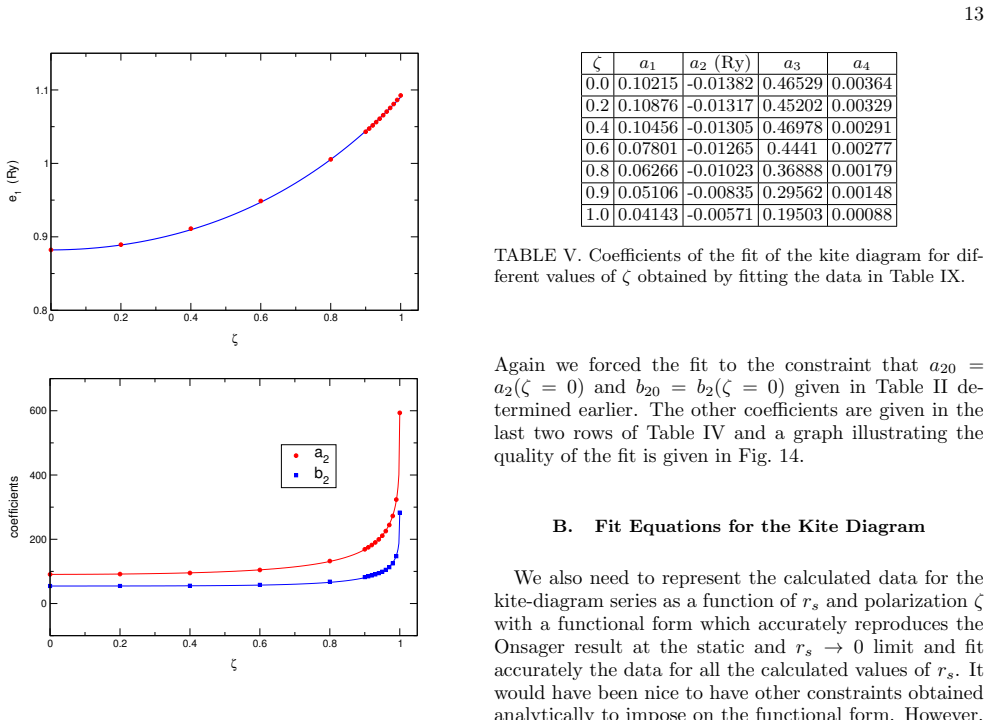
- Ring-diagram functional coefficients c0, e1, a2, b2 (as functions of zeta) =
c0(0)=-0.1423 Ry, e1(0)=0.8822 Ry, a2(0)=90.76, b2(0)=54.55; higher-zeta values in Table II
- Kite-diagram functional coefficients a1, a2, a3, a4 (as functions of zeta) =
a1(0)=0.10215, a2(0)=-0.01382, a3(0)=0.46529, a4(0)=0.00364; see Table V
- Spin-polarization interpolation coefficients (c0n, c0bar_n, e1n, a2n, b2n, anm) =
Tables III, IV, VI
assumptions (4)
- ad hoc to paper The first-order truncation of the RPA-renormalized interaction expansion is sufficient for the correlation energy at metallic densities.
- domain assumption The local density approximation is a valid approximation for the 60 solids in the benchmark.
- domain assumption The RPA dielectric function (Lindhard, no vertex corrections) yields the correct screened interaction.
- domain assumption The Monte Carlo evaluation of the kite-diagram integrals is sufficiently accurate.
Cite this review
Pith. "Pith review of Accurate electron correlation-energy functional: Expansion in an interaction renormalized by the random-phase approximation." pith.science (2026). https://pith.science/paper/63KGRUP7
@misc{pith2026241118371,
  author       = {Pith},
  title        = {Pith review of: Accurate electron correlation-energy functional: Expansion in an interaction renormalized by the random-phase approximation},
  year         = {2026},
  howpublished = {\url{https://pith.science/paper/63KGRUP7}},
  note         = {Machine review of arXiv:2411.18371}
}
abstract
We present an accurate local density-functional for electronic-structure calculations within the density functional theory (DFT). The functional is derived by analyzing the structure of the standard perturbative expansion of the correlation energy of the interacting uniform electron gas. Then, the expansion is partially re-summed and reorganized as a self-consistent series in powers of a renormalized electron-electron interaction vertex based on the screened frequency-momentum dependent dielectric matrix given by the well-known random-phase approximation. First, we demonstrate that the range of $r_s$, where this reorganized and renormalized series converges, contains and is significantly larger than the average range realized in real crystalline materials. Using a combination of analytical, numerical, and stochastic integration techniques we are able to calculate all the diagrams which have contribution up to the same leading order. We benchmarked the functional using the Quantum ESPRESSO implementation of the DFT applied to the same list of materials, selected previously by other authors, in its entirety without any modification of the list. We find that for ground-state properties in general, such as, equilibrium atomic distances and bulk moduli, the functional presented here is more accurate than the currently available most popular one.
Figures



Figures from the paper (17 more)






Reference graph
Works this paper leans on
-
[1]
Small r s limit ζ c0 (Ry) e1 (Ry) a2 b2 0.00 -0.1423 0.8822 90.76 54.55 0.02 -0.1408 0.8893 91.67 54.64 0.40 -0.1365 0.9111 95.14 55.38 0.60 -0.1287 0.9488 104.51 58.17 0.80 -0.1165 1.0055 132.21 68.05 0.90 -0.1079 1.0431 168.80 82.18 0.91 -0.1069 1.0474 174.99 84.60 0.92 -0.1059 1.0517 182.03 87.39 0.93 -0.1049 1.0562 190.14 90.62 0.94 -0.1038 1.0608 199...
-
[2]
large r s limit For the large rs limit (100 < rs < 1000000), we have found that the numerical results for ϵr(rs, ζ) can be very accurately fit to the form ϵr(rs, ζ) = e0 r 3 4 s + e1 rs . (41) We know that at very large rs values, when the 1 /r3/4 s term is the dominant term[4], the coefficient e0 should be e0 = −0.803 Ry as calculated exactly in Appendix...
-
[3]
We found that the following form accomplishes these requirements
Our functional for all values of r s We will need a compact functional form to describe our data for the series of the ring diagrams which satisfy the above discussed small rs and large rs behavior, and at the same time it describes accurately our numerical results in the entire region, especially the region of rs realized in the real materials. We found ...
work page 1971
-
[4]
Functional dependence on spin-polarization ζ Now, we wish to find interpolation formulas to describe the ζ dependence of the coefficients in Table II. First, the values of the constant c0(ζ) is plot in Fig. 13. Notice that 12 0 2 4 6 8 10 rs -0.5 -0.4 -0.3 -0.2 -0.1 0 ε r(rs) (Ry) ζ = 0 (a) 0.01 1 100 10000 1e+06 1e+08 rs -0.5 -0.4 -0.3 -0.2 -0.1 0 ε r(rs...
-
[5]
J. P. Perdew and Y. Wang, Accurate and simple ana- lytic representation of the electron-gas correlation energy, Phys. Rev. B 45, 13244 (1992)
1992
-
[6]
D. M. Ceperley and B. J. Alder, Ground state of the electron gas by a stochastic method, Phys. Rev. Lett. 45, 566 (1980)
1980
-
[7]
The second term is the contribution to ϵr(rs, ζ) in the second region of integration, which integrates on y half of the real line, and Q is integrated into Q ∈ [ ∗ k(rs, y), ∞). The integral in the second region was calculated by Perdew, where it relies on using the simplified expression of ˜Π(2Q, yQ, ζ, rs) we found in Eq. B2 to calculate all of the requ...
-
[8]
is the spin-trace of the polarization tensor. In the integral expression of ∆ 2[n↑, n↓], we can do the transformations ⃗ q2 → ⃗ q2 − ⃗ q1 followed by ⃗ q1 → −⃗ q1. These momentum transformations are what allow a com- mon product of Heaviside functions for both ∆ 1[n↑, n↓] and ∆2[n↑, n↓] . We obtain: ∆2 [n↑, n↓] = iV 2¯h(2π)10 X {σ}=± Z 1 0 dλ Z d4q1 Z d3q...
Show all 52 references
-
[9]
Hohenberg and W
P. Hohenberg and W. Kohn, Inhomogeneous electron gas, Phys. Rev. 136, B864 (1964)
1964
-
[10]
Kohn and L
W. Kohn and L. J. Sham, Self-consistent equations in- cluding exchange and correlation effects, Phys. Rev. 140, A1133 (1965)
1965
-
[11]
J. P. Perdew, K. Burke, and M. Ernzerhof, Generalized gradient approximation made simple, Phys. Rev. Lett. 77, 3865 (1996)
1996
-
[12]
Wang and J
Y. Wang and J. P. Perdew, Correlation hole of the spin- polarized electron gas, with exact small-wave-vector and high-density scaling, Phys. Rev. B 44, 13298 (1991)
1991
-
[13]
Onsager, L
L. Onsager, L. Mittag, and M. J. Stephen, Integrals in the theory of electron correlations, Annalen der Physik 473, 71 (1966)
1966
-
[14]
Giannozzi, O
P. Giannozzi, O. Andreussi, T. Brumme, O. Bunau, M. B. Nardelli, M. Calandra, R. Car, C. Cavazzoni, D. Ceresoli, M. Cococcioni, N. Colonna, I. Carnimeo, A. D. Corso, S. de Gironcoli, P. Delugas, R. A. D. Jr, A. Ferretti, A. Floris, G. Fratesi, G. Fugallo, R. Gebauer, U. Gerstm...
2017
-
[15]
Ortiz and P
G. Ortiz and P. Ballone, Correlation energy, structure factor, radial distribution function, and momentum dis- tribution of the spin-polarized uniform electron gas, Phys. Rev. B 50, 1391 (1994)
1994
-
[16]
Ortiz, M
G. Ortiz, M. Harris, and P. Ballone, Zero temperature phases of the electron gas, Phys. Rev. Lett. 82, 5317 (1999)
1999
-
[17]
Wigner, On the interaction of electrons in metals, Phys
E. Wigner, On the interaction of electrons in metals, Phys. Rev. 46, 1002 (1934)
1934
-
[18]
Gell-Mann and K
M. Gell-Mann and K. A. Brueckner, Correlation energy of an electron gas at high density, Phys. Rev. 106, 364 (1957)
1957
-
[19]
Nozi` eres and D
P. Nozi` eres and D. Pines, Electron interaction in solids. general formulation, Phys. Rev. 109, 741 (1958)
1958
-
[20]
Nozeri´ es and D
P. Nozeri´ es and D. Pines, Theory of Quantum Liquids (Taylor and Francis, Boca Raton, 1999)
1999
-
[21]
Mahan, Many-Particle Physics (Kluwer Aca- demic/Plenum, New York, 2000)
G. Mahan, Many-Particle Physics (Kluwer Aca- demic/Plenum, New York, 2000)
2000
-
[22]
A. A. Abrikosov, L. P. Gor’kov, and I. E. Dzyaloshin- ski, Methods of quantum field theory in statistical physics (Dover Publications, New York, 1963)
1963
-
[23]
For completeness, in Appendix D we studied the fate of ferromagnetism of the uniform electron fluid as im- plied by our functional
than the local part of the popular functionals PW[5] (and, therefore, PBE[3] because they share the same local functional). For completeness, in Appendix D we studied the fate of ferromagnetism of the uniform electron fluid as im- plied by our functional. Our findings are in q...
-
[24]
P. Haas, F. Tran, and P. Blaha, Calculation of the lattice constant of solids with semilocal functionals, Phys. Rev. B 79, 085104 (2009)
2009
-
[25]
F. Tran, R. Laskowski, P. Blaha, and K. Schwarz, Perfor- mance on molecules, surfaces, and solids of the wu-cohen gga exchange-correlation energy functional, Phys. Rev. B 26 Results of the DFT calculations a0 B0 a0 B0 Crystal PW RPAF Expt. PW RPAF Expt. Crystal PW RPAF Expt. P...
2007
-
[26]
J. S. Kang, M. Li, H. Wu, H. Nguyen, and Y. Hu, Basic physical properties of cubic boron arsenide, Applied Physics Letters 115, 122103 (2019), https://pubs.aip.org/aip/apl/article- pdf/doi/10.1063/1.5116025/19765225/122103 1 online.pdf
2019 doi
-
[27]
Pines, A collective description of electron interactions: Iv
D. Pines, A collective description of electron interactions: Iv. electron interaction in metals, Phys. Rev. 92, 626 (1953)
1953
-
[28]
cluster” op- erator, where the order of the cluster expansion depends on up to what “ n-th
From this Figure, it becomes evident that, unless the asymptotic form of the correlation energy per site ϵc(N ) for very large N is known, the extrapolation process can- not distinguish between the PW values (blue solid-circle at the origin) and the RPAF values (magenta solid-...
-
[29]
Bohm and D
D. Bohm and D. Pines, A collective description of elec- tron interactions: Iii. coulomb interactions in a degener- ate electron gas, Phys. Rev. 92, 609 (1953)
1953
-
[30]
A. L. Fetter and J. D. Walecka, Quantum Theory of Many-Particle Systems (McGraw-Hill, New York, 1971)
1971
-
[31]
Hedin, New method for calculating the one-particle green’s function with application to the electron-gas problem, Phys
L. Hedin, New method for calculating the one-particle green’s function with application to the electron-gas problem, Phys. Rev. 139, A796 (1965)
1965
-
[32]
J. J. Quinn and R. A. Ferrell, Electron self-energy ap- proach to correlation in a degenerate electron gas, Phys. 27 rs\ζ 0.00 0.20 0.40 0.60 0.80 0.90 0.91 0.92 0.93 0.94 0.95 0.96 0.97 0.98 0.99 1.00 0.01 -429.0 -424.4 -410.2 -384.4 -341.6 -308.3 -304.2 -299.8 -295.2 -290.3 ...
1958
-
[33]
Loos and P
P.-F. Loos and P. M. Gill, Correlation energy of the spin- polarized uniform electron gas at high density, Physical Review B—Condensed Matter and Materials Physics 84, 033103 (2011)
2011
-
[34]
G. G. Hoffman, Correlation energy of a spin-polarized electron gas at high density, Phys. Rev. B 45, 8730 (1992)
1992
-
[35]
Misawa, Ferromagnetism of an electron gas, Phys
S. Misawa, Ferromagnetism of an electron gas, Phys. Rev. 140, A1645 (1965)
1965
-
[36]
Ceperley, Ground state of the fermion one-component plasma: A monte carlo study in two and three dimen- sions, Phys
D. Ceperley, Ground state of the fermion one-component plasma: A monte carlo study in two and three dimen- sions, Phys. Rev. B 18, 3126 (1978)
1978
-
[37]
T. N. Mihm, B. Yang, and J. J. Shepherd, Power laws used to extrapolate the coupled cluster correlation energy to the thermodynamic limit, Journal of Chemical Theory and Computation 17, 2752 (2021)
2021
-
[38]
D. L. Freeman, Coupled-cluster expansion applied to the electron gas: Inclusion of ring and exchange effects, Phys- ical Review B 15, 5512 (1977)
1977
-
[39]
Coester and H
F. Coester and H. K¨ ummel, Short-range correlations in nuclear wave functions, Nuclear Physics 17, 477 (1960)
1960
-
[40]
K¨ ummel, Theory of many-body wave functions with correlations, Nuclear Physics A 176, 205 (1971)
H. K¨ ummel, Theory of many-body wave functions with correlations, Nuclear Physics A 176, 205 (1971)
1971
-
[41]
K¨ ummel and K
H. K¨ ummel and K. L¨ uhrmann, Equations for linked clus- ters and the energy variational principle, Nuclear Physics 28 rs ζ = 0 rs\ζ 0.2 0.4 0.6 0.8 0.9 1.0 0.01 47.60 (10) 0.2 40.75 (19) 40.85 (44) 41.66 (32) 42.83 (12) 43.3 (56) 44.44 (14) 0.09 44.16 (16) 0.4 36.23 (37) 37....
1972
-
[42]
Jansen, R.-F
G. Jansen, R.-F. Liu, and J. G. ´Angy´ an, On the equiv- alence of ring-coupled cluster and adiabatic connection fluctuation-dissipation theorem random phase approxi- mation correlation energy expressions, The Journal of chemical physics 133 (2010)
2010
-
[43]
X. Ren, P. Rinke, G. E. Scuseria, and M. Scheffler, Renor- malized second-order perturbation theory for the elec- tron correlation energy: Concept, implementation, and benchmarks, Physical Review B—Condensed Matter and Materials Physics 88, 035120 (2013)
2013
-
[44]
Hummel, A
F. Hummel, A. Gr¨ uneis, G. Kresse, and P. Ziesche, Screened exchange corrections to the random phase ap- proximation from many-body perturbation theory, Jour- nal of Chemical Theory and Computation 15, 3223 (2019)
2019
-
[45]
Dal Corso, Pseudopotentials periodic table: From h to pu, Computational Materials Science 95, 337 (2014)
A. Dal Corso, Pseudopotentials periodic table: From h to pu, Computational Materials Science 95, 337 (2014)
2014
-
[46]
B. S. Shastry, Magnetic susceptibility of an electron gas in the random-phase approximation, Phys. Rev. B 17, 385 (1978)
1978
-
[47]
K. A. Brueckner and K. Sawada, Magnetic susceptibility of an electron gas at high density, Phys. Rev. 112, 328 (1958)
1958
-
[48]
D. R. Hamann and A. W. Overhauser, Electron-gas spin susceptibility, Phys. Rev. 143, 183 (1966)
1966
-
[49]
Zhang and S
Y. Zhang and S. Das Sarma, Exchange instabilities in electron systems: Bloch versus stoner ferromagnetism, Phys. Rev. B 72, 115317 (2005)
2005
-
[50]
E. A. Brandes and G. Brook, Smithells metals reference book (Elsevier, 2013)
2013
-
[51]
Liang, L
H. Liang, L. Fang, S. Guan, F. Peng, Z. Zhang, H. Chen, W. Zhang, and C. Lu, Insights into the bond behavior and mechanical properties of hafnium carbide under high pressure and high temperature, Inorganic Chemistry 60, 515 (2021)
2021
-
[52]
Gerward, J
L. Gerward, J. S. Olsen, L. Petit, G. Vaitheeswaran, V. Kanchana, and A. Svane, Bulk modulus of ceo2 and pro2—an experimental and theoretical study, Journal of Alloys and Compounds 400, 56 (2005)
2005
Reviewed August 12, 2026 · model on record in the stance chip above.
Discussion (0). Continue with ORCID to comment.