OpenRoundup: Multi-Table Data Wrangling Through Interactive Visualization
Pith reviewed 2026-06-27 08:06 UTC · model grok-4.3
The pith
OpenRoundup lets data journalists consolidate multiple tables into one without code through interactive visual panels and two operations.
A machine-rendered reading of the paper's core claim, the machinery that carries it, and where it could break.
Core claim
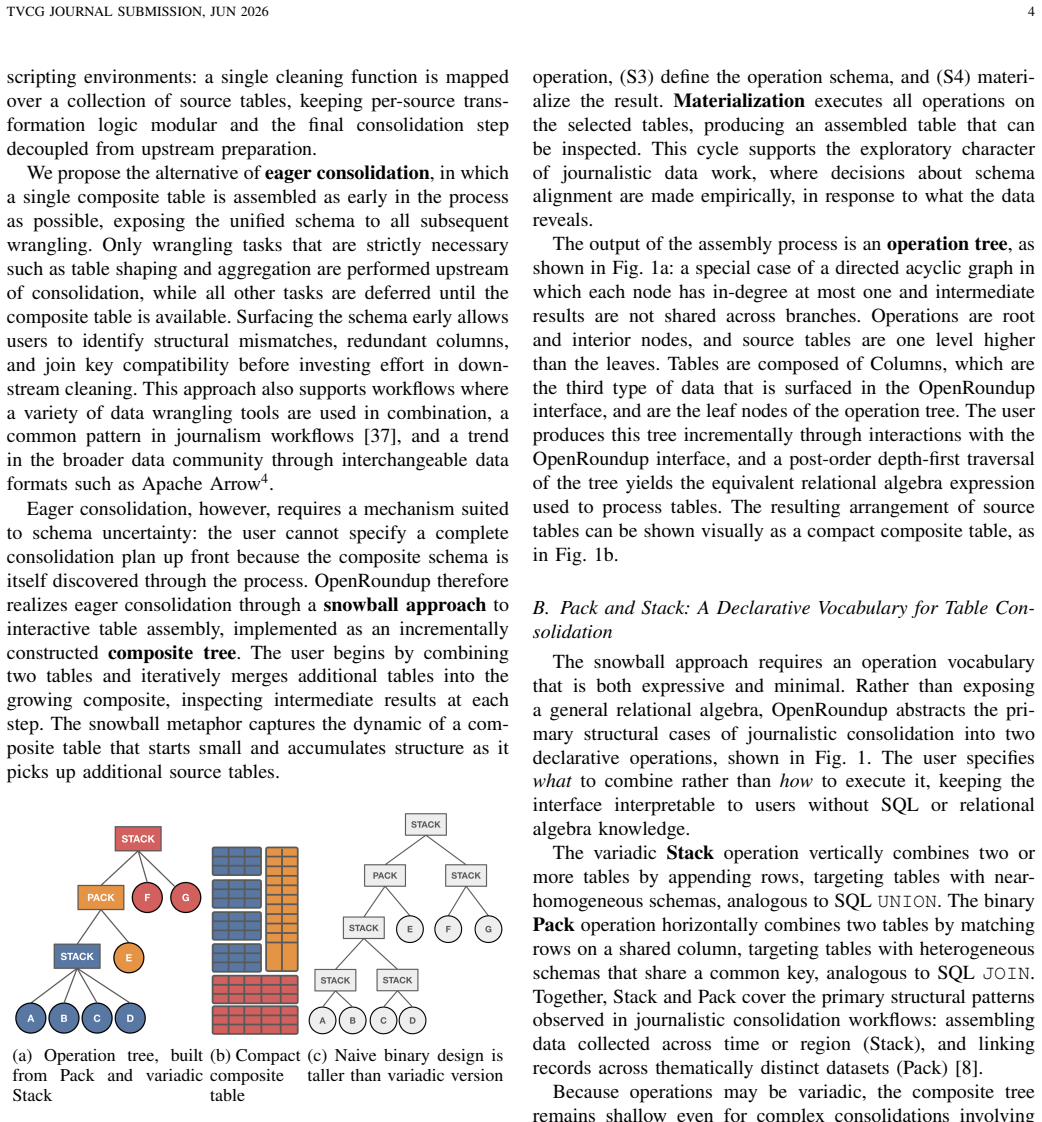
The authors present OpenRoundup as a system that treats the collection of tables rather than a single table as the primary unit of work. Users consolidate tables through eager table consolidation, building a composite table early via interactive incremental assembly. This is supported by a declarative vocabulary consisting of the two operations Stack and Pack. The interface runs entirely in the browser with a client-only architecture for privacy, featuring live schema previews, ambient alerts, and a recursive treemap of the operation tree. Evaluation through replication of 17 workflows and deployment with four journalists shows expressive coverage of real-world consolidation tasks and utilit
What carries the argument
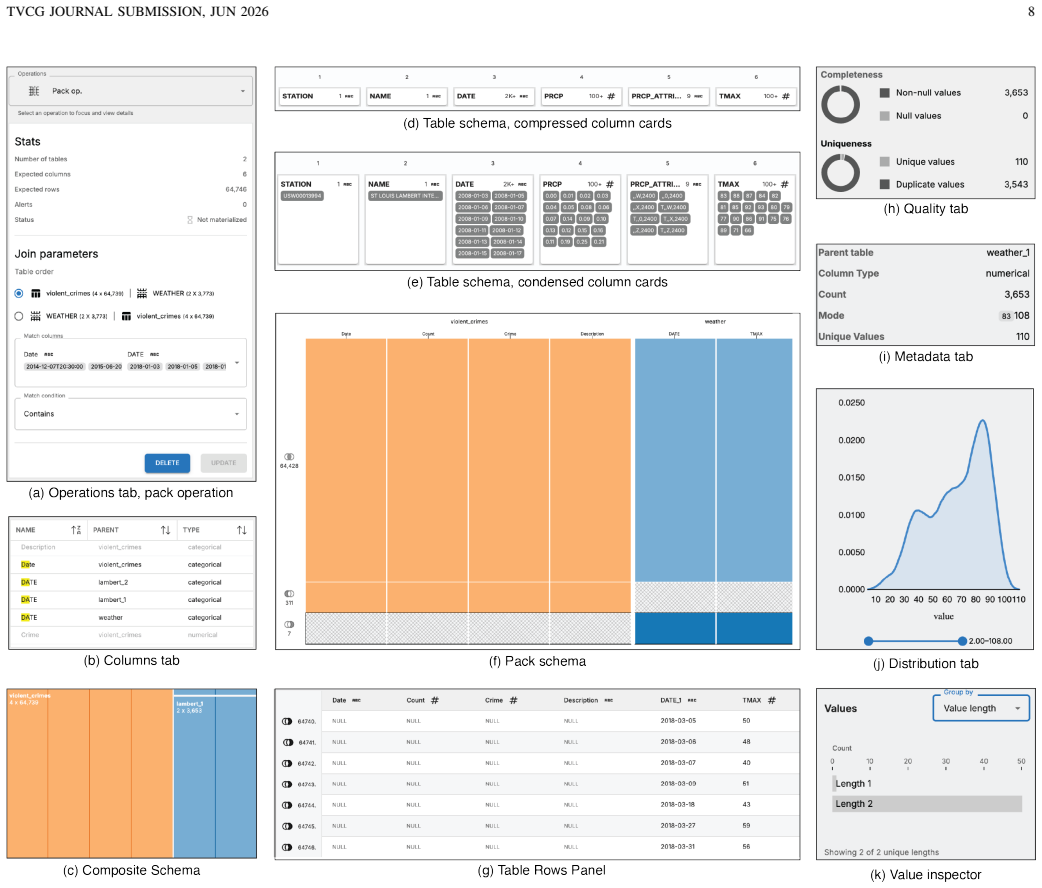
Eager table consolidation that assembles a composite table early through interactive incremental assembly of source tables, together with the declarative vocabulary of Stack and Pack operations.
If this is right
- The system covers the consolidation tasks found in 17 published journalist programming workflows.
- Practitioners who understand joins conceptually but lack programming skills gain a usable tool for multi-table work.
- The interface provides secondary value for data journalism education.
- All processing stays client-side, ensuring privacy for sensitive journalism data.
Where Pith is reading between the lines
- The visual approach could extend to other domains where users combine datasets without coding, such as business reporting or research data integration.
- The unanticipated education benefit suggests classroom use in data literacy courses beyond journalism.
- Testing the system with larger collections of tables would reveal whether the current two-operation vocabulary scales to more complex cases.
Load-bearing premise
That reproducing 17 published journalist programming workflows and testing with four professional data journalists is sufficient to establish both expressive coverage of real-world tasks and practical utility for the target user group.
What would settle it
A published journalist workflow from accountability reporting that cannot be completed using only the Stack and Pack operations through the five-panel interface.
Figures
read the original abstract
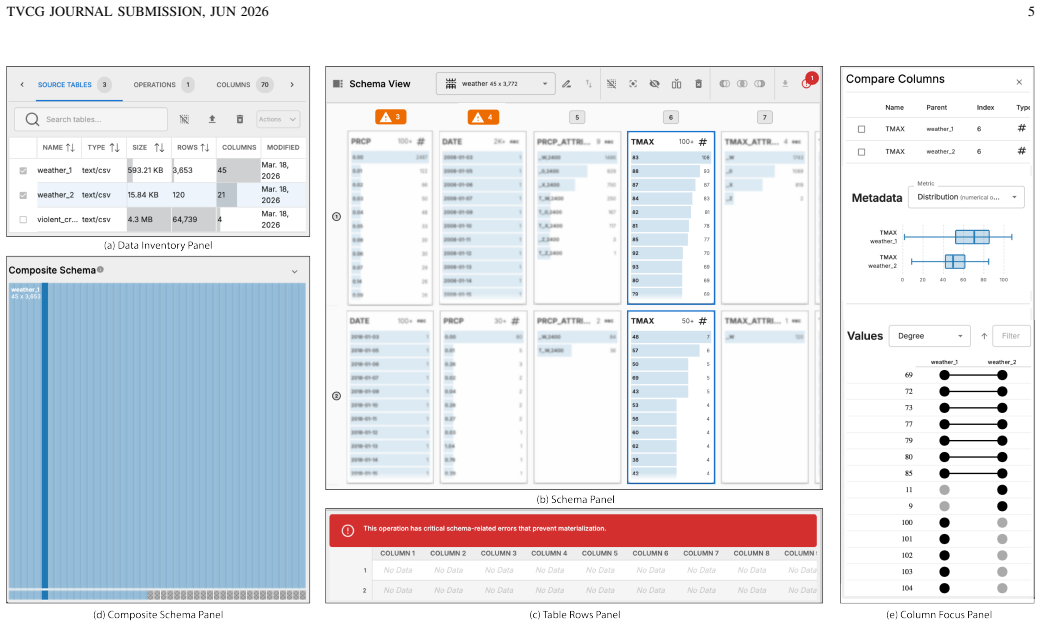
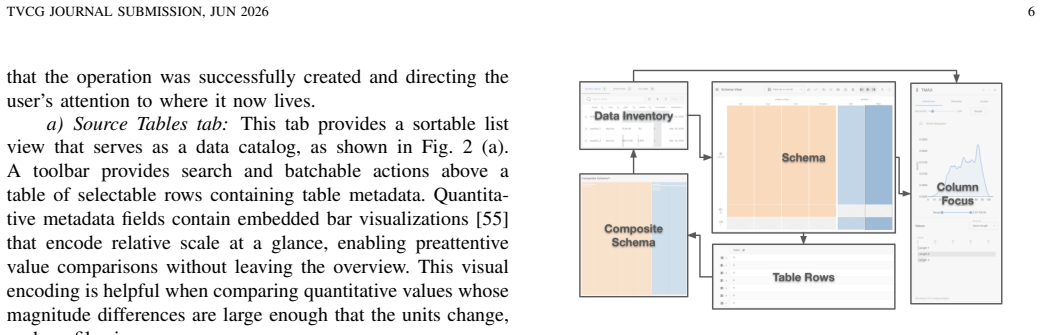
Data journalists routinely integrate records across multiple independently published sources to support accountability reporting, yet no existing interactive wrangling tool treats the collection of tables -- rather than the single table -- as its primary unit of work. We present OpenRoundup, an open-source, browser-based system that enables data journalists to consolidate multiple tables into a single analysis-ready output without writing code. The interface comprises five coordinated panels that implement a schema-first, values-on-demand paradigm with live schema previews, ambient data quality alerts, and a recursive treemap visualization of the evolving operation tree. A client-only architecture powered by DuckDB-WASM runs in the browser, providing strong data privacy guarantees suited to sensitive journalism data. The system introduces two conceptual contributions: eager table consolidation, in which a composite table is assembled early in the wrangling phase via interactive, incremental assembly of multiple source tables; and a declarative vocabulary for table consolidation consisting of two operations, Stack and Pack. We evaluate the system through a replication study in which the authors reproduce 17 published journalist programming workflows using only the interface, and a deployment study with four professional data journalists. The replication study demonstrates expressive coverage of real-world consolidation tasks. The deployment study confirms utility for practitioners who understand joins conceptually but lack the programming skills to execute them, and surfaces an unanticipated secondary value for data journalism education.
Editorial analysis
A structured set of objections, weighed in public.
Referee Report
Summary. The paper presents OpenRoundup, a browser-based interactive visualization system for consolidating multiple tables into a single analysis-ready output without code, targeted at data journalists. It uses five coordinated panels with a schema-first, values-on-demand paradigm, live schema previews, ambient data quality alerts, and a recursive treemap of the operation tree. The client-only DuckDB-WASM architecture provides privacy guarantees. Conceptual contributions include eager table consolidation and a declarative vocabulary of Stack and Pack operations. Evaluation consists of an author-conducted replication study reproducing 17 published journalist programming workflows and a deployment study with four professional data journalists; the paper claims the former demonstrates expressive coverage of real-world tasks and the latter confirms utility for practitioners who understand joins conceptually but lack programming skills, plus secondary value for data journalism education.
Significance. If the evaluations hold with stronger quantitative support, the work would offer a practical advance in interactive multi-table wrangling tools by shifting focus from single-table operations to collection-level consolidation, with notable strengths in open-source release, client-side privacy for sensitive journalism data, and accessibility for non-programmers. The introduction of eager consolidation and the Stack/Pack vocabulary could influence future tool design in HCI and data journalism. Current evidence limitations reduce immediate impact, but the system description and privacy architecture provide a solid foundation for follow-on work.
major comments (2)
- [Replication study description] Replication study description (abstract and evaluation section): the claim that the study 'demonstrates expressive coverage of real-world consolidation tasks' is load-bearing for the expressive-coverage contribution, yet the manuscript reports no quantitative metrics such as per-workflow success rates, completion times, error counts, or inter-rater agreement; self-reproduction by authors without independent coders or exclusion criteria leaves the coverage claim without verifiable support.
- [Deployment study description] Deployment study description (abstract and evaluation section): the claim that the study 'confirms utility for practitioners who understand joins conceptually but lack the programming skills' rests on n=4 participants with no reported task completion rates, controls for prior tool exposure, task diversity, or exclusion criteria; this sample size and lack of methodology details directly undermine the utility and target-user-group claims.
minor comments (2)
- [Introduction / §3] The abstract and introduction introduce 'eager table consolidation' and 'Stack and Pack' without an early formal definition or comparison table to existing join/concatenation operators; a small clarifying table in §3 would improve readability.
- [Figures] Figure captions for the treemap and panel coordination diagrams could more explicitly link visual elements to the Stack versus Pack semantics.
Simulated Author's Rebuttal
We thank the referee for the thoughtful and detailed feedback on the evaluation sections. The concerns about the strength of evidence in both studies are valid, and we address them point by point below. We propose targeted revisions to qualify claims and expand methodological transparency while preserving the core contributions of the work.
read point-by-point responses
-
Referee: Replication study description (abstract and evaluation section): the claim that the study 'demonstrates expressive coverage of real-world consolidation tasks' is load-bearing for the expressive-coverage contribution, yet the manuscript reports no quantitative metrics such as per-workflow success rates, completion times, error counts, or inter-rater agreement; self-reproduction by authors without independent coders or exclusion criteria leaves the coverage claim without verifiable support.
Authors: We agree that the replication study provides no quantitative metrics and was performed by the authors without independent coders or formal exclusion criteria. The study was conceived as a qualitative reproduction exercise to map published journalist workflows onto the system's operations rather than as a controlled experiment. In the revised manuscript we will: (1) expand the evaluation section with a fuller description of workflow selection, the reproduction process, and any difficulties encountered; (2) replace the phrasing 'demonstrates expressive coverage' with the more qualified 'provides evidence of expressive coverage'; and (3) add an explicit limitations paragraph noting the absence of quantitative measures and independent validation. These changes will be made without altering the factual record of the 17 reproductions. revision: partial
-
Referee: Deployment study description (abstract and evaluation section): the claim that the study 'confirms utility for practitioners who understand joins conceptually but lack the programming skills' rests on n=4 participants with no reported task completion rates, controls for prior tool exposure, task diversity, or exclusion criteria; this sample size and lack of methodology details directly undermine the utility and target-user-group claims.
Authors: We concur that n=4 is small, that no quantitative completion rates or controls were reported, and that the current text overstates the strength of the evidence. The study was a qualitative deployment with professional data journalists; such small samples are common in HCI work with domain experts but do limit generalizability. In revision we will: (1) supply additional methodological details on participant recruitment, session protocol, and observed usage that were collected but not previously reported; (2) change 'confirms utility' to 'suggests utility' and explicitly state the small sample size as a limitation; and (3) soften the target-user-group claim to reflect that participants already understood joins conceptually. No new data collection is proposed. revision: partial
Circularity Check
No circularity: system description and external-task evaluation are self-contained
full rationale
The paper presents a browser-based interface for multi-table wrangling and evaluates it via author replication of 17 published workflows plus a deployment study with four journalists. No equations, fitted parameters, predictions, or self-citations appear in the load-bearing claims. The replication and deployment rest on direct reproduction of external published tasks and user sessions rather than any reduction to the system's own definitions or prior author results. This is the normal non-circular case for an HCI systems paper whose central claims are supported by external artifacts and small-scale user observation.
Axiom & Free-Parameter Ledger
axioms (1)
- domain assumption Standard HCI assumption that small deployment studies with domain practitioners can indicate practical utility and unanticipated educational value.
invented entities (2)
-
Eager table consolidation
no independent evidence
-
Stack and Pack operations
no independent evidence
Reference graph
Works this paper leans on
-
[1]
S. Cohen, J. T. Hamilton, and F. Turner, “Computational Journal- ism,”Comm. ACM (CACM), vol. 54, no. 10, p. 66, Oct. 2011, 10.1145/2001269.2001288. TVCG JOURNAL SUBMISSION, JUN 2026 17
-
[2]
Meyer,Precision Journalism: A Reporter’s Introduction to Social Science Methods, 4th ed
P. Meyer,Precision Journalism: A Reporter’s Introduction to Social Science Methods, 4th ed. Rowman & Littlefield Publishers, Inc, 2002
2002
-
[3]
Bounegru and J
L. Bounegru and J. Gray,The data journalism handbook: Towards a critical data practice. Amsterdam University Press, 2021
2021
-
[4]
S. Kandel, J. Heer, C. Plaisant, J. Kennedy, F. van Ham, N. Henry Riche, C. Weaver, B. Lee, D. Brodbeck, and P. Puono, “Research Directions in Data Wrangling: Visualizations and Transformations for Usable and Credible Data,”Information Visualization, vol. 10, no. 4, pp. 271–288, 2011, 10.1177/1473871611415994
-
[5]
Data Journalism in 2017: The Current State and Challenges Facing the Field Today,
S. Rogers, J. Schwabish, and D. Bowers, “Data Journalism in 2017: The Current State and Challenges Facing the Field Today,”
2017
-
[6]
Available: https://newslab.withgoogle.com/assets/docs/ data-journalism-in-2017.pdf
[Online]. Available: https://newslab.withgoogle.com/assets/docs/ data-journalism-in-2017.pdf
2017
-
[7]
The State of Data Journalism Survey,
European Journalism Centre, “The State of Data Journalism Survey,” 2021. [Online]. Available: https://ejc.net/resources/ data-journalism-survey-2021
2021
-
[8]
Data Journalism Practices Globally: Skills, Education, Opportunities, and Values,
B. R. Heravi and M. Lorenz, “Data Journalism Practices Globally: Skills, Education, Opportunities, and Values,”Journalism and Media, vol. 1, no. 1, pp. 26–40, 2020, 10.3390/journalmedia1010003
-
[9]
S. Kasica, C. Berret, and T. Munzner, “Table Scraps: An Action- able Framework for Multi-Table Data Wrangling From An Artifact Study of Computational Journalism,”IEEE Trans. Visualization & Computer Graphics (TVCG), vol. 27, no. 2, pp. 957–966, 2021, 10.1109/TVCG.2020.3030462
-
[10]
Data Wrangling for Big Data: Challenges and Opportunities,
T. Furche, G. Gottlob, L. Libkin, G. Orsi, and N. Paton, “Data Wrangling for Big Data: Challenges and Opportunities,” inProceedings of the 19th International Conference on Extending Database Technology, Bordeaux, France, Mar. 2016, 10.5441/002/EDBT.2016.44
-
[11]
C. D’Ignazio and L. F. Klein,Data Feminism. The MIT Press, 2020, 10.7551/mitpress/11805.001.0001
-
[12]
Making NLP work for Investigative Journalism,
J. Stray, “Making NLP work for Investigative Journalism,” Berkeley Institute for Data Science, 2017. [Online]. Available: https://www. youtube.com/watch?v=yRP9DL8E36A
2017
-
[13]
Potter’s Wheel: An Interactive Data Cleaning System,
V . Raman and J. M. Hellerstein, “Potter’s Wheel: An Interactive Data Cleaning System,” inConf. Very Large Data Bases (VLDB), vol. 27, 2001, pp. 381–390, 10.5555/645927.672045
-
[14]
Proceedings of the SIGCHI Conference on Human Factors in Computing Systems , pages =
S. Kandel, A. Paepcke, J. Hellerstein, and J. Heer, “Wrangler: Interactive Visual Specification of Data Transformation Scripts,” inACM Conf. Human Factors in Computing Systems (CHI), 2011, pp. 3363–3372, 10.1145/1978942.1979444
-
[15]
Proactive Wran- gling: Mixed-initiative End-user Programming of Data Transformation Scripts,
P. J. Guo, S. Kandel, J. M. Hellerstein, and J. Heer, “Proactive Wran- gling: Mixed-initiative End-user Programming of Data Transformation Scripts,” inConf. ACM Symp. User Interface Software and Technology (UIST). ACM, 2011, pp. 65–74, 10.1145/2047196.2047205
-
[16]
Profiler: integrated statistical analysis and visualization for data quality assessment,
S. Kandel, R. Parikh, A. Paepcke, J. M. Hellerstein, and J. Heer, “Profiler: integrated statistical analysis and visualization for data quality assessment,” inConf. Advanced Visual Interfaces (AVI). Capri Island, Italy: ACM, 2012, pp. 547–554, 10.1145/2254556.2254659
-
[17]
Rigel: Transforming Tabular Data by Declarative Mapping,
R. Chen, D. Weng, Y . Huang, X. Shu, J. Zhou, G. Sun, and Y . Wu, “Rigel: Transforming Tabular Data by Declarative Mapping,”IEEE Trans. Visualization & Computer Graphics (TVCG), pp. 1–11, 2022, 10.1109/TVCG.2022.3209385
-
[18]
Buckaroo: A Direct Manipulation Visual Data Wrangler,
A. Warner, A. McNutt, P. Rosen, and E. K. Rezig, “Buckaroo: A Direct Manipulation Visual Data Wrangler,”Proc. VLDB Endow., vol. 18, no. 12, pp. 5423–5426, 2025, 10.14778/3750601.3750687
-
[19]
Xavier: Toward Better Coding Assistance in Authoring Tabular Data Wrangling Scripts,
Y . Zhou, X. Cai, Q. Shi, Y . Huang, H. Li, H. Qu, D. Weng, and Y . Wu, “Xavier: Toward Better Coding Assistance in Authoring Tabular Data Wrangling Scripts,” inACM Conf. Human Factors in Computing Systems (CHI), Yokohama Japan, 2025, pp. 1–16, 10.1145/3706598.3714239
-
[20]
Unravel: A Fluent Code Explorer for Data Wrangling,
N. Shrestha, T. Barik, and C. Parnin, “Unravel: A Fluent Code Explorer for Data Wrangling,” inConf. ACM Symp. User Interface Software and Technology (UIST), 2021, pp. 198–207, 10.1145/3472749.3474744
-
[21]
TACO: Visualizing Changes in Tables Over Time,
C. Niederer, H. Stitz, R. Hourieh, F. Grassinger, W. Aigner, and M. Streit, “TACO: Visualizing Changes in Tables Over Time,”IEEE Transactions on Visualization and Computer Graphics (InfoVis ’17), vol. 24, no. 1, pp. 677–686, 2018
2018
-
[22]
Effective Use of Data,
N. Mulvad, “Effective Use of Data,” 2018. [Online]. Available: https://www.youtube.com/watch?v=kcE81ekvvHk
2018
-
[23]
OpenRefine 2024 User Survey Results,
M. Magdinier, “OpenRefine 2024 User Survey Results,” OpenRefine,
2024
-
[24]
Available: https://openrefine.org/blog/2024/12/20/ 2024-survey-results
[Online]. Available: https://openrefine.org/blog/2024/12/20/ 2024-survey-results
2024
-
[25]
Tabula: a tool for liberating data tables trapped inside pdf files,
M. Aristar ´an, M. Tigas, and J. B. Merrill, “Tabula: a tool for liberating data tables trapped inside pdf files,” https://github.com/tabulapdf/tabula, TabulaPDF, 2018
2018
-
[26]
Groskopf, J
C. Groskopf, J. Germuska, A. Bycoffe, and T. Mehlinger, “csvkit,” Wireservice, 2012. [Online]. Available: https://github.com/wireservice/ csvkit
2012
-
[27]
Groskopf, “Agate,” 2018
C. Groskopf, “Agate,” 2018. [Online]. Available: https://agate. readthedocs.io
2018
-
[28]
Data integration: the teenage years,
A. Halevy, A. Rajaraman, and J. Ordille, “Data integration: the teenage years,” inProceedings of the 32nd International Conference on Very Large Data Bases, ser. VLDB ’06. VLDB Endowment, 2006, p. 9–16
2006
-
[29]
Data integration: the current status and the way forward,
M. Stonebraker and I. F. Ilyas, “Data integration: the current status and the way forward,”IEEE Data Eng. Bull., vol. 41, pp. 3–9, 2018
2018
-
[30]
J. Bleiholder and F. Naumann, “Data fusion,”ACM Comput. Surv., vol. 41, no. 1, pp. 1–41, Jan. 2009, 10.1145/1456650.1456651
-
[31]
E. Rahm and P. A. Bernstein, “A survey of approaches to automatic schema matching,”The VLDB Journal, vol. 10, no. 4, pp. 334–350, 2001, 10.1007/s007780100057
-
[32]
Clio: Schema Mapping Creation and Data Exchange,
R. Fagin, L. M. Haas, M. Hern ´andez, R. J. Miller, L. Popa, and Y . Velegrakis, “Clio: Schema Mapping Creation and Data Exchange,” inConceptual Modeling: Foundations and Applications, A. T. Borgida, V . K. Chaudhri, P. Giorgini, and E. S. Yu, Eds. Springer, 2009, vol. 5600, pp. 198–236, 10.1007/978-3-642-02463-4 12
-
[33]
Interactive generation of integrated schemas,
L. Chiticariu, P. G. Kolaitis, and L. Popa, “Interactive generation of integrated schemas,” inProceedings of the 2008 ACM SIG- MOD international conference on Management of data, ser. SIGMOD ’08. Association for Computing Machinery, Jun. 2008, pp. 833–846, 10.1145/1376616.1376700
-
[34]
Visualiza- tion of mappings between schemas,
G. G. Robertson, M. P. Czerwinski, and J. E. Churchill, “Visualiza- tion of mappings between schemas,” inACM Conf. Human Factors in Computing Systems (CHI), Portland, Oregon, USA, 2005, p. 431, 10.1145/1054972.1055032
-
[35]
L. Qian, M. J. Cafarella, and H. V . Jagadish, “Sample-driven schema mapping,” inConf. ACM Intl. Conf. on Management of Data (SIGMOD), Scottsdale Arizona USA, May 2012, pp. 73–84, 10.1145/2213836.2213846
-
[36]
H. Fang, “Managing data lakes in big data era: What’s a data lake and why has it became popular in data management ecosystem,” inProc. IEEE Intl. Conf. Cyber Technology in Automation, Control, and Intelligent Systems (CYBER), 2015, pp. 820–824, 10.1109/CY- BER.2015.7288049
work page doi:10.1109/cy- 2015
-
[37]
Preliminary Guidelines for Combining Data Integration and Visual Data Analysis,
A. Coscia, A. Suh, R. Chang, and A. Endert, “Preliminary Guidelines for Combining Data Integration and Visual Data Analysis,”IEEE Trans. Visualization & Computer Graphics (TVCG), vol. 30, no. 10, pp. 6678– 6690, 2024, 10.1109/TVCG.2023.3334513
-
[38]
Dy- namic workload driven data integration in Tableau,
K. Morton, R. Bunker, J. Mackinlay, R. Morton, and C. Stolte, “Dy- namic workload driven data integration in Tableau,” inConf. ACM Intl. Conf. on Management of Data (SIGMOD), 2012, p. 807–816, 10.1145/2213836.2213961
-
[39]
Dirty Data in the Newsroom: Comparing Data Preparation in Journalism and Data Science,
S. Kasica, C. Berret, and T. Munzner, “Dirty Data in the Newsroom: Comparing Data Preparation in Journalism and Data Science,” inACM Conf. Human Factors in Computing Systems (CHI), New York, NY , USA, 2023, 10.1145/3544548.3581271
-
[40]
R. Tuchinda, P. Szekely, and C. A. Knoblock, “Building Mashups by Example,” inACM Conf. Intelligent User Interfaces (IUI), 2008, pp. 139–149, 10.1145/1378773.1378792
-
[41]
End-User Programming of Mashups with Vegemite,
J. Lin, J. Wong, J. Nichols, A. Cypher, and T. A. Lau, “End-User Programming of Mashups with Vegemite,” inACM Conf. Intelligent User Interfaces (IUI). New York, NY , USA: ACM, 2009, pp. 97–106, 10.1145/1502650.1502667
-
[42]
Interactive Data Integration through Smart Copy & Paste,
Z. Ives, C. Knoblock, S. Minton, M. Jacob, P. Talukdar, R. Tuchinda, J. L. Ambite, M. Muslea, and C. Gazen, “Interactive Data Integration through Smart Copy & Paste,”Conf. Innovative Data Systems Research (CIDR), 2009
2009
-
[43]
The Emerging Web of Linked Data,
C. Bizer, “The Emerging Web of Linked Data,”IEEE Intell. Syst., vol. 24, no. 5, pp. 87–92, 2009, 10.1109/MIS.2009.102
-
[44]
Potluck: Semi-ontology Alignment for Casual Users,
D. F. Huynh, R. C. Miller, and D. R. Karger, “Potluck: Semi-ontology Alignment for Casual Users,” inThe Semantic Web, ser. Lecture Notes in Computer Science, K. Aberer, K.-S. Choi, N. Noy, D. Allemang, K.-I. Lee, L. Nixon, J. Golbeck, P. Mika, D. Maynard, R. Mizoguchi, G. Schreiber, and P. Cudr´e-Mauroux, Eds. Berlin, Heidelberg: Springer, 2007, pp. 903–9...
-
[45]
Carp´e data: supporting serendipitous data integration in personal information management,
M. Van Kleek, D. A. Smith, H. S. Packer, J. Skinner, and N. R. Shad- bolt, “Carp´e data: supporting serendipitous data integration in personal information management,” inProceedings of the SIGCHI Conference on Human Factors in Computing Systems. Paris France: ACM, Apr. 2013, pp. 2339–2348, 10.1145/2470654.2481324
-
[46]
CA V A: A Visual Analytics System for Exploratory Columnar Data Augmentation Using Knowledge Graphs,
D. Cashman, S. Xu, S. Das, F. Heimerl, C. Liu, S. R. Humayoun, M. Gleicher, A. Endert, and R. Chang, “CA V A: A Visual Analytics System for Exploratory Columnar Data Augmentation Using Knowledge Graphs,”IEEE Trans. Visualization & Computer Graphics (TVCG), vol. 27, no. 2, pp. 1731–1741, 2021, 10.1109/TVCG.2020.3030443. TVCG JOURNAL SUBMISSION, JUN 2026 18
-
[47]
KTabulator: Inter- active Ad hoc Table Creation using Knowledge Graphs,
S. Xia, N. Anzum, S. Salihoglu, and J. Zhao, “KTabulator: Inter- active Ad hoc Table Creation using Knowledge Graphs,” inACM Conf. Human Factors in Computing Systems (CHI), 2021, pp. 1–14, 10.1145/3411764.3445227
-
[48]
OpenRefine,
D. Huynh and S. Mazzocchi, “OpenRefine,” 2012. [Online]. Available: openrefine.org
2012
-
[49]
Uncovering data landscapes through data reconnaissance and task wrangling,
A. Crisan and T. Munzner, “Uncovering data landscapes through data reconnaissance and task wrangling,” inIEEE Conf. Visualization and Vi- sual Analytics (VIS), 2019, pp. 46–50, 10.1109/VISUAL.2019.8933542
-
[50]
Data Integration for Heterogenous Datasets,
J. Hendler, “Data Integration for Heterogenous Datasets,”Big Data, vol. 2, no. 4, pp. 205–215, 2014, 10.1089/big.2014.0068
-
[51]
Where Do Stories Come From? Examining the Exploration Process in Investigative Data Journalism,
D. Showkat and E. P. Baumer, “Where Do Stories Come From? Examining the Exploration Process in Investigative Data Journalism,” ACM Human-Computer Interaction (PACM-CSCW), vol. 5, pp. 1–31, 2021, 10.1145/3479534
-
[52]
Iceberg sensemaking: A process model for critical data analysis and visualization,
C. Berret and T. Munzner, “Iceberg sensemaking: A process model for critical data analysis and visualization,”IEEE Trans. Visualization & Computer Graphics (TVCG), vol. 31, no. 9, pp. 6067–6084, 2025, 10.1109/TVCG.2024.3486613
-
[53]
Building Highly-Coordinated Visualizations in Improvise,
C. Weaver, “Building Highly-Coordinated Visualizations in Improvise,” inIEEE Symp. Information Visualization (InfoVis), 2004, pp. 159–166, 10.1109/INFVIS.2004.12
-
[54]
The Eyes Have It: A Task by Data Type Taxonomy for Information Visualizations,
B. Shneiderman, “The Eyes Have It: A Task by Data Type Taxonomy for Information Visualizations,” inIEEE Symp. Visual Languages (VL), 1996, p. 336, 10.1109/VL.1996.545307
-
[55]
D. A. Norman,The design of everyday things. New York, NY , USA: Basic Books, 2013
2013
-
[56]
Shneiderman, C
B. Shneiderman, C. Plaisant, M. Cohen, S. Jacobs, N. Elmqvist, and N. Diakopoulos,Designing the User Interface: Strategies for Effective Human-Computer Interaction, 6th ed. Pearson, 2016
2016
-
[57]
Exploring the Placement and Design of Word-Scale Visualizations,
P. Goffin, W. Willett, J.-D. Fekete, and P. Isenberg, “Exploring the Placement and Design of Word-Scale Visualizations,”IEEE Trans. Visualization & Computer Graphics (TVCG), vol. 20, no. 12, pp. 2291– 2300, 2014, 10.1109/TVCG.2014.2346435
-
[58]
Direct manipulation: A step beyond programming languages,
B. Shneiderman, “Direct manipulation: A step beyond programming languages,”IEEE Computer, vol. 16, no. 08, pp. 57–69, 1983, 10.1109/MC.1983.1654471
-
[59]
Ware,Information visualization : perception for design, 2nd ed
C. Ware,Information visualization : perception for design, 2nd ed. San Francisco ; Tokyo: Morgan Kaufmann Publishers, 2004
2004
-
[60]
Enterprise Data Analysis and Visualization: An Interview Study,
S. Kandel, A. Paepcke, J. M. Hellerstein, and J. Heer, “Enterprise Data Analysis and Visualization: An Interview Study,”IEEE Trans. Visualization & Computer Graphics (TVCG), vol. 18, no. 12, pp. 2917– 2926, 2012, 10.1109/TVCG.2012.219
-
[61]
E. R. Tufte,Envisioning Information. Cheshire, CT, USA: Graphics Press, 1990
1990
-
[62]
Visual comparison for information visualiza- tion,
M. Gleicher, D. Albers, R. Walker, I. Jusufi, C. D. Hansen, and J. C. Roberts, “Visual comparison for information visualiza- tion,”Information Visualization, vol. 10, no. 4, pp. 289–309, 2011, 10.1177/1473871611416549
-
[63]
Untidy Data: The Unreasonable Effectiveness of Tables,
L. Bartram, M. Correll, and M. Tory, “Untidy Data: The Unreasonable Effectiveness of Tables,”IEEE Trans. Visualization & Computer Graph- ics (TVCG), vol. 28, pp. 686–696, 2022, 10.1109/TVCG.2021.3114830
-
[64]
Interactive browsing and navigation in relational databases,
M. Kahng, S. B. Navathe, J. T. Stasko, and D. H. P. Chau, “Interactive browsing and navigation in relational databases,”Proc. VLDB Endow. (VLDB), vol. 9, no. 12, pp. 1017–1028, 2016, 10.14778/2994509.2994520
-
[65]
Dynamic queries for information exploration: an implementation and evaluation,
C. Ahlberg, C. Williamson, and B. Shneiderman, “Dynamic queries for information exploration: an implementation and evaluation,” inACM Conf. Human Factors in Computing Systems (CHI), 1992, pp. 619–626, 10.1145/142750.143054
-
[66]
The Shaping of Information by Visual Metaphors,
C. Ziemkiewicz and R. Kosara, “The Shaping of Information by Visual Metaphors,”IEEE Trans. Visualization & Computer Graphics (TVCG), vol. 14, no. 6, pp. 1269–1276, 2008, 10.1109/TVCG.2008.171
-
[67]
Arcs, angles, or areas: Individual data encodings in pie and donut charts,
D. Skau and R. Kosara, “Arcs, angles, or areas: Individual data encodings in pie and donut charts,”Computer Graphics Forum, vol. 35, no. 3, pp. 121–130, 2016, doi.org/10.1111/cgf.12888
-
[68]
Looks Good To Me: Visualizations As Sanity Checks,
M. Correll, M. Li, G. Kindlmann, and C. Scheidegger, “Looks Good To Me: Visualizations As Sanity Checks,”IEEE Trans. Visualization & Computer Graphics (TVCG), vol. 25, no. 1, pp. 830–839, 2019, 10.1109/TVCG.2018.2864907
-
[69]
B. W. Silverman,Density Estimation for Statistics and Data Analysis. London: Chapman and Hall, 1986
1986
-
[70]
UpSet: Visualization of Intersecting Sets,
A. Lex, N. Gehlenborg, H. Strobelt, R. Vuillemot, and H. Pfister, “UpSet: Visualization of Intersecting Sets,”IEEE Trans. Visualization & Computer Graphics (TVCG), vol. 20, no. 12, pp. 1983–1992, 2014, 10.1109/TVCG.2014.2346248
-
[71]
Z. Qu and J. Hullman, “Keeping multiple views consistent: Constraints, validations, and exceptions in visualization authoring,”IEEE Trans. Visualization & Computer Graphics (TVCG), vol. 24, no. 1, pp. 468– 477, 2018, 10.1109/TVCG.2017.2744198
-
[72]
C. North and B. Shneiderman, “Snap-together visualization: a user interface for coordinating visualizations via relational schemata,” inConf. Advanced Visual Interfaces (AVI), 2000, pp. 128–135, 10.1145/345513.345282
-
[73]
Vega- Lite: A grammar of interactive graphics,
A. Satyanarayan, D. Moritz, K. Wongsuphasawat, and J. Heer, “Vega- Lite: A grammar of interactive graphics,”IEEE Trans. Visualization & Computer Graphics (TVCG), vol. 23, no. 1, p. 341–350, 2017, 10.1109/TVCG.2016.2599030
-
[74]
DuckDB-W ASM: fast analytical processing for the web,
A. Kohn, D. Moritz, M. Raasveldt, H. M ¨uhleisen, and T. Neu- mann, “DuckDB-W ASM: fast analytical processing for the web,” Proc. VLDB Endow. (VLDB), vol. 15, no. 12, p. 3574–3577, 2022, 10.14778/3554821.3554847
-
[75]
H. Garcia-Molina and K. Salem, “Sagas,”ACM Sigmod Record, vol. 16, no. 3, pp. 249–259, 1987, 10.1145/38714.38742
-
[76]
Di ´ataxis: A systematic framework for technical documentation authoring,
D. Procida, “Di ´ataxis: A systematic framework for technical documentation authoring,” 2023, accessed: 2026-05-28. [Online]. Available: https://diataxis.fr
2023
-
[77]
Ask IRE: What is a data diary, and why should I use one?
D. Malan, “Ask IRE: What is a data diary, and why should I use one?” The Investigative Reporters & Editors Journal, vol. 41, no. 4, p. 3, 2018
2018
-
[78]
Ten Simple Rules for Reproducible Computational Research,
G. K. Sandve, A. Nekrutenko, J. Taylor, and E. Hovig, “Ten Simple Rules for Reproducible Computational Research,”PLoS Comput Biol, vol. 9, no. 10, p. e1003285, 2013, 10.1371/journal.pcbi.1003285
-
[79]
H. Wickham, “Tidy Data,”Journal of Statistical Software, vol. 59, no. 1, pp. 1–23, 2014, 10.18637/jss.v059.i10
-
[80]
Codd,The Relational Model for Database Management, 2nd ed
E. Codd,The Relational Model for Database Management, 2nd ed. Boston, MA, USA: Addison-Wesley Longman Publishing, 1990
1990
discussion (0)
Sign in with ORCID, Apple, or X to comment. Anyone can read and Pith papers without signing in.