Hierarchical Graph Learning for Calendar Spread Strategies in Commodity Futures Markets
Pith reviewed 2026-06-25 18:58 UTC · model grok-4.3
The pith
A hierarchical graph that encodes maturity-dependent correlations between commodity futures contracts improves both price predictions and calendar spread trading performance.
A machine-rendered reading of the paper's core claim, the machinery that carries it, and where it could break.
Core claim
By representing commodity futures as a hierarchical graph whose edges reflect maturity-dependent correlations, a learning model can predict price movements more accurately than non-graph baselines; converting those predictions into calendar spread positions produces a trading rule that generates positive statistical-arbitrage returns on CME-traded contracts.
What carries the argument
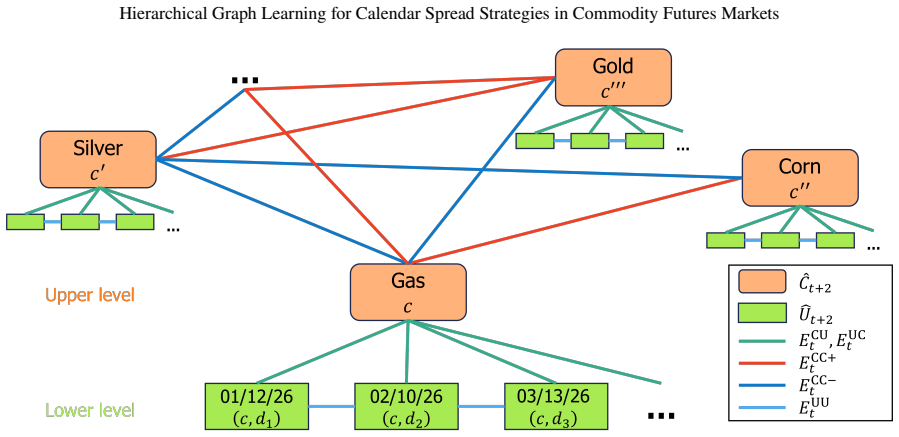
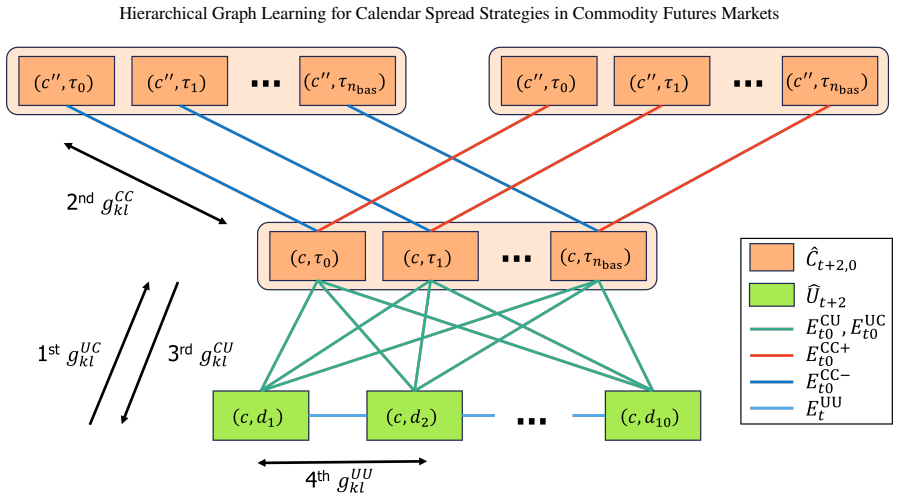
Hierarchical graph whose upper level contains underlyings and lower level contains individual futures contracts, with correlation-derived edges that explicitly vary by maturity; the graph supplies the relational structure used for price-movement prediction and position sizing.
If this is right
- Calendar spread strategies possess measurably higher information ratios and lower variance and delta than long-only strategies.
- Maturity-dependent interrelationships across futures contracts are instrumental for accurate price prediction.
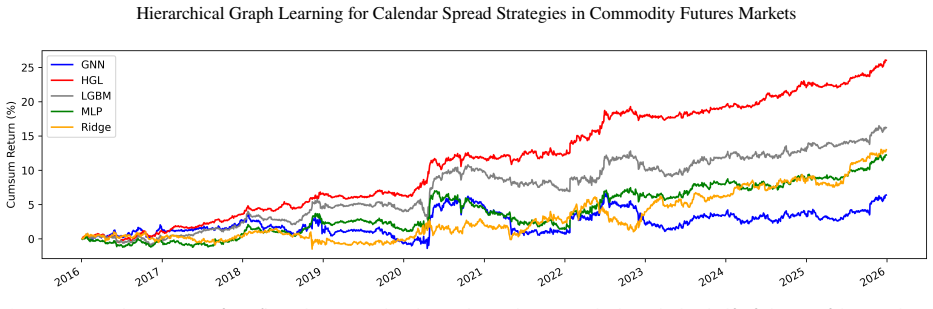
- Converting graph-based predictions into calendar spread positions yields a trading algorithm that outperforms standard models.
- Calendar spread trading constructed this way is effective for statistical arbitrage on commodity futures.
Where Pith is reading between the lines
- Periodic recomputation of the correlation edges may be required when market regimes change.
- The same prediction-to-position conversion step could be applied to other maturity-structured instruments such as interest-rate futures.
- Cross-commodity links already present in the graph could be exploited to extend the method beyond single-commodity spreads.
Load-bearing premise
Observable correlations can be turned into a fixed hierarchical graph whose edges capture the relationships that actually drive future price changes, and that the resulting signals remain profitable after transaction costs.
What would settle it
An out-of-sample replication on the same CME commodity futures in which the hierarchical-graph predictions show no accuracy gain over benchmarks or in which the calendar-spread positions produce non-positive returns net of costs.
Figures
read the original abstract
Commodity futures can be represented hierarchically, with underlying assets at the upper level and individual futures contracts at the lower level. Entities at each level can be connected by edges reflecting inherent correlations, with cross-level edges capturing contract-to-underlying asset connections. Building on our observations of these structures, we propose a hierarchical graph learning approach for calendar spread (CS) strategies in commodity futures markets, addressing two significant gaps in the machine-learning literature: (i) the absence of learning-based methods for CS strategies in futures markets, and (ii) the lack of consideration of maturity-dependent interrelationships across commodity futures. We first establish the efficacy of CS strategies by analytically showing that CS strategies can possess higher risk-adjusted returns, measured by the information ratio, and lower risk, measured by variance and delta, than long-only strategies. We then introduce a method to convert learning-based predictions into CS positions. Next, we develop a hierarchical graph learning method that predicts futures price movements by utilizing the maturity-dependent interrelationships, thereby yielding a CS trading algorithm. Empirical results on commodity futures markets traded on the Chicago Mercantile Exchange Group demonstrate that our method outperforms benchmark models in both prediction and trading performance. We find that maturity-dependent interrelationships across commodity futures are instrumental in prediction and that CS trading based on hierarchical graph learning is effective for statistical arbitrage.
Editorial analysis
A structured set of objections, weighed in public.
Referee Report
Summary. The manuscript proposes a hierarchical graph learning approach for calendar spread (CS) strategies in commodity futures markets. It analytically demonstrates that CS strategies can achieve higher information ratios and lower variance and delta than long-only strategies. A method is introduced to convert learning-based predictions into CS positions, and a hierarchical graph model is developed that exploits maturity-dependent interrelationships to predict futures price movements. Empirical results on CME Group commodity futures are reported to show outperformance versus benchmarks in both prediction accuracy and trading performance, with the conclusion that maturity-dependent structures are instrumental and that the approach is effective for statistical arbitrage.
Significance. If the empirical trading results hold after realistic cost modeling and with appropriate statistical controls, the work would address documented gaps in machine-learning applications to calendar spreads and demonstrate the value of hierarchical graph structures for capturing maturity effects in futures data. The analytical comparison of CS versus long-only strategies would be a useful contribution if the derivation is rigorous and the conversion step from predictions to positions is parameter-free or clearly specified.
major comments (2)
- [Empirical results] Empirical results section: the claim that the method 'outperforms benchmark models in both prediction and trading performance' and is 'effective for statistical arbitrage' is load-bearing for the central contribution, yet no information is supplied on transaction costs, bid-ask spreads, or rollover frictions for CME calendar spreads; without net-of-cost metrics the outperformance cannot be assessed.
- [Method description] Method for converting predictions to positions (described after the analytical IR argument): the abstract and method description provide no equations or pseudocode showing how model outputs are mapped to CS positions; if this step relies on fitted thresholds or scaling parameters, the reported trading metrics may be circular and the outperformance claim requires re-evaluation.
Simulated Author's Rebuttal
We thank the referee for the constructive comments, which highlight important aspects for strengthening the empirical robustness and methodological transparency of the manuscript. We address each major comment below and commit to revisions that incorporate the suggested improvements without altering the core contributions.
read point-by-point responses
-
Referee: [Empirical results] Empirical results section: the claim that the method 'outperforms benchmark models in both prediction and trading performance' and is 'effective for statistical arbitrage' is load-bearing for the central contribution, yet no information is supplied on transaction costs, bid-ask spreads, or rollover frictions for CME calendar spreads; without net-of-cost metrics the outperformance cannot be assessed.
Authors: We agree that net-of-cost metrics are necessary to substantiate the trading performance claims for practical statistical arbitrage applications. The current version emphasizes gross performance to isolate the contribution of the hierarchical graph predictions and the analytical IR advantages of CS strategies. In revision, we will add a dedicated subsection with realistic CME cost modeling (including bid-ask spreads for calendar spreads and rollover frictions), report net-of-cost information ratios and Sharpe ratios, and include statistical controls such as bootstrap tests for significance. revision: yes
-
Referee: [Method description] Method for converting predictions to positions (described after the analytical IR argument): the abstract and method description provide no equations or pseudocode showing how model outputs are mapped to CS positions; if this step relies on fitted thresholds or scaling parameters, the reported trading metrics may be circular and the outperformance claim requires re-evaluation.
Authors: The manuscript introduces the conversion method after the analytical argument on CS versus long-only strategies, but we acknowledge the absence of explicit equations or pseudocode in the abstract and initial method overview. We will revise by adding a formal mathematical description and pseudocode for the mapping step, explicitly stating whether it is parameter-free or detailing any fixed (non-fitted) thresholds to eliminate concerns of circularity in the reported metrics. revision: yes
Circularity Check
No significant circularity; analytical argument and empirical claims are independent of fitted inputs.
full rationale
The paper's chain consists of (1) an analytical demonstration that CS strategies can have higher IR/lower variance than long-only (self-contained math, no data fit), (2) a conversion rule from model predictions to positions (described as a separate methodological step), and (3) a hierarchical GNN that ingests observable correlations to produce price forecasts, followed by out-of-sample trading metrics. None of these steps reduce by construction to their own inputs; the trading results are presented as empirical evidence rather than a renamed fit. No self-citation load-bearing steps or uniqueness theorems are invoked in the abstract or described structure.
Axiom & Free-Parameter Ledger
Reference graph
Works this paper leans on
-
[1]
Empirical Economics 67, 1919–1965
Commodity markets and the global macroeconomy: Evidence from machine learning and GVAR. Empirical Economics 67, 1919–1965. Boons, M., Prado, M.P.,
1919
-
[2]
Anadaptivefinancialtradingsystemusingdeepreinforcementlearningwithcandlestickdecomposingfeatures
Fengqian,D.,Chao,L.,2020. Anadaptivefinancialtradingsystemusingdeepreinforcementlearningwithcandlestickdecomposingfeatures. IEEE Access 8, 63666–63678. Fey, M., Lenssen, J.E.,
2020
-
[3]
Fast Graph Representation Learning with PyTorch Geometric
Fast graph representation learning with PyTorch Geometric. arXiv preprintarXiv:1903.02428. Furlong, F., Ingenito, R.,
work page internal anchor Pith review Pith/arXiv arXiv 1903
-
[4]
Economic Review-Federal Reserve Bank of San Francisco , 27–47
Commodity prices and inflation. Economic Review-Federal Reserve Bank of San Francisco , 27–47. Gabrielsson,P.,Johansson,U.,2015. High-frequencyequityindexfuturestradingusingrecurrentreinforcementlearningwithcandlesticks,in:2015 IEEE Symposium Series on Computational Intelligence, IEEE. pp. 734–741. Gibson, R., Schwartz, E.S.,
2015
-
[5]
Hammoudeh, S.,Sari, R., Ewing, B.T.,2009
Inductive representation learning on large graphs, in: Advances in Neural Information Processing Systems, Curran Associates, Inc. Hammoudeh, S.,Sari, R., Ewing, B.T.,2009. Relationships amongstrategic commodities andwith financial variables: Anew look. Contemporary Economic Policy 27, 251–264. Hendrycks, D., Gimpel, K.,
2009
-
[6]
Gaussian Error Linear Units (GELUs)
Gaussian error linear units (GELUs). arXiv preprintarXiv:1606.08415. Hong, Y., Kim, Y., Kim, J., Choi, Y.,
work page internal anchor Pith review Pith/arXiv arXiv
-
[7]
Index tracking via learning to predict market sensitivities, in: Proceedings of SAI Intelligent Systems Conference, Springer. pp. 111–131. Hong, Y., Klabjan, D., 2025a. Graph learning for foreign exchange rate prediction and statistical arbitrage, in: Proceedings of the 6th ACM International Conference on AI in Finance, ACM. pp. 692–699. Hong, Y., Klabjan...
-
[8]
IEEE Transactions on Knowledge and Data Engineering 37, 4104–4116
Graph portfolio: High-frequency factor predictors via heterogeneous continual GNNs. IEEE Transactions on Knowledge and Data Engineering 37, 4104–4116. Hull,J.,Treepongkaruna,S.,Colwell,D.,Heaney,R.,Pitt,D.,2013.Fundamentalsoffuturesandoptionsmarkets.8thed.,PearsonHigherEducation AU. Hung, C.C., Chen, Y.J.,
2013
-
[9]
Applied Computational Intelligence and Soft Computing 2025, 5993683
A hybrid deep reinforcement learning approach for algorithmic trading in commodity futures markets. Applied Computational Intelligence and Soft Computing 2025, 5993683. Ke, G., Meng, Q., Finley, T., Wang, T., Chen, W., Ma, W., Ye, Q., Liu, T.Y.,
2025
-
[10]
Springer, pp
Efficient backprop, in: Neural networks: Tricks of the Trade. Springer, pp. 9–50. Y. Hong and D. Klabjan, Preprint, June 25, 2026 18 Hierarchical Graph Learning for Calendar Spread Strategies in Commodity Futures Markets Li,J.,Li,G.,Liu,M.,Zhu,X.,Wei,L.,2022. Anoveltext-basedframeworkforforecastingagriculturalfuturesusingmassiveonlinenewsheadlines. Intern...
2026
-
[11]
The Journal of Finance 7, 77–91
Portfolio selection. The Journal of Finance 7, 77–91. Maslyuk,S.,Smyth,R.,2009. Cointegrationbetweenoilspotandfuturepricesofthesameanddifferentgradesinthepresenceofstructuralchange. Energy Policy 37, 1687–1693. Massahi, M., Mahootchi, M.,
2009
-
[12]
When do neural nets outperform boosted trees on tabular data?, in: Advances in Neural Information Processing Systems, Curran Associates, Inc.. pp. 76336–76369. Miao,W.,Gel,Y.R.,Gastwirth,J.L.,2006. Anewtestofsymmetryaboutanunknownmedian,in:RandomWalk,SequentialAnalysisandRelated Topics: A Festschrift in Honor of Yuan-Shih Chow. World Scientific, pp. 199–2...
2006
-
[13]
Searching for Activation Functions
Searching for activation functions. arXiv preprintarXiv:1710.05941. Schwartz, E.S.,
work page internal anchor Pith review Pith/arXiv arXiv
-
[14]
arXiv preprintarXiv:2408.14817
A comprehensive benchmark of machine and deep learning across diverse tabular datasets. arXiv preprintarXiv:2408.14817. Shwartz-Ziv, R., Armon, A.,
-
[15]
Predicting futures market movement using deep neural networks, in: 2019 18th IEEE International Conference On Machine Learning And Applications (ICMLA), IEEE. pp. 118–125. Szymanowska,M.,DeRoon,F.,Nijman,T.,VanDenGoorbergh,R.,2014. Ananatomyofcommodityfuturesriskpremia. TheJournalofFinance 69, 453–482. Tan, Z., Hu, M., Liu, B., Yin, G.,
2019
-
[16]
Futures quantitative investment with heterogeneous continual graph neural network, in: 2024 IEEE International Conference on Data Mining (ICDM), IEEE. pp. 851–856. Vacha,L.,Janda,K.,Kristoufek,L.,Zilberman,D.,2013. Time-frequencydynamicsofbiofuel-fuel-foodsystem. EnergyEconomics40,233–241. Veličković,P.,Cucurull,G.,Casanova,A.,Romero,A.,Liò,P.,Bengio,Y.,2...
2024
-
[17]
Energy 211, 118634
Energy market prediction with novel long short-term memory network: Case study of energy futures index volatility. Energy 211, 118634. Y. Hong and D. Klabjan, Preprint, June 25, 2026 19 Hierarchical Graph Learning for Calendar Spread Strategies in Commodity Futures Markets A. Proofs of Propositions A.1. Proof of Proposition 1 Proof.Fix𝑡∈ℕand𝑐∈ ̂𝐶𝑡. We sup...
2026
-
[18]
(B.2) and (B.3) yield the projection of ̂𝐘𝑡 onto{𝐰 𝑡 ∈ℝ ̂ 𝑛𝑡 ∶𝟏 ⊤𝐰𝑡𝑐 = 0,∀𝑐∈ ̂𝐶𝑡}
From the proof below, Eqs. (B.2) and (B.3) yield the projection of ̂𝐘𝑡 onto{𝐰 𝑡 ∈ℝ ̂ 𝑛𝑡 ∶𝟏 ⊤𝐰𝑡𝑐 = 0,∀𝑐∈ ̂𝐶𝑡}. Therefore,𝐰𝑡 is, up to scaling, the CS weight vector closest to ̂𝐘𝑡. We now show that Eqs. (B.2) and (B.3) are the Euclidean projection of̂𝐘𝑡 onto{𝐰 𝑡 ∈ℝ ̂ 𝑛𝑡 ∶𝐸𝑞.(17)}. The Euclidean projection is given by ̂𝐘′ 𝑡 = (𝐼 ̂ 𝑛𝑡 −𝐺 ⊤ 𝑡 (𝐺𝑡𝐺⊤ 𝑡 )−1𝐺𝑡) ̂𝐘...
2026
-
[19]
(B.5) The(𝑐 ′, 𝑐′′)element of𝐺 𝑡𝐺⊤ 𝑡 is𝐠 ⊤ 𝑡𝑐′ 𝐠𝑡𝑐′′ =̂ 𝑛𝑡𝑐′ 𝕀{𝑐′=𝑐′′}
Note that ̂𝑌 ∙ 𝑡𝑐 = 1 ̂ 𝑛𝑡𝑐 𝐠⊤ 𝑡𝑐 ̂𝐘𝑡. (B.5) The(𝑐 ′, 𝑐′′)element of𝐺 𝑡𝐺⊤ 𝑡 is𝐠 ⊤ 𝑡𝑐′ 𝐠𝑡𝑐′′ =̂ 𝑛𝑡𝑐′ 𝕀{𝑐′=𝑐′′}. From this, we have𝐺𝑡𝐺⊤ 𝑡 = diag 𝑐∈𝐶𝑡(̂ 𝑛𝑡𝑐)and 𝐺⊤ 𝑡 (𝐺𝑡𝐺⊤ 𝑡 )−1𝐺𝑡 ̂𝐘𝑡 (B.6) = [𝐠 𝑡𝑐1 𝐠𝑡𝑐2 … ]⋅diag 𝑐∈𝐶𝑡(1∕̂ 𝑛𝑡𝑐)⋅[𝐠 ⊤ 𝑡𝑐1 ;𝐠 ⊤ 𝑡𝑐2 ; … ] ̂𝐘𝑡 (B.7) = ∑ 𝑐∈ ̂𝐶𝑡 1 ̂ 𝑛𝑡𝑐 𝐠𝑡𝑐𝐠⊤ 𝑡𝑐 ̂𝐘𝑡 (B.8) = ∑ 𝑐∈ ̂𝐶𝑡 ̂𝑌 ∙ 𝑡𝑐𝐠𝑡𝑐 ∈ℝ ̂ 𝑛𝑡 (B.9) by Eq. (B.5), where𝑐1 < 𝑐...
2026
-
[20]
CS LO HGL Ridge MLP LGBM GNN(A1) (A2) (B1) (B2) (B3) (B4)EW S&P 500 Metric Year IR 2016 0.0611 0.0110 -0.0245 0.0017 0.0503 0.0547 0.0020 0.0592 0.0625 0.0649 0.0607 0.0587 0.0614 2017 0.1800 -0.0047 0.0536 0.1394 0.0618 0.1413 0.0769 0.0186 0.0229 0.0260 0.0257 0.0181 0.1712 2018 0.1211 -0.0132 0.0567 0.0746 -0.0292 0.1412 0.0514-0.0394 -0.0343 -0.0341 -...
-
[21]
CS LO HGL Ridge MLP LGBM GNN(A1) (A2) (B1) (B2) (B3) (B4)EW S&P 500 Metric Year Tvr 2016 0.5276 0.6454 0.4692 0.6413 0.5683 0.5884 0.5114 0.0582 0.2663 0.2512 0.2262 0.0547 2017 0.5583 0.6547 0.6300 0.7193 0.6138 0.5790 0.5902 0.0554 0.2882 0.2566 0.2318 0.0520 2018 0.6625 0.6705 0.4946 0.6540 0.7327 0.5235 0.5890 0.0500 0.3197 0.2444 0.2257 0.0431 2019 0...
discussion (0)
Sign in with ORCID, Apple, or X to comment. Anyone can read and Pith papers without signing in.