REVIEW 4 major objections 4 minor 105 references
Ranking Viscous Finger Simulations to an Acquired Ground Truth with Topology-aware Matchings
T0 review · 4 major / 4 minor · reviewed 2026-08-14 · deepseek-v4-flash
Pith's one-line read A lifted Wasserstein distance on persistence diagrams of finger tips ranks viscous-finger simulation runs against an X-ray ground truth with rank correlation 0.84 on the top 25 runs, better than overlap, EMD, and plain Wasserstein.
desk verdict Solid, well-scoped application paper whose best-metric claim needs a sensitivity analysis before it can be taken as more than a single tuned case study. read the letter →
The pith
A machine-rendered reading of the paper's core claim, the machinery that carries it, and where it could break.
The reading
What carries the argument
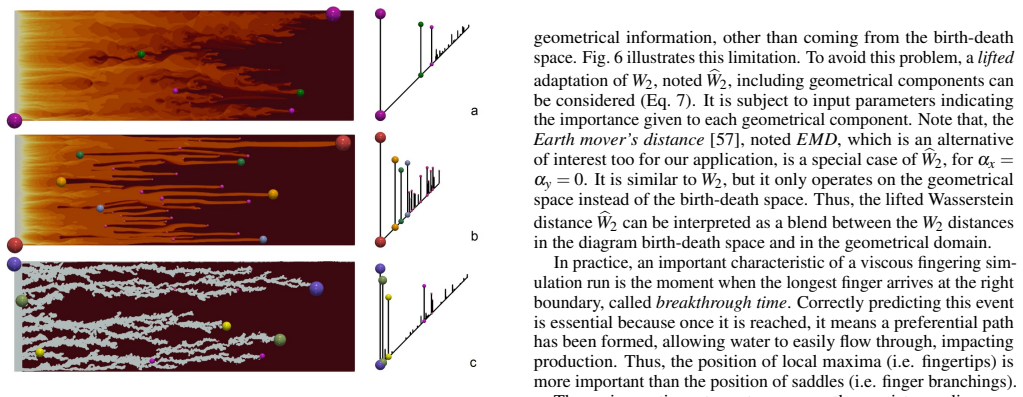
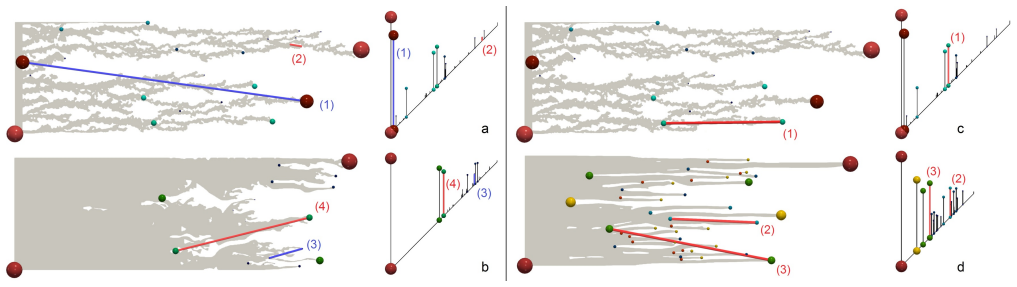
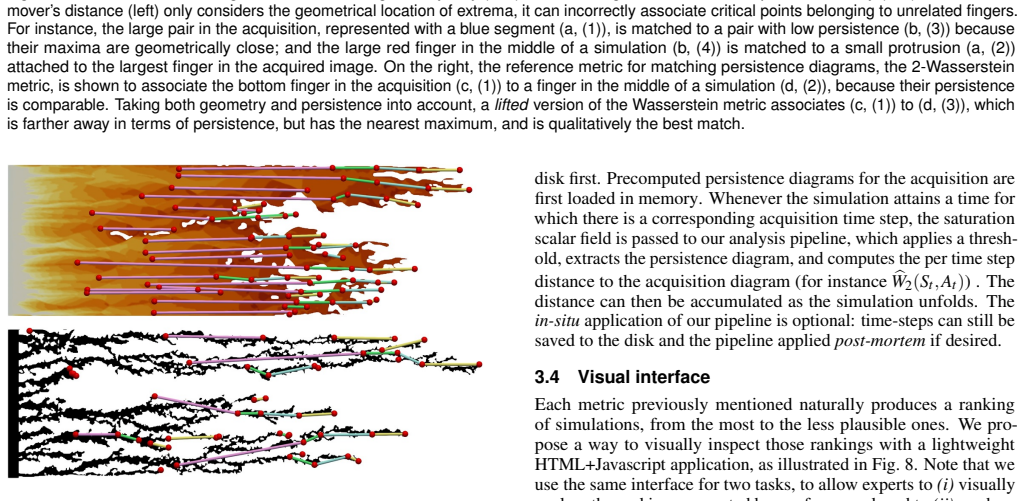
The carrying mechanism is the persistence diagram of the $x$-coordinate scalar field restricted to the thresholded sublevel set $F = f^{-1}_{-\infty}(0.12)$. On $F$, a local maximum of $x$ is a finger tip and its paired saddle has persistence equal to finger length, so the diagram records the number of fingers, how far each has advanced, and how prominent it is, in a way that is insensitive to small noise. Distances between a simulation diagram and the acquisition diagram use the lifted point-wise cost $\hat{d}_p$ of Eq. (6), with weight $\beta_x = 10/\gamma$ on the $x$-positions of tips, $\beta_y = 0$, and $\alpha_x = \alpha_y = 1/\rho$, and these per-time-step costs are accumulated with an $\ell^2$ norm to form the ranking distance $d_{\hat{W}_2}$. The lifting is what lets the matching sacrifice a small persistence difference to bind a fingertip to a geometrically close fingertip, which the paper shows is the step that recovers the expert-preferred association.
What would settle it
Run the same pipeline on the 200 simulations with the fixed threshold replaced by an automatic per-time-step segmentation, and check whether $\hat{W}_2$'s rank correlation on the top 25 still exceeds EMD's 0.70; if it does not, the reported ranking quality is tied to the hand-set threshold. A complementary check is to have a second independent panel of experts re-rank the same runs and measure the panel's rank correlation with the original reference: if human-to-human agreement is below 0.84, the metric's agreement with one expert panel cannot be read as superior ranking ability.
Extended reading notes
Core claim
The central claim is that the essential information for judging a viscous-fingering simulation lies not in the pixel geometry of the saturation field but in the number, progress, and prominence of finger tips, and that this information is carried by persistence pairs of the $x$-coordinate field on the thresholded finger set $F = f^{-1}_{-\infty}(0.12)$. Comparing these diagrams with the lifted Wasserstein metric $\hat{W}_2$ yields a ranking that agrees with expert judgment better than each of its ingredients: it reaches $\tau = 0.84$ on the top 25 runs according to each method, while $W_2$ reaches 0.29, EMD 0.70, and overlap 0.13. The paper interprets this as $\hat{W}_2$ combining the persistence sensitivity of $W_2$ with the tip-position sensitivity of EMD rather than being a simple interpolation. It also documents that velocity-oriented metrics based on distances traveled by fingers fail, because they reward slow diffuse runs or match smooth slow fronts to fast thin fingers.
Load-bearing premise
The ranking stands or falls on the assumption that every relevant finger appears as one persistence pair of the $x$-coordinate field on the thresholded set at the fixed saturation value 0.12; a finger whose tip is not a clean local maximum of $x$ on $F$ is invisible to all of the compared metrics.
Editorial extensions
If this is right
- An ensemble can be ranked automatically at run time, so engineers can focus manual inspection on the top-ranked simulations and discard implausible ones before history matching.
- The same per-time-step distance accumulation works without storing scalar fields to disk, cutting analysis time by a factor of 2.3 and data movement by five orders of magnitude in the documented case study.
- The framework is not restricted to two dimensions or to one flow model: the pipeline transfers to 3D and to other simulators, with the saturation threshold and lifting coefficients needing re-tuning.
- The absence of a clear regime in relative-permeability space among the best runs means the metric ranks outcomes but does not, by itself, identify which input parameters produce the most plausible fingers.
Reading between the lines
- Editorial inference: if the top-25 agreement survives a held-out acquisition, the same tip-weighted persistence matching should transfer to other unstable interface problems where finger-tip advancement is the physically decisive quantity, such as forced imbibition in narrow cells or miscible displacements; the paper does not test this transfer.
- Editorial inference: because the threshold 0.12 and the lifting coefficients are fixed by expert discussion, the reported superiority could be tuned to the validation set; recomputing the ranking with an automatic per-image threshold would test whether the gap over EMD and $W_2$ persists.
- Editorial inference: adding finger volume or merging events to the persistence representation is the paper's own suggested remedy for the diffuse runs that still enter the top 50 of $\hat{W}_2$; a concrete test would compare rankings with and without this augmentation on the same ensemble.
- Editorial inference: combining $d_{\hat{W}_2}$ with production and pressure mismatches during history matching may expose the relative-permeability regime that finger geometry alone does not reveal.
Signed reviews
Editorial analysis
A structured set of objections, weighed in public.
Referee Report
Summary. The paper proposes a topological data analysis (TDA) framework for ranking members of a viscous finger simulation ensemble against an X-rayacquired ground truth. Fingers are represented as persistence pairs of the x-coordinate scalar field on a thresholded sublevel set of water saturation, and several time-integrated distances between the resulting persistence diagrams are introduced: the Earth mover's distance (EMD), the 2-Wasserstein distance (W2), its geometrically lifted version (W2hat), and velocity-oriented variants based on intra-run fingerprint tracking. The distances are evaluated by comparing the induced rankings with an expert reference ranking using Kendall's tau, on 200 simulation runs and 8 matched time steps from a single slab experiment. The paper reports that W2hat achieves the best ranking agreement (tau = 0.84 on the top 25 runs), and documents an in-situ implementation that reduces data movement by five orders of magnitude and speeds up per-time-step analysis by a factor of 2.3.
Significance. If the ranking-quality claim were robustly established, this would be a practically valuable application of TDA to reservoir engineering, combining a domain-specific feature representation, a lightweight visual interface, and an in-situ deployment. The paper's strengths include a clearly specified pipeline built on the open-source Topology ToolKit, a complete case study with expert feedback, and a direct comparison of several established and novel metrics. The main quantitative claim, however, rests on a single acquisition, a single expert ranking, and expert-tuned parameters, so the significance of the measured superiority of W2hat is not yet firmly established.
major comments (4)
- [Sec. 3.1, Sec. 3.2, Sec. 4.1, Sec. 4.3] The evaluation of the proposed metrics is circular in an important sense: the saturation threshold w=0.12 (Sec. 3.1) and the lifting coefficients beta_x=10/gamma, alpha_x=alpha_y=1/rho (Sec. 3.2) are set based on discussions with experts, and the same type of expert judgment is then used to build the reference ranking against which all metrics are scored (Sec. 4.1, Table 2). Consequently, the Kendall coefficient tau=0.84 for W2hat in Sec. 4.3 is not an independent measure of ranking quality. The paper should provide evidence that the result is robust to reasonable perturbations of these parameters (e.g., a sensitivity analysis over w and the lifting coefficients), or validate the metric on an independent expert ranking or a held-out subset of runs. Without such evidence, the claim that W2hat 'manages to combine the advantages of both EMD and W2' is not fully supported.
- [Sec. 4.3, Table 2] The top-50 and top-25 Kendall coefficients are computed on the subset of runs that each method itself ranks at the top. This selection procedure biases the comparison in favor of methods whose top selections happen to coincide with the expert's ranking and makes cross-method comparison difficult. For example, a method that places a different set of runs at the top is evaluated on a different set of items. The paper should report coefficients on fixed subsets (e.g., the top 50 runs according to the expert reference) or use a rank-correlation measure that is robust to censoring, along with permutation-based or bootstrap confidence intervals.
- [Sec. 3.1] The central feature representation assumes that finger tips correspond to local maxima of the x-coordinate field on the thresholded sublevel set F = f^{-1}_{-infty}(0.12) and that the persistence of each pair equals finger length. This assumption is asserted but not validated against the manually segmented reference finger geometry FA described in Sec. 4.1. If the threshold or the x-coordinate field fails to capture finger tips (e.g., for diffuse fronts or merging fingers), all downstream metrics inherit that failure. The paper should provide quantitative or at least systematic qualitative evidence that the extracted persistence pairs correspond to the fingers that experts identify in the acquisition and in the simulations.
- [Sec. 4.3, Sec. 5] The study is a single realization: one slab, one acquisition, one expert ranking, and eight matched time steps, with no confidence intervals or uncertainty quantification on the Kendall coefficients. The conclusion itself acknowledges that the meta-parameters 'would likely need to be adjusted' in other scenarios and that automatic optimization is future work. Given this, the paper should temper the claim of 'quantitative superiority' of W2hat and clearly state that the result is a proof-of-concept on one case study rather than a demonstrated general property of the metric. At minimum, a bootstrap over the 200 runs or over ranking pairs should be added to show the stability of the reported coefficients.
minor comments (4)
- [Sec. 4.1] The overlap O(At,St) is defined as a ratio of 'volumes,' but the domain is 2D and the data are images; 'area' or 'measure' would be more precise.
- [Sec. 3.2] The notation At is used both for the acquired time step and for the acquisition sequence; this can be confusing in equations such as d_qW2(At,At+1). Please distinguish the time index from the data object.
- [Sec. 3.2] In the definition of d_qW2, the roles of nSt and nAt in the fractions 1/nSt and 1/nAt should be clarified, and the treatment of the last time step (where t+1 may not exist) should be stated explicitly.
- [Abstract and Sec. 4] The abstract says 'Extensive experiments,' but the quantitative evaluation is based on a single case study with 200 runs and one expert ranking. Consider rephrasing to 'a complete case study' or 'detailed experiments on one acquisition.'
Circularity Check
Expert-tuned metric parameters and expert-labeled reference ranking make the W2hat superiority claim partially circular.
-
fitted input called prediction
[Sec. 3.1 (isovalue w=0.12), Sec. 3.2 (lifting coefficients), Sec. 4.1 (expert ground truth), Sec. 4.3 (Kendall evaluation)]
"In our use case, based on discussions with experts, we set in practice this isovalue parameter once for all to 0.12. ... The values of these lifting parameters have been adjusted empirically based on discussions with experts. ... A reference ranking of simulations is then produced by the experts with the help of our visual interface (Sec. 3.4), and is compared to the rankings generated by the metrics proposed in our framework (Sec. 3.2)."
The W2hat ranking is a direct function of the expert-tuned saturation isovalue (w=0.12) and the expert-tuned lifting coefficients (beta_x=10/gamma, beta_y=0, alpha_x=alpha_y=1/rho). The same expert judgment used to set these inputs is then used, via the visual interface, to produce the reference ranking against which all metrics are scored in Table 2. The claim that W2hat 'achieves the best overall Kendall coefficients' therefore measures agreement with the judgment already injected into the metric. This is not a direct numerical fit: the tuning is coarse, global, and not optimized against Kendall's tau, so the circularity is partial.
full rationale
The derivation chain is mostly self-contained: representing fingers as persistence pairs of the x-coordinate field is a modeling choice, and the lifted Wasserstein distance is a standard extension (Eqs. 6-7) computed with the authors' TTK implementation, which is an algorithmic dependency rather than a load-bearing theoretical assumption. No uniqueness theorem or self-citation chain forces the result. The main circularity is that the winning metric's meta-parameters (saturation threshold and lifting coefficients) are set by expert discussions and evaluated against an expert ranking produced with the same visual interface. This is a real but partial circularity because the parameter setting is coarse and global, not a direct optimization against the Kendall target, and the baseline comparisons still carry informative failures such as diffuse runs. The top-25 Kendall coefficients in Table 2 are also computed on the subset each method itself selects, which can inflate apparent agreement, but that is an evaluation-design weakness rather than an equality-by-construction step. Overall score 4.
Assumptions & free parameters
free parameters (2)
- Saturation threshold w =
0.12
- Lifted Wasserstein coefficients alpha_x, alpha_y, beta_x, beta_y =
alpha_x=alpha_y=1/rho, beta_x=10/gamma, beta_y=0 for W2hat; beta_x=0, beta_y=10/gamma for qW2
assumptions (4)
- standard math Persistence pairings follow the Elder Rule for piecewise-linear scalar fields.
- ad hoc to paper Finger tips correspond to local maxima of the x-coordinate distance field on the thresholded sublevel set, and persistence equals finger length.
- domain assumption The expert reference ranking is a valid ground truth for simulation plausibility.
- domain assumption Time steps of simulation and acquisition correspond exactly when the injected water volume matches.
Cite this review
Pith. "Pith review of Ranking Viscous Finger Simulations to an Acquired Ground Truth with Topology-aware Matchings." pith.science (2026). https://pith.science/paper/6MKP7HNM
@misc{pith2026190807841,
  author       = {Pith},
  title        = {Pith review of: Ranking Viscous Finger Simulations to an Acquired Ground Truth with Topology-aware Matchings},
  year         = {2026},
  howpublished = {\url{https://pith.science/paper/6MKP7HNM}},
  note         = {Machine review of arXiv:1908.07841}
}
read the original abstract
This application paper presents a novel framework based on topological data analysis for the automatic evaluation and ranking of viscous finger simulation runs in an ensemble with respect to a reference acquisition. Individual fingers in a given time-step are associated with critical point pairs in the distance field to the injection point, forming persistence diagrams. Different metrics, based on optimal transport, for comparing time-varying persistence diagrams in this specific applicative case are introduced. We evaluate the relevance of the rankings obtained with these metrics, both qualitatively thanks to a lightweight web visual interface, and quantitatively by studying the deviation from a reference ranking suggested by experts. Extensive experiments show the quantitative superiority of our approach compared to traditional alternatives. Our web interface allows experts to conveniently explore the produced rankings. We show a complete viscous fingering case study demonstrating the utility of our approach in the context of porous media fluid flow, where our framework can be used to automatically discard physically-irrelevant simulation runs from the ensemble and rank the most plausible ones. We document an in-situ implementation to lighten I/O and performance constraints arising in the context of parametric studies.
Figures


Figures from the paper (7 more)


Reference graph
Works this paper leans on
-
[1]
F. O. Alpak, L. W. Lake, S. M. Embid, et al. Validation of a modi- fied carman-kozeny equation to model two-phase relative permeabili- ties. In SPE Annual Technical Conference and Exhibition. Society of Petroleum Engineers, 1999
1999
-
[2]
Ayachit, A
U. Ayachit, A. Bauer, E. P. Duque, G. Eisenhauer, N. Ferrier, J. Gu, K. E. Jansen, B. Loring, Z. Luki ´c, S. Menon, et al. Performance analysis, design considerations, and applications of extreme-scale in situ infrastructures. In SuperComputing, 2016
2016
-
[3]
Ayachit, A
U. Ayachit, A. Bauer, B. Geveci, P. O’Leary, K. Moreland, N. Fabian, and J. Mauldin. Paraview catalyst: Enabling in situ data analysis and visualization. In Proc. of the First Workshop on In Situ Infrastructures for Enabling Extreme-Scale Analysis and Vis., pp. 25–29. ACM, 2015
2015
-
[4]
Baker et al
L. Baker et al. Three-phase relative permeability correlations. In SPE Enhanced Oil Recovery Symposium, 1988
1988
-
[5]
J. C. Bennett, H. Abbasi, P. T. Bremer, R. Grout, A. Gyulassy, T. Jin, S. Klasky, H. Kolla, M. Parashar, V . Pascucci, P. Pebay, D. Thompson, H. Yu, F. Zhang, and J. Chen. Combining in-situ and in-transit processing to enable extreme-scale scientific analysis. In SC, 2012
2012
-
[6]
Bhatia, A
H. Bhatia, A. G. Gyulassy, V . Lordi, J. E. Pask, V . Pascucci, and P.-T. Bremer. Topoms: Comprehensive topological exploration for molecular and condensed-matter systems. J. of Comp. Chem., 2018
2018
-
[7]
Biasotti, D
S. Biasotti, D. Giorgio, M. Spagnuolo, and B. Falcidieno. Reeb graphs for shape analysis and applications. TCS, 2008
2008
-
[8]
A. Bock, H. Doraiswamy, A. Summers, and C. Silva. Topoangler: Interactive topology-based extraction of fishes. IEEE TVCG, 2018
2018
Show all 105 references
-
[9]
Bremer, G
P. Bremer, G. Weber, J. Tierny, V . Pascucci, M. Day, and J. Bell. Interactive exploration and analysis of large scale simulations using topology-based data segmentation. IEEE TVCG, 2011
2011
-
[10]
P. T. Bremer, G. Weber, V . Pascucci, M. Day, and J. Bell. Analyzing and tracking burning structures in lean premixed hydrogen flames. IEEE TVCG, 2010
2010
-
[11]
R. H. Brooks and A. T. Corey. Hydraulic properties of porous media and their relation to drainage design. Transactions of the ASAE, 1964
1964
-
[12]
F. M. Carlson et al. Simulation of relative permeability hysteresis to the nonwetting phase. In SPE annual technical conference and exhibition. Society of Petroleum Engineers, 1981
1981
-
[13]
H. Carr, J. Snoeyink, and U. Axen. Computing contour trees in all dimensions. Computational Geometry, 24(2):75–94, 2003
2003
-
[14]
H. Carr, J. Snoeyink, and M. van de Panne. Simplifying flexible isosurfaces using local geometric measures. In IEEE VIS, 2004
2004
-
[15]
Chazal, D
F. Chazal, D. Cohen-Steiner, M. Glisse, L. J. Guibas, and S. Oudot. Proximity of Persistence Modules and their Diagrams. In SoCG, 2009
2009
-
[16]
Chen and H.-T
C.-C. Chen and H.-T. Chu. Similarity measurement between images. In 29th Annual International Computer Software and Applications Conference (COMPSAC’05), vol. 2, pp. 41–42. IEEE, 2005
2005
-
[17]
Z. Chen, G. Huan, and B. Li. An improved IMPES method for two-phase flow in porous media. Transport in porous media, 2004
2004
-
[18]
G. L. Chierici et al. Novel relations for drainage and imbibition relative permeabilities. Soc. of Petroleum Engineers Journal, 1984
1984
-
[19]
Cohen-Steiner, H
D. Cohen-Steiner, H. Edelsbrunner, and J. Harer. Stability of persis- tence diagrams. In Symp. on Comp. Geom., pp. 263–271, 2005
2005
-
[20]
Cohen-Steiner, H
D. Cohen-Steiner, H. Edelsbrunner, J. Harer, and Y . Mileyko. Lips- chitz functions have Lp-stable persistence. Foundations of Computa- tional Mathematics, 2010
2010
-
[21]
Cohen-Steiner, H
D. Cohen-Steiner, H. Edelsbrunner, and D. Morozov. Vines and vineyards by updating persistence in linear time. In Symp. on Comp. Geom., 2006
2006
-
[22]
D. A. S. C. A. Committee. Synergistic challenges in data-intensive science and exascale computing. Technical report, DoE Advanced Scientific Computing Advisory Committee, Data Sub-committee, 2013
2013
-
[23]
A. T. Corey et al. The interrelation between gas and oil relative permeabilities. Producers monthly, 1954
1954
-
[24]
A. T. Corey, C. Rathjens, et al. Effect of stratification on relative permeability. Journal of Petroleum Technology, 8(12):69–71, 1956
1956
-
[25]
Croux and C
C. Croux and C. Dehon. Influence functions of the spearman and kendall correlation measures. Stat. Methods & Applications, 2010
2010
-
[26]
M. Cuturi. Sinkhorn distances: Lightspeed computation of optimal transport. In Proc. of NIPS, 2013
2013
-
[27]
H. Darcy. Les fontaines publiques de la ville de Dijon. 1856
-
[28]
De Floriani, U
L. De Floriani, U. Fugacci, F. Iuricich, and P. Magillo. Morse com- plexes for shape segmentation and homological analysis: discrete models and algorithms. Comp. Grap. For., 2015
2015
-
[29]
de Loubens, G
R. de Loubens, G. Vaillant, M. Regaieg, J. Yang, A. Moncorg´e, C. Fab- bri, G. Darche, et al. Numerical modeling of unstable waterfloods and tertiary polymer floods into highly viscous oils. SPE Journal, 2018
2018
-
[30]
D. A. DiCarlo, S. Akshay, M. Blunt, et al. Three-phase relative permeability of water-wet, oil-wet, and mixed-wet sandpacks. SPE Journal, 5(01):82–91, 2000
2000
-
[31]
Edelsbrunner and J
H. Edelsbrunner and J. Harer. Persistent homology – a survey. Ameri- can Mathematical Society, 2008
2008
-
[32]
Edelsbrunner and J
H. Edelsbrunner and J. Harer. Computational Topology: An Introduc- tion. American Mathematical Society, 2009
2009
-
[33]
Edelsbrunner, D
H. Edelsbrunner, D. Letscher, and A. Zomorodian. Topological per- sistence and simplification. Disc. Compu. Geom., 2002
2002
-
[34]
Fabbri, R
C. Fabbri, R. De Loubens, A. Skauge, P. Ormehaug, B. Vik, M. Bour- geois, D. Morel, G. Hamon, et al. Comparison of history-matched water flood, tertiary polymer flood relative permeabilities and evi- dence of hysteresis during tertiary polymer flood in very viscous oils. In SPE A...
2015
-
[35]
Favelier, N
G. Favelier, N. Faraj, B. Summa, and J. Tierny. Persistence atlas for critical point variability in ensembles. IEEE TVCG, 2019
2019
-
[36]
Favelier, C
G. Favelier, C. Gueunet, and J. Tierny. Visualizing ensembles of viscous fingers. In IEEE Scientific Visualization Contest, 2016
2016
-
[37]
D. H. Fenwick, M. J. Blunt, et al. Network modeling of three-phase flow in porous media. SPE Journal, 3(01):86–96, 1998
1998
-
[38]
C. H. Gao et al. Advances of polymer flood in heavy oil recovery. In SPE heavy oil conference and exhibition, 2011
2011
-
[39]
G¨oktas and ¨O
A. G¨oktas and ¨O. Isc ¸i. A comparison of the most commonly used measures of association for doubly ordered square contingency tables via simulation. Metodoloski zvezki, 8(1):17, 2011
2011
-
[40]
Guenther, R
D. Guenther, R. Alvarez-Boto, J. Contreras-Garcia, J.-P. Piquemal, and J. Tierny. Characterizing molecular interactions in chemical systems. IEEE TVCG, 20(12):2476–2485, 2014
2014
-
[41]
Gueunet, P
C. Gueunet, P. Fortin, J. Jomier, and J. Tierny. Contour forests: Fast multi-threaded augmented contour trees. In IEEE LDAV, 2016
2016
-
[42]
Gueunet, P
C. Gueunet, P. Fortin, J. Jomier, and J. Tierny. Task-based augmented merge trees with Fibonacci heaps. In IEEE LDAV, 2017
2017
-
[43]
Gyulassy, P
A. Gyulassy, P. T. Bremer, B. Hamann, and V . Pascucci. A practi- cal approach to morse-smale complex computation: Scalability and generality. IEEE TVCG, 14(6):1619–1626, 2008
2008
-
[44]
Gyulassy, D
A. Gyulassy, D. Guenther, J. A. Levine, J. Tierny, and V . Pascucci. Conforming morse-smale complexes. IEEE TVCG, 2014
2014
-
[45]
Gyulassy, A
A. Gyulassy, A. Knoll, K. Lau, B. Wang, P. Bremer, M. Papka, L. A. Curtiss, and V . Pascucci. Interstitial and interlayer ion diffusion geometry extraction in graphitic nanosphere battery materials. IEEE TVCG, 2015
2015
-
[46]
Hagoort et al
J. Hagoort et al. Oil recovery by gravity drainage.Society of Petroleum Engineers Journal, 20(03):139–150, 1980
1980
-
[47]
Heine, H
C. Heine, H. Leitte, M. Hlawitschka, F. Iuricich, L. De Floriani, G. Scheuermann, H. Hagen, and C. Garth. A survey of topology- based methods in visualization. Comp. Grap. For., 2016
2016
-
[48]
G. M. Homsy. Viscous fingering in porous media. Annual review of fluid mechanics, 19(1):271–311, 1987
1987
-
[49]
Jaure, A
S. Jaure, A. Moncorge, R. de Loubens, et al. Reservoir simulation prototyping platform for high performance computing. In SPE Large Scale Computing and Big Data Challenges in Reservoir Simulation Conference and Exhibition. Society of Petroleum Engineers, 2014
2014
-
[50]
Kantorovich
L. Kantorovich. On the translocation of masses. AS USSR, 1942
1942
-
[51]
Kasten, J
J. Kasten, J. Reininghaus, I. Hotz, and H. Hege. Two-dimensional time-dependent vortex regions based on the acceleration magnitude. IEEE TVCG, 2011
2011
-
[52]
Kerber, D
M. Kerber, D. Morozov, and A. Nigmetov. Geometry helps to compare persistence diagrams. J. Exp. Algorithmics, 2017
2017
-
[53]
Killough et al
J. Killough et al. Reservoir simulation with history-dependent satura- tion functions. Society of Petroleum Engineers Journal, 1976
1976
-
[54]
Landge, V
A. Landge, V . Pascucci, A. Gyulassy, J. Bennett, H. Kolla, J. Chen, and T. Bremer. In-situ feature extraction of large scale combustion simulations using segmented merge trees. In SuperComputing, 2014
2014
-
[55]
Lavenant, S
H. Lavenant, S. Claici, E. Chien, and J. Solomon. Dynamical optimal transport on discrete surfaces. In SIGGRAPH Asia 2018 Technical Papers, p. 250. ACM, 2018
2018
-
[56]
Leverett et al
M. Leverett et al. Capillary behavior in porous solids. Transactions of the AIME, 142(01):152–169, 1941
1941
-
[57]
Levina and P
E. Levina and P. Bickel. The earthmover’s distance is the mallows distance: some insights from statistics. In IEEE ICCV, 2001
2001
-
[58]
Luciani, A
T. Luciani, A. Burks, C. Sugiyama, J. Komperda, and G. E. Marai. Details-first, show context, overview last: Supporting exploration of viscous fingers in large-scale ensemble simulations. IEEE TVCG, 25(1):1225–1235, 2019
2019
-
[59]
Lukasczyk, G
J. Lukasczyk, G. Aldrich, M. Steptoe, G. Favelier, C. Gueunet, J. Tierny, R. Maciejewski, B. Hamann, and H. Leitte. Viscous finger- ing: A topological visual analytic approach. In Applied Mechanics and Materials, vol. 869, pp. 9–19. Trans Tech Publ, 2017
2017
-
[60]
D. J. MacAllister, K. C. Miller, S. K. Graham, C.-T. Yang, et al. Application of x-ray ct scanning to determine gas/water relative per- meabilities. SPE formation evaluation, 8(03):184–188, 1993
1993
-
[61]
G. Monge. M ´emoire sur la th ´eorie des d ´eblais et des remblais. Acad´emie Royale des Sciences de Paris, 1781
-
[62]
Moreland, R
K. Moreland, R. Oldfield, P. Marion, S. Jourdain, N. Podhorszki, V . Vishwanath, N. Fabian, C. Docan, M. Parashar, M. Hereld, M. E. Papka, and S. Klasky. Examples of in transit visualization. In Proc. of the 2nd Int. Workshop on Petascale Data Analytics: Challenges and Opportun...
2011
-
[63]
D. Morozov. Dionysus. http://www.mrzv.org/software/ dionysus, 2010. Accessed: 2016-09-15
2010
-
[64]
J. Munkres. Algorithms for the assignment and transportation prob- lems. J. of the Society for Industrial and Applied Mathematics, 1957
1957
-
[65]
J. Munkres. Topology. Pearson Education, 2014
2014
-
[66]
M. Oak, L. Baker, D. Thomas, et al. Three-phase relative permeability of berea sandstone. Journal of Petroleum Technology, 1990
1990
-
[67]
OLeary, J
P. OLeary, J. Ahrens, S. Jourdain, S. Wittenburg, D. H. Rogers, and M. Petersen. Cinema image-based in situ analysis and visualization of mpas-ocean simulations. Parallel Computing, 55:43–48, 2016
2016
-
[68]
Pascucci, G
V . Pascucci, G. Scorzelli, P. T. Bremer, and A. Mascarenhas. Robust on-line computation of Reeb graphs: simplicity and speed. ToG, 2007
2007
-
[69]
Pascucci, X
V . Pascucci, X. Tricoche, H. Hagen, and J. Tierny.Topological Data Analysis and Visualization: Theory, Algorithms and Applications . Springer, 2010
2010
-
[70]
Patacchini, R
L. Patacchini, R. De Loubens, A. Moncorge, A. Trouillaud, et al. Four-fluid-phase, fully implicit simulation of surfactant flooding. SPE Reservoir Evaluation & Engineering, 17(02):271–285, 2014
2014
-
[71]
Rasquin, P
M. Rasquin, P. Marion, V . Vishwanath, B. Matthews, M. Hereld, K. Jansen, R. Loy, A. Bauer, M. Zhou, O. Sahni, J. Fu, N. Liu, C. Carothers, M. Shephard, M. Papka, K. Kumaran, and B. Geveci. Electronic poster: Co-visualization of full data and in situ data ex- tracts from unstr...
2011
-
[72]
G. Reeb. Sur les points singuliers d’une forme de Pfaff compl`etement int´egrable ou d’une fonction num´erique. Acad. des Sci., 1946
1946
-
[73]
Riaz, G.-Q
A. Riaz, G.-Q. Tang, H. A. Tchelepi, and A. R. Kovscek. Forced imbibition in natural porous media: Comparison between experiments and continuum models. Physical Review E, 75(3):036305, 2007
2007
-
[74]
Richardson, J
J. Richardson, J. Kerver, J. Hafford, J. Osoba, et al. Laboratory determination of relative permeability. J. of Petroleum Tech., 1952
1952
-
[75]
M. Rivi, L. Calori, G. Muscianisi, and V . Slavnic. In-situ visualization: State-of-the-art and some use cases. 2011
2011
-
[76]
Robins, P
V . Robins, P. Wood, and A. Sheppard. Theory and algorithms for constructing discrete morse complexes from grayscale digital images. IEEE Trans. on Pat. Ana. and Mach. Int., 2011
2011
-
[77]
P. G. Saffman and G. I. Taylor. The penetration of a fluid into a porous medium or hele-shaw cell containing a more viscous liquid. Proceedings of the Royal Society of London. Series A. Mathematical and Physical Sciences, 245(1242):312–329, 1958
1958
-
[78]
Saikia and T
H. Saikia and T. Weinkauf. Global feature tracking and similarity estimation in time-dependent scalar fields. Comp.. Graph. For., 2017
2017
-
[79]
Santiago, M
J. Santiago, M. Claeys-Bruno, and M. Sergent. Construction of space-filling designs using wsp algorithm for high dimensional spaces. Chemometrics and Intelligent Laboratory Systems, 113:26–31, 2012
2012
-
[80]
Sharma, S
J. Sharma, S. B. Inwood, A. Kovscek, et al. Experiments and analysis of multiscale viscous fingering during forced imbibition. SPE Journal, 2012
2012
-
[81]
Shivashankar, P
N. Shivashankar, P. Pranav, V . Natarajan, R. van de Weygaert, E. P. Bos, and S. Rieder. Felix: A topology based framework for visual exploration of cosmic filaments. IEEE TVCG, 2016
2016
-
[82]
D. Silver. Object-oriented visualization. IEEE Comput. Graph. Appl., 15(3):54–62, May 1995
1995
-
[83]
Silver and X
D. Silver and X. Wang. V olume tracking. InVisualization ’96. Pro- ceedings., pp. 157–164, Oct 1996
1996
-
[84]
Silver and X
D. Silver and X. Wang. Tracking and visualizing turbulent 3d features. IEEE TVCG, 3(2):129–141, Apr 1997
1997
-
[85]
Silver and X
D. Silver and X. Wang. Tracking scalar features in unstructured data sets. In Visualization ’98. Proceedings, pp. 79–86, Oct 1998
1998
-
[86]
Silver and X
D. Silver and X. Wang. Visualizing evolving scalar phenomena. Future Generation Computer Systems, 15(1):99 – 108, 1999
1999
-
[87]
Skauge, T
A. Skauge, T. Horgen, B. Noremark, and B. Vik. Experimental studies of unstable displacement in carbonate and sandstone material. In IOR 2011-16th European Symposium on Improved Oil Recovery, 2011
2011
-
[88]
Skauge, P
A. Skauge, P. A. Ormehaug, T. Gurholt, B. Vik, I. Bondino, G. Hamon, et al. 2-d visualisation of unstable waterflood and polymer flood for displacement of heavy oil. In Improved Oil Recovery, 2012
2012
-
[89]
Skauge, K
A. Skauge, K. Sorbie, P. A. Ormehaug, and T. Skauge. Experimental and numerical modeling studies of viscous unstable displacement. In European Symposium on Improved Oil Recovery, 2009
2009
-
[90]
Skauge, B
T. Skauge, B. F. Vik, P. A. Ormehaug, B. K. Jatten, V . Kippe, I. Skjevrak, D. C. Standnes, K. Uleberg, A. Skauge, et al. Poly- mer flood at adverse mobility ratio in 2d flow by x-ray visualization. In SPE EOR Conference at Oil and Gas West Asia, 2014
2014
-
[91]
B. S. Sohn and C. Bajaj. Time-varying contour topology.IEEE TVCG, 12(1):14–25, 2006
2006
-
[92]
Soler, M
M. Soler, M. Plainchault, B. Conche, and J. Tierny. Lifted wasserstein matcher for fast and robust topology tracking. In IEEE Symposium on Large Data Analysis and Visualization, 2018
2018
-
[93]
Soler, M
M. Soler, M. Plainchault, B. Conche, and J. Tierny. Topologically controlled lossy compression. In 2018 IEEE Pacific Visualization Symposium (PacificVis), pp. 46–55. IEEE, 2018
2018
-
[94]
Solomon, F
J. Solomon, F. de Goes, G. Peyr´e, M. Cuturi, A. Butscher, A. Nguyen, T. Du, and L. J. Guibas. Convolutional wasserstein distances: efficient optimal transportation on geometric domains. ACM ToG, 2015
2015
-
[95]
Solomon, G
J. Solomon, G. Peyr´e, V . G. Kim, and S. Sra. Entropic metric align- ment for correspondence problems. ACM Trans. Graph., 2016
2016
-
[96]
S. W. Son, Z. Chen, W. Hendrix, A. Agrawal, W. k. Liao, and A. Choudhary. Data compression for the exascale computing era - survey. Supercomputing Frontiers and Innovations, 1(2), 2014
2014
-
[97]
T. Sousbie. The persistent cosmic web and its filamentary structure: Theory and implementations. Royal Astronomical Society, 2011
2011
-
[98]
Thomeer et al
J. Thomeer et al. Introduction of a pore geometrical factor defined by the capillary pressure curve. Journal of Petroleum Technology, 1960
1960
-
[99]
Tierny and H
J. Tierny and H. Carr. Jacobi fiber surfaces for bivariate Reeb space computation. IEEE TVCG, 23(1):960–969, 2016
2016
-
[100]
Tierny, G
J. Tierny, G. Favelier, J. A. Levine, C. Gueunet, and M. Michaux. The Topology ToolKit. IEEE TVCG, 24(1):832–842, 2017
2017
-
[101]
Tierny, A
J. Tierny, A. Gyulassy, E. Simon, and V . Pascucci. Loop surgery for volumetric meshes: Reeb graphs reduced to contour trees. IEEE TVCG, 15(6):1177–1184, 2009
2009
-
[102]
Trojer, M
M. Trojer, M. L. Szulczewski, and R. Juanes. Stabilizing fluid-fluid displacements in porous media through wettability alteration.Physical Review Applied, 3(5):054008, 2015
2015
-
[103]
Tsuji, F
T. Tsuji, F. Jiang, and K. T. Christensen. Characterization of immisci- ble fluid displacement processes with various capillary numbers and viscosity ratios in 3d natural sandstone. Adv. in Water Resou., 2016
2016
-
[104]
Whitaker
S. Whitaker. Flow in porous media i: A theoretical derivation of darcy’s law.Transport in porous media, 1(1):3–25, 1986
1986
-
[105]
H. Yu, C. Wang, R. W. Grout, J. H. Chen, and K. L. Ma. In situ visualization for large-scale combustion simulations. IEEE Computer Graphics and Applications, 30(3):45–57, May 2010
2010
Reviewed August 14, 2026 · model on record in the stance chip above.
Discussion (0). Continue with ORCID to comment.