REVIEW 5 major objections 5 minor 80 references
Dual Photonics Probing of Nano- to Submicron-Scale Structural Alterations in Human Brain Tissues or Cells and Chromatin or DNA with the Progression of Alzheimers Disease
T0 review · 5 major / 5 minor · reviewed 2026-08-11 · deepseek-v4-flash
Pith's one-line read This paper claims that two photonic measurements can quantify progressive nanoscale structural disorder in Alzheimer's brain tissue, with disorder strength rising from early to severe stages.
desk verdict PWS staging of human AD hippocampus is a credible new result; the DNA-level IPR claim needs a dye control before it can be taken at face value. read the letter →
The pith
A machine-rendered reading of the paper's core claim, the machinery that carries it, and where it could break.
The reading
What carries the argument
The load-bearing object is the disorder strength $L_d$, defined as the product of refractive-index variance and correlation length, $L_d=\langle \Delta n^2\rangle l_c$, measured by PWS from the statistics of backscattered light. For DNA/chromatin, the paper constructs a disordered optical lattice from DAPI confocal intensity through the proportionality $n(x,y)=n_0+dn=\rho_{ms0}+\beta\rho_{ms}(x,y)$ with $n\propto M\propto I$, then diagonalizes a tight-binding Hamiltonian with on-site disorder and computes the inverse participation ratio of its eigenfunctions; the average and standard deviation of $\langle \mathrm{IPR}\rangle$ are taken to be proportional to $L_d=\langle\Delta n\rangle l_c$. This machinery converts a fluorescence image into a quantum-localization statistic that quantifies how strongly intensity fluctuations are localized.
What would settle it
Measure the same DAPI-stained AD and control nuclei with an independent mass-density-sensitive method such as electron microscopy or quantitative phase imaging and compare the disorder strengths: if the fluorescence-based IPR rises while the independently measured mass-density disorder does not, the central DNA claim is falsified.
Extended reading notes
Core claim
The central claim is that Alzheimer's disease produces a measurable, stage-dependent rise in structural disorder at the nano-to-submicron scale in human brain tissue and in the DNA/chromatin inside cell nuclei. Using backscattered light spectra, the authors compute the disorder strength $L_d=\langle \Delta n^2\rangle l_c$ and find it increases monotonically from control through low, intermediate, and severe AD; using confocal fluorescence as a proxy for mass density, they build a disordered optical lattice and compute the inverse participation ratio, finding a 50% higher $L_d$-IPR in AD nuclei. The optical increases are corroborated by elevated amyloid-$\beta$ immunostaining and a 131% rise in $\gamma$-H2A.X-marked DNA double-strand breaks, which the paper interprets as direct evidence that the optical signal tracks molecular damage in the diseased brain.
Load-bearing premise
The DNA/chromatin conclusion depends on DAPI fluorescence intensity being proportional to local molecular mass density ($n\propto M\propto I$) and on micrographs being chosen by the largest intensity change, so if the fluorescence variation is a staining or selection artifact rather than a mass-density change, the IPR increase would not establish DNA structural disorder.
Editorial extensions
If this is right
- If the reported trends are correct, $L_d$-PWS could serve as a quantitative staging biomarker for Alzheimer's disease in hippocampal tissue, separating low, intermediate, and severe cases from controls.
- The confocal-IPR pipeline could be applied to DAPI-stained sections from other brain regions or other neurodegenerative diseases without new staining protocols.
- The co-occurrence of increased optical disorder and increased double-strand breaks suggests that nanoscale structural disorganization and DNA damage are linked features of Alzheimer's progression.
- Because PWS is sensitive to changes below the optical diffraction limit, these metrics could support earlier detection if validated on larger prospective cohorts.
Reading between the lines
- A testable extension would be to run the same confocal-IPR analysis on DAPI-stained sections from Parkinson's or frontotemporal dementia cases to see whether the 50% disorder increase is Alzheimer's-specific or a common neurodegeneration signature.
- If the $n\propto M\propto I$ mapping holds, IPR and PWS could be applied to the same biopsy as independent readouts of chromatin packing versus whole-cell refractive-index disorder, and their disagreement might reveal which cellular compartment drives the signal.
- The stage dependence of $L_d$-PWS could be converted into a diagnostic threshold, but only after controlling for post-mortem interval, fixation, and sectioning variability in a larger cohort.
Signed reviews
Editorial analysis
A structured set of objections, weighed in public.
Referee Report
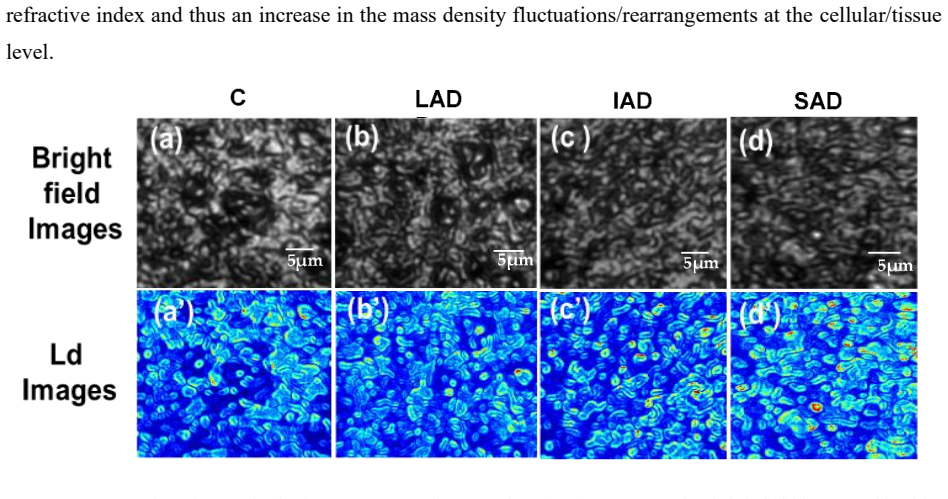
Summary. The manuscript reports a dual photonics approach for detecting nano- to submicron-scale structural alterations in human hippocampus tissue and in nuclear DNA/chromatin across stages of Alzheimer's disease. Partial wave spectroscopy (PWS) is used to estimate refractive-index fluctuation disorder strength, and a confocal-imaging-based inverse participation ratio (IPR) analysis is applied to DAPI-stained nuclei to infer DNA/chromatin mass-density disorder. The authors report stage-dependent increases in average Ld-PWS of 6% (LAD), 23% (IAD), and 61% (SAD) relative to control, increases in the standard deviation of Ld-PWS of 4.2%, 29%, and 72%, a 50% increase in average Ld-IPR for AD versus control, a 43% increase in its standard deviation, and a 131% increase in DNA double-strand breaks measured by γ-H2A.X ELISA. The AD stages were assigned by pathologists before the optical measurements, and the optical metrics are compared between stage groups and controls.
Significance. If the central claims are correct, the paper would provide a potentially useful optical biomarker pair for AD staging: PWS gives a stage-wise monotonic tissue-level disorder measure, and IPR links nuclear DNA/chromatin disorder to a biochemical DNA-damage endpoint. The study uses human postmortem hippocampus samples, includes independent Aβ and DNA-damage assays, reports large effect sizes with t-test p-values, and builds on an established PWS literature. The main limitations are reproducibility-related: the calibration constant in the PWS formula is not specified, the DAPI-intensity-to-mass-density mapping is asserted rather than validated, the confocal image selection is subjective, and the IPR computation requires unstated parameters. These issues do not necessarily invalidate the tissue-level PWS trend, but they currently prevent the DNA/chromatin-level claim from being accepted as established.
major comments (5)
- [§4.2.2, Eq. (1)] The calibration constant B in Eq. (1) is never specified, and no calibration procedure is described. Because Ld-PWS is computed from B, n0, and the measured spectra, the absolute values of the reported disorder strengths cannot be reproduced or compared across laboratories; the authors should state the value of B, how it was determined, and whether it was held fixed across all samples and stages. Without this, the reported 6%, 23%, and 61% increases are not independently verifiable from the manuscript alone.
- [§4.3.2, Eq. (3)] The DNA/chromatin-level IPR claim rests entirely on the assumption that DAPI confocal intensity is proportional to local DNA molecular mass density, expressed as n(x,y) = n0 + dn = rho_ms0 + beta*rho_ms and n ∝ M ∝ I. DAPI fluorescence is known to depend on AT base-pair content, DNA conformation, and chromatin accessibility, not simply on total DNA mass; dye penetration, bleaching, and optical path differences in fixed tissue further decouple intensity from mass. The manuscript provides no validation of this mapping, such as a sequence-independent DNA dye, an independent mass-density measurement, or a calibration control. If this assumption fails, the reported 50% increase in Ld-IPR does not establish increased DNA/chromatin structural disorder, so this is a load-bearing point that must be addressed with experimental controls or explicit quantitative justification.
- [§4.3.1] The confocal micrograph selection criterion is stated as 'Selection of the micrographs depended on the most change in the stack based on acquisition of the best coverage of the nuclear area.' This is subjective and can bias the IPR comparison upward if AD samples are more likely to have large intensity fluctuations in some z-planes. The authors should specify a predefined, blinded, or fully automated selection rule, or alternatively analyze all z-slices and show that the result is robust to the selection procedure.
- [§4.3.2, Eqs. (3)-(6)] The IPR computation depends on the tight-binding hopping amplitude t, the lattice spacing a, the total number of eigenfunctions N = (L/a)^2, and the normalization of dI/I0, but none of these are specified in the methods. Without these parameters, the computation cannot be reproduced, and the reported 50% average increase and 43% standard-deviation increase in Ld-IPR cannot be checked. The authors should state all numerical parameters used in the Hamiltonian and in the IPR averaging, and ideally provide the analysis code or processed data.
- [Figures 2, 4, and 6] The sample size is reported only as 'N = 10' in the figure captions, without specifying whether N refers to patients, tissue sections, nuclei, or optical fields. This ambiguity matters because PWS and IPR involve multiple pixels or nuclei per sample, and the effective statistical independence of the measurements determines whether the t-test is valid. The authors should clarify the unit of N, report the number of nuclei/z-stacks analyzed, and provide effect sizes or confidence intervals in addition to p-values.
minor comments (5)
- [Abstract and throughout] The text contains typographical inconsistencies, such as 'Alzheimers' in the abstract and inconsistent use of 'Ld' versus 'Ld-PWS' and 'Ld-IPR' across sections; a careful copyedit is needed.
- [§2.2 and Figure 4 caption] The length scale is written inconsistently as '165 nm65 nm' and 'L × L (165 nm65 nm)'; it should read '165 nm × 165 nm' or similar.
- [§4.3.2, Eq. (1) formatting] Equation (1) is typeset ambiguously: '2𝑘2' should be written as '2k^2' or '2k²' and the denominator should be clearly grouped, preferably as (Δk)², so that the relation between (Δk)² and ln(C(Δk)) is unambiguous.
- [Data Availability Statement] The statement 'The data may be available upon request to the corresponding author' is vague; the authors should deposit processed numerical values (mean and standard deviation of Ld-PWS and Ld-IPR per sample) in a public repository or at least provide them in a supplementary table, and should state whether analysis code is available.
- [References] Reference 38 is missing author names and page information, and several references are not formatted consistently; these should be corrected for completeness.
Circularity Check
PWS tissue-level result is self-contained; the DNA/chromatin 'disorder' claim relies on a same-group citation chain and a definitional IPR-to-disorder proportionality.
-
self citation load bearing
[Section 4.3.2, Eqs. (5)-(6), supported by refs. [35,76]]
"It has been reported that the average and the standard deviation of the < IPR> value are correlated to the degree of structural disorder, which can be written as follows: Average〈𝐼𝑃𝑅〉 ∝ 𝐿𝑑−𝐼𝑃𝑅 =< ∆𝑛 >× 𝑙𝑐 (5) std〈𝐼𝑃𝑅〉 ∝ 𝐿𝑑−𝐼𝑃𝑅 =< ∆𝑛 >× 𝑙𝑐 (6)"
The paper's DNA/chromatin conclusion is that AD shows 'an increase in the degree of structural disorder Ld-IPR,' but Eqs. (5)-(6) set Ld-IPR proportional to the very <IPR> values measured from the DAPI confocal images. The only support offered for this proportionality is the phrase 'It has been reported...' citing refs. [35,76], whose author lists overlap with the present paper (Pradhan, Adhikari, Alharthi, Shukla). No independent calibration of IPR against an orthogonal measure of DNA/chromatin disorder is provided in this manuscript.
full rationale
The paper is mostly a direct optical measurement study. AD stage labels were assigned by pathologists before the optical measurements, and no classifier or parameter was fitted to those labels, so there is no fitted-input-called-prediction circularity. The PWS tissue-level result is self-contained: Ld-PWS is computed from the measured spectral autocorrelation of backscattered light (Eqs. 1-2) and then compared across pathologist-defined groups; that part does not reduce to its inputs. The circularity burden is concentrated in the IPR-based DNA/chromatin claim. The quantity reported as 'structural disorder' (Ld-IPR) is asserted to be proportional to the very <IPR> values computed from the confocal images (Eqs. 5-6), and the authority for that assertion is prior work by the same research group ([35,76]). The DAPI-intensity-to-mass-density mapping (Eq. 3: n ∝ M ∝ I) is a physical assumption that would need independent validation; that is a correctness/validity risk rather than a circular step, so it is not scored here as circularity. Weighing these considerations, the central tissue-level PWS claim has independent empirical content, while the DNA/chromatin-level disorder metric is partly definitional and self-cited. A score of 4 reflects 'some self-citation; central claim still has independent content.'
Assumptions & free parameters
free parameters (3)
- PWS calibration constant B =
not specified
- tight-binding hopping amplitude t =
not specified
- Butterworth filter cutoff frequency =
not specified
assumptions (6)
- domain assumption Thin tissue is a weakly disordered medium whose backscattered light can be decomposed into independent 1D channels described by mesoscopic light transport theory.
- domain assumption DAPI fluorescence intensity is proportional to local DNA molecular mass density, and refractive index is proportional to intensity: n(x,y) = n0 + dn(x,y) = rho_ms0 + beta*rho_ms(x,y), with n proportional M proportional I.
- domain assumption Average and standard deviation of IPR are proportional to the disorder strength Ld-IPR = <Delta n> x lc (Eqs. 5 and 6).
- domain assumption The Anderson tight-binding model for a two-dimensional optical lattice, with diagonal disorder epsilon_i from local refractive index fluctuations, describes DNA/chromatin structure in cell nuclei.
- domain assumption Pathologist-assigned AD stage categories (LAD, IAD, SAD) from the Michigan Brain Bank are accurate clinical classifications.
- domain assumption n0 = 1.38 is a valid average refractive index for brain tissue in the PWS calculation.
Cite this review
Pith. "Pith review of Dual Photonics Probing of Nano- to Submicron-Scale Structural Alterations in Human Brain Tissues or Cells and Chromatin or DNA with the Progression of Alzheimers Disease." pith.science (2026). https://pith.science/paper/6MNLI5WO
@misc{pith2026241214651,
  author       = {Pith},
  title        = {Pith review of: Dual Photonics Probing of Nano- to Submicron-Scale Structural Alterations in Human Brain Tissues or Cells and Chromatin or DNA with the Progression of Alzheimers Disease},
  year         = {2026},
  howpublished = {\url{https://pith.science/paper/6MNLI5WO}},
  note         = {Machine review of arXiv:2412.14651}
}
read the original abstract
Understanding alterations in structural disorders in tissue or cells or building blocks, such as DNA or chromatin in the human brain, at the nano to submicron level provides us with efficient biomarkers for Alzheimers detection. Here, we report a dual photonics technique to detect nano- to submicron-scale alterations in brain tissues or cells and DNA or chromatin due to the early to late progression of Alzheimers disease in humans. Using a recently developed mesoscopic light transport technique, fine-focused nano-sensitive partial wave spectroscopy (PWS), we measure the degree of structural disorder in tissues. Furthermore, the chemical-specific inverse participation ratio technique (IPR) was used to measure the DNA or chromatin structural alterations. The results of the PWS and IPR experiments showed a significant increase in the degree of structural disorder at the nano to submicron scale at different stages of AD relative to their controls for both the tissue or cell and DNA cellular levels. The increase in the structural disorder in cells or tissues and DNA or chromatin in the nuclei can be attributed to higher mass density fluctuations in the tissue and DNA or chromatin damage in the nuclei caused by the rearrangements of macromolecules due to the deposition of the amyloid beta protein and damage in DNA or chromatin with the progress of AD.
Figures


Figures from the paper (1 more)

Reference graph
Works this paper leans on
-
[1]
Microscopic Origin of Light Scattering in Tissue
Popp, A.K.; Valentine, M.T.; Kaplan, P.D.; Weitz, D.A. Microscopic Origin of Light Scattering in Tissue. Appl. Opt. 2003, 42, 2871–2880. https://doi.org/10.1364/AO.42.002871
-
[2]
Light Scatter Spectroscopy and Imaging of Cellular and Subcellular Events
Boustany, N.N.; Thakor, N.V . Light Scatter Spectroscopy and Imaging of Cellular and Subcellular Events. In Biomedical Photonics: Handbook; CRC Press: Boca Raton, FL, USA, 2003; p. 16
work page 2003
-
[3]
Light Scattering from Cells: Finite-Difference Time- Domain Simulations and Goniometric Measurements
Drezek, R.; Dunn, A.; Richards-Kortum, R. Light Scattering from Cells: Finite-Difference Time- Domain Simulations and Goniometric Measurements. Appl. Opt. 1999, 38, 3651–3661. https://doi.org/10.1364/AO.38.003651
-
[4]
Overview of Single-Cell Elastic Light Scattering Techniques
Kinnunen, M.; Karmenyan, A. Overview of Single-Cell Elastic Light Scattering Techniques. JBO 2015, 20, 051040. https://doi.org/10.1117/1.JBO.20.5.051040
-
[5]
Refractive Index of Biological Tissues: Review, Measurement Techniques, and Applications
Khan, R.; Gul, B.; Khan, S.; Nisar, H.; Ahmad, I. Refractive Index of Biological Tissues: Review, Measurement Techniques, and Applications. Photodiagnosis Photodyn. Ther. 2021, 33, 102192. https://doi.org/10.1016/j.pdpdt.2021.102192
arXiv 2021
-
[6]
Raman Scattering: From Structural Biology to Medical Applications
Vlasov, A.V .; Maliar, N.L.; Bazhenov, S.V .; Nikelshparg, E.I.; Brazhe, N.A.; Vlasova, A.D.; Osipov, S.D.; Sudarev, V .V .; Ryzhykau, Y .L.; Bogorodskiy, A.O.; et al. Raman Scattering: From Structural Biology to Medical Applications. Crystals 2020, 10, 38. https://doi.org/10.3390/cryst10010038
-
[7]
Cell Refractive Index for Cell Biology and Disease Diagnosis: Past, Present and Future
Liu, P.Y .; Chin, L.K.; Ser, W.; Chen, H.F.; Hsieh, C.-M.; Lee, C.-H.; Sung, K.-B.; Ayi, T.C.; Yap, P.H.; Liedberg, B.; et al. Cell Refractive Index for Cell Biology and Disease Diagnosis: Past, Present and Future. Lab Chip 2016, 16, 634–644. https://doi.org/10.1039/C5LC01445J
-
[8]
Losa, G.A. The Fractal Geometry of Life. Riv. Biol. 2009, 102, 29–59
work page 2009
Show all 80 references
-
[9]
Measuring the Refractive Index of Bovine Corneal Stromal Cells Using Quantitative Phase Imaging
Gardner, S.J.; White, N.; Albon, J.; Knupp, C.; Kamma-Lorger, C.S.; Meek, K.M. Measuring the Refractive Index of Bovine Corneal Stromal Cells Using Quantitative Phase Imaging. Biophys. J. 2015, 109, 1592–1599. https://doi.org/10.1016/j.bpj.2015.08.046
2015 doi
-
[10]
Light-Scattering Methods for Tissue Diagnosis
Steelman, Z.A.; Ho, D.S.; Chu, K.K.; Wax, A. Light-Scattering Methods for Tissue Diagnosis. Optica 2019, 6, 479–489. https://doi.org/10.1364/OPTICA.6.000479
2019 doi
-
[11]
Fractal Dimension Analyses to Detect Alzheimer’s and Parkinson’s Diseases Using Their Thin Brain Tissue Samples via Transmission Optical Microscopy
Apachigawo, I.; Solanki, D.; Tate, R.; Singh, H.; Khan, M.M.; Pradhan, P. Fractal Dimension Analyses to Detect Alzheimer’s and Parkinson’s Diseases Using Their Thin Brain Tissue Samples via Transmission Optical Microscopy. Biophysica 2023, 3, 569–581. https://doi.org/10.3390/b...
2023 doi
-
[12]
Differential Light Scattering: A Physical Method for Identifying Living Bacterial Cells
Wyatt, P.J. Differential Light Scattering: A Physical Method for Identifying Living Bacterial Cells. Appl. Opt. 1968, 7, 1879–1896. https://doi.org/10.1364/AO.7.001879
1968 doi
-
[13]
Microscopic Imaging and Spectroscopy with Scattered Light
Boustany, N.N.; Boppart, S.A.; Backman, V. Microscopic Imaging and Spectroscopy with Scattered Light. Annu. Rev. Biomed. Eng. 2010, 12, 285–314. https://doi.org/10.1146/annurev-bioeng-061008- 124811
2010 doi
-
[14]
Partial-Wave Microscopic Spectroscopy Detects Subwavelength Refractive Index Fluctuations: An Application to Cancer Diagnosis
Subramanian, H.; Pradhan, P.; Liu, Y .; Capoglu, I.R.; Rogers, J.D.; Roy, H.K.; Brand, R.E.; Backman, V. Partial-Wave Microscopic Spectroscopy Detects Subwavelength Refractive Index Fluctuations: An Application to Cancer Diagnosis. Opt. Lett. 2009, 34, 518–520. https://doi.org...
2009 doi
-
[15]
Quantification in Tissue near–Infrared Spectroscopy
Chance, B.; Cooper, C.E.; Delpy, D.T.; Reynolds, E.O.R.; Delpy, D.T.; Cope, M. Quantification in Tissue near–Infrared Spectroscopy. Philos. Trans. R. Soc. London. Ser. B Biol. Sci. 1997, 352, 649–
1997
-
[16]
Polarized Light Spatial Frequency Domain Imaging for Non-Destructive Quantification of Soft Tissue Fibrous Structures
Yang, B.; Lesicko, J.; Sharma, M.; Hill, M.; Sacks, M.S.; Tunnell, J.W. Polarized Light Spatial Frequency Domain Imaging for Non-Destructive Quantification of Soft Tissue Fibrous Structures. Biomed. Opt. Express 2015, 6, 1520–1533. https://doi.org/10.1364/BOE.6.001520
2015 doi
-
[17]
Using FDTD to Improve Our Understanding of Partial Wave Spectroscopy for Advancing Ultra Early-Stage Cancer Detection Techniques
Simpson, J.J.; Capoglu, I.R.; Backman, V. Using FDTD to Improve Our Understanding of Partial Wave Spectroscopy for Advancing Ultra Early-Stage Cancer Detection Techniques. In Proceedings of the 2009 13th International Symposium on Antenna Technology and Applied Electromagnetic...
2009
-
[18]
Multiscale Optical Phase Fluctuations Link Disorder Strength and Fractal Dimension of Cell Structure
Rancu, A.; Chen, C.X.; Price, H.; Wax, A. Multiscale Optical Phase Fluctuations Link Disorder Strength and Fractal Dimension of Cell Structure. Biophys. J. 2023, 122, 1390–1399. https://doi.org/10.1016/j.bpj.2023.03.005
2023 doi
-
[19]
Qualitative Disorder Measurements from Backscattering Spectra through an Optical Fiber
Fernández, R.; Marcos-Vidal, A.; Gallego, S.; Beléndez, A.; Desco, M.; Ripoll, J. Qualitative Disorder Measurements from Backscattering Spectra through an Optical Fiber. Biomed. Opt. Express 2020, 11,
2020
-
[20]
Optical Probing of Spatial Structural Abnormalities in Cells/Tissues Due to Cancer, Drug- Effect, and Brain Abnormalities Using Mesoscopic Physics-Based Spectroscopic Techniques
Adhikari, P. Optical Probing of Spatial Structural Abnormalities in Cells/Tissues Due to Cancer, Drug- Effect, and Brain Abnormalities Using Mesoscopic Physics-Based Spectroscopic Techniques. Ph.D. Thesis, Mississippi State University, Starkville, MS, USA, 2021, https://doi.or...
2021 doi
-
[21]
The Physics of Cancer: The Role of Epigenetics and Chromosome Conformation in Cancer Progression
Naimark, O.B.; Nikitiuk, A.S.; Baudement, M.-O.; Forné, T.; Lesne, A. The Physics of Cancer: The Role of Epigenetics and Chromosome Conformation in Cancer Progression. AIP Conf. Proc. 2016, 1760, 020051. https://doi.org/10.1063/1.4960270
2016 doi
-
[22]
Reflective Mesoscopic Spectroscopy for Noninvasive Detection of Reflective Index Alternations at Nano-Scale
Tao, Y .; Ding, Z. Reflective Mesoscopic Spectroscopy for Noninvasive Detection of Reflective Index Alternations at Nano-Scale. J. Phys. Conf. Ser. 2011, 277, 012035. https://doi.org/10.1088/1742- 6596/277/1/012035
2011 doi
-
[23]
Optical Methodology for Detecting Histologically Unapparent Nanoscale Consequences of Genetic Alterations in Biological Cells
Subramanian, H.; Pradhan, P.; Liu, Y .; Capoglu, I.R.; Li, X.; Rogers, J.D.; Heifetz, A.; Kunte, D.; Roy, H.K.; Taflove, A.; et al. Optical Methodology for Detecting Histologically Unapparent Nanoscale Consequences of Genetic Alterations in Biological Cells. Proc. Natl. Acad. ...
2008 doi
-
[24]
Optical Study of Stress Hormone-Induced Nanoscale Structural Alteration in Brain Using Partial Wave Spectroscopic Microscopy
Bhandari, S.; Shukla, P.K.; Almabadi, H.M.; Sahay, P.; Rao, R.; Pradhan, P. Optical Study of Stress Hormone-Induced Nanoscale Structural Alteration in Brain Using Partial Wave Spectroscopic Microscopy. J. Biophotonics 2019, 12, e201800002. https://doi.org/10.1002/jbio.201800002
2019 doi
-
[25]
Spatial Light Interference Microscopy: Principle and Applications to Biomedicine
Chen, X.; Kandel, M.E.; Popescu, G. Spatial Light Interference Microscopy: Principle and Applications to Biomedicine. Adv. Opt. Photon. 2021, 13, 353–425. https://doi.org/10.1364/AOP.417837
2021 doi
-
[26]
Spatial Frequency Metrics for Analysis of Microscopic Images of Musculoskeletal Tissues
Forouhesh Tehrani, K.; Pendleton, E.G.; Southern, W.M.; Call, J.A.; Mortensen, L.J. Spatial Frequency Metrics for Analysis of Microscopic Images of Musculoskeletal Tissues. Connect. Tissue Res. 2021, 62, 4–14. https://doi.org/10.1080/03008207.2020.1828381
2021
-
[27]
Correlating Colorectal Cancer Risk with Field Carcinogenesis Progression Using Partial Wave Spectroscopic Microscopy
Gladstein, S.; Damania, D.; Almassalha, L.M.; Smith, L.T.; Gupta, V .; Subramanian, H.; Rex, D.K.; Roy, H.K.; Backman, V. Correlating Colorectal Cancer Risk with Field Carcinogenesis Progression Using Partial Wave Spectroscopic Microscopy. Cancer Med. 2018, 7, 2109–2120. https...
2018 doi
-
[28]
High-Speed Spectral Nanocytology for Early Cancer Screening
Chandler, J.E.; Subramanian, H.; Maneval, C.D.; White, C.A.; M.d, R.M.L.; Backman, V. High-Speed Spectral Nanocytology for Early Cancer Screening. JBO 2013, 18, 117002. https://doi.org/10.1117/1.JBO.18.11.117002
2013 doi
-
[29]
Nanoscale Markers of Esophageal Field Carcinogenesis: Potential Implications for Esophageal Cancer Screening
Konda, V .J.; Cherkezyan, L.; Subramanian, H.; Wroblewski, K.; Damania, D.; Becker, V .; Gonzalez, M.H.R.; Koons, A.; Goldberg, M.; Ferguson, M.K.; et al. Nanoscale Markers of Esophageal Field Carcinogenesis: Potential Implications for Esophageal Cancer Screening. Endoscopy 20...
2013
-
[30]
Role of Cytoskeleton in Controlling the Disorder Strength of Cellular Nanoscale Architecture
Damania, D.; Subramanian, H.; Tiwari, A.K.; Stypula, Y .; Kunte, D.; Pradhan, P.; Roy, H.K.; Backman, V. Role of Cytoskeleton in Controlling the Disorder Strength of Cellular Nanoscale Architecture. Biophys. J. 2010, 99, 989–996. https://doi.org/10.1016/j.bpj.2010.05.023
2010 doi
-
[31]
Label-Free Imaging of the Native, Living Cellular Nanoarchitecture Using Partial-Wave Spectroscopic Microscopy
Almassalha, L.M.; Bauer, G.M.; Chandler, J.E.; Gladstein, S.; Cherkezyan, L.; Stypula-Cyrus, Y .; Weinberg, S.; Zhang, D.; Thusgaard Ruhoff, P.; Roy, H.K.; et al. Label-Free Imaging of the Native, Living Cellular Nanoarchitecture Using Partial-Wave Spectroscopic Microscopy. Pr...
2016 doi
-
[32]
Identification of Malignancy-Associated Change in Buccal Mucosa with Partial Wave Spectroscopy (PWS): A Potential Biomarker for Lung Cancer Risk
Hensing, T.A.; Subramanian, H.; Roy, H.K.; Breault, D.; Bogojevic, Z.; Ray, D.; Hasabou, N.; Backman, V. Identification of Malignancy-Associated Change in Buccal Mucosa with Partial Wave Spectroscopy (PWS): A Potential Biomarker for Lung Cancer Risk. JCO 2008, 26, 11045. https...
2008 doi
-
[33]
Measuring Nanoscale Chromatin Heterogeneity with Partial Wave Spectroscopic Microscopy
Gladstein, S.; Stawarz, A.; Almassalha, L.M.; Cherkezyan, L.; Chandler, J.E.; Zhou, X.; Subramanian, H.; Backman, V. Measuring Nanoscale Chromatin Heterogeneity with Partial Wave Spectroscopic Microscopy. In Cellular Heterogeneity: Methods and Protocols; Barteneva, N.S., V oro...
2018
-
[34]
Quantification of Photonic Localization Properties of Targeted Nuclear Mass Density Variations: Application in Cancer-Stage Detection
Sahay, P.; Ganju, A.; Almabadi, H.M.; Ghimire, H.M.; Yallapu, M.M.; Skalli, O.; Jaggi, M.; Chauhan, S.C.; Pradhan, P. Quantification of Photonic Localization Properties of Targeted Nuclear Mass Density Variations: Application in Cancer-Stage Detection. J. Biophotonics 2018, 11...
2018 doi
-
[35]
Photonics Probing of Pup Brain Tissue and Molecular-Specific Nuclear Nanostructure Alterations Due to Fetal Alcoholism via Light Scattering/Localization Approaches
Adhikari, P.; Shukla, P.K.; Alharthi, F.; Bhandari, S.; Meena, A.S.; Rao, R.; Pradhan, P. Photonics Probing of Pup Brain Tissue and Molecular-Specific Nuclear Nanostructure Alterations Due to Fetal Alcoholism via Light Scattering/Localization Approaches. JBO 2022, 27, 076002. ...
2022 doi
-
[36]
Chemical and Immunological Heterogeneity of Fibrillar Amyloid in Plaques of Alzheimer’s Disease and Down’s Syndrome Brains Revealed by Confocal Microscopy
Schmidt, M.L.; Robinson, K.A.; Lee, V .M.; Trojanowski, J.Q. Chemical and Immunological Heterogeneity of Fibrillar Amyloid in Plaques of Alzheimer’s Disease and Down’s Syndrome Brains Revealed by Confocal Microscopy. Am. J. Pathol. 1995, 147, 503–515
1995
-
[37]
Chronic Stress and Corticosterone Exacerbate Alcohol-Induced Tissue Injury in the Gut-Liver-Brain Axis
Shukla, P.K.; Meena, A.S.; Dalal, K.; Canelas, C.; Samak, G.; Pierre, J.F.; Rao, R. Chronic Stress and Corticosterone Exacerbate Alcohol-Induced Tissue Injury in the Gut-Liver-Brain Axis. Sci. Rep. 2021, 11, 826. https://doi.org/10.1038/s41598-020-80637-y
2021 doi
-
[38]
Available online: https://onlinelibrary.wiley.com/doi/abs/10.1002/jbio.201500298 (accessed on 29 September 2024)
Colocalization of Cellular Nanostructure Using Confocal Fluorescence and Partial Wave Spectroscopy—Chandler—2017—Journal of Biophotonics—Wiley Online Library. Available online: https://onlinelibrary.wiley.com/doi/abs/10.1002/jbio.201500298 (accessed on 29 September 2024)
2017 doi
-
[39]
Nanoscale Imaging of Chromatin with Labeled and Label-Free Super- Resolution Microscopy and Partial-Wave Spectroscopy
Eshein, A.; Li, Y .; Zhou, X.; Spicer, G.; Nguyen, T.-Q.; Almassalha, L.M.; Chandler, J.E.; Gladstein, S.; Dong, B.; Sun, C.; et al. Nanoscale Imaging of Chromatin with Labeled and Label-Free Super- Resolution Microscopy and Partial-Wave Spectroscopy. In Proceedings of the Bio...
2018
-
[40]
Alzheimer’ s Dement
2023 Alzheimer’s Disease Facts and Figures. Alzheimer’ s Dement. 2023, 19, 1598–1695. https://doi.org/10.1002/alz.13016
2023 doi
-
[41]
Available online: https://alz- journals.onlinelibrary.wiley.com/doi/epdf/10.1002/alz.12638 (accessed on 26 September 2023)
2022 Alzheimer’s Disease Facts and Figures. Available online: https://alz- journals.onlinelibrary.wiley.com/doi/epdf/10.1002/alz.12638 (accessed on 26 September 2023)
2022 doi
-
[42]
Clinical Features of Alzheimer’s Disease
Förstl, H.; Kurz, A. Clinical Features of Alzheimer’s Disease. Eur. Arch. Psychiatry Clin. Neurosci. 1999, 249, 288–290. https://doi.org/10.1007/s004060050101
1999 doi
-
[43]
Alzheimer’s Disease
Querfurth, H.W.; LaFerla, F.M. Alzheimer’s Disease. N. Engl. J. Med. 2010, 362, 329–344. https://doi.org/10.1056/NEJMra0909142
2010 doi
-
[44]
Available online: https://www.mdpi.com/2076- 3425/12/9/1237 (accessed on 28 September 2024)
Alzheimer’s Disease and Inflammaging. Available online: https://www.mdpi.com/2076- 3425/12/9/1237 (accessed on 28 September 2024)
2024
-
[45]
Is Alzheimer’s Disease an Infectious Neurological Disease? A Review of the Literature
Uwishema, O.; Mahmoud, A.; Sun, J.; Correia, I.F.S.; Bejjani, N.; Alwan, M.; Nicholas, A.; Oluyemisi, A.; Dost, B. Is Alzheimer’s Disease an Infectious Neurological Disease? A Review of the Literature. Brain Behav. 2022, 12, e2728. https://doi.org/10.1002/brb3.2728
2022 doi
-
[46]
Ranking of Alzheimer’s Disease and Related Dementia among the Leading Causes of Death in the US Varies Depending on NCHS or WHO Definitions
Tai, S.-Y .; Chi, Y.-C.; Lo, Y.-T.; Chien, Y.-W.; Kwachi, I.; Lu, T.-H. Ranking of Alzheimer’s Disease and Related Dementia among the Leading Causes of Death in the US Varies Depending on NCHS or WHO Definitions. Alzheimer’ s Dement. Diagn. Assess. Dis. Monit. 2023, 15, e12442...
2023 doi
-
[47]
The Metallobiology of Alzheimer’s Disease
Bush, A.I. The Metallobiology of Alzheimer’s Disease. Trends Neurosci. 2003, 26, 207–214. https://doi.org/10.1016/S0166-2236(03)00067-5
2003 doi
-
[48]
The Neuropathological Diagnosis of Alzheimer’s Disease
DeTure, M.A.; Dickson, D.W. The Neuropathological Diagnosis of Alzheimer’s Disease. Mol. Neurodegener. 2019, 14, 32. https://doi.org/10.1186/s13024-019-0333-5
2019 doi
-
[49]
Origin of Cancer: Cell Work Is the Key to Understanding Cancer Initiation and Progression
Hanselmann, R.G.; Welter, C. Origin of Cancer: Cell Work Is the Key to Understanding Cancer Initiation and Progression. Front. Cell Dev. Biol. 2022, 10, 787995. https://doi.org/10.3389/fcell.2022.787995
2022
-
[50]
Biomechanics and Biophysics of Cancer Cells
Suresh, S. Biomechanics and Biophysics of Cancer Cells. Acta Biomater. 2007, 3, 413–438. https://doi.org/10.1016/j.actbio.2007.04.002
2007 doi
-
[51]
The Structural and Mechanical Complexity of Cell-Growth Control
Huang, S.; Ingber, D.E. The Structural and Mechanical Complexity of Cell-Growth Control. Nat. Cell Biol. 1999, 1, E131–E138. https://doi.org/10.1038/13043
1999 doi
-
[52]
Photonic Probing of Structural Alterations in DNA Specific Mass Density Fluctuations in Nuclei Due to Total Body Irradiation (TBI) via Confocal Imaging
Hasan, M.; Shukla, P.K.; Nanda, S.; Adhikari, P.; Rao, R.; Pradhan, P. Photonic Probing of Structural Alterations in DNA Specific Mass Density Fluctuations in Nuclei Due to Total Body Irradiation (TBI) via Confocal Imaging. OSA Contin. 2021, 4, 569–578. https://doi.org/10.1364...
2021 doi
-
[53]
DNA Damage and Its Links to Neurodegeneration
Madabhushi, R.; Pan, L.; Tsai, L.-H. DNA Damage and Its Links to Neurodegeneration. Neuron 2014, 83, 266–282. https://doi.org/10.1016/j.neuron.2014.06.034
2014 doi
-
[54]
STING Mediates Neurodegeneration and Neuroinflammation in Nigrostriatal α-Synucleinopathy
Hinkle, J.T.; Patel, J.; Panicker, N.; Karuppagounder, S.S.; Biswas, D.; Belingon, B.; Chen, R.; Brahmachari, S.; Pletnikova, O.; Troncoso, J.C.; et al. STING Mediates Neurodegeneration and Neuroinflammation in Nigrostriatal α-Synucleinopathy. Proc. Natl. Acad. Sci. USA 2022, ...
2022 doi
-
[55]
Early Neuronal Accumulation of DNA Double Strand Breaks in Alzheimer’s Disease
Shanbhag, N.M.; Evans, M.D.; Mao, W.; Nana, A.L.; Seeley, W.W.; Adame, A.; Rissman, R.A.; Masliah, E.; Mucke, L. Early Neuronal Accumulation of DNA Double Strand Breaks in Alzheimer’s Disease. Acta Neuropathol. Commun. 2019, 7, 77. https://doi.org/10.1186/s40478-019-0723-5
2019 doi
-
[56]
Neurons Burdened by DNA Double-Strand Breaks Incite Microglia Activation through Antiviral-like Signaling in Neurodegeneration
Welch, G.M.; Boix, C.A.; Schmauch, E.; Davila-Velderrain, J.; Victor, M.B.; Dileep, V .; Bozzelli, P.L.; Su, Q.; Cheng, J.D.; Lee, A.; et al. Neurons Burdened by DNA Double-Strand Breaks Incite Microglia Activation through Antiviral-like Signaling in Neurodegeneration. Sci. Ad...
2022 doi
-
[57]
DNA Double-Strand Break Accumulation in Alzheimer’s Disease: Evidence from Experimental Models and Postmortem Human Brains
Thadathil, N.; Delotterie, D.F.; Xiao, J.; Hori, R.; McDonald, M.P.; Khan, M.M. DNA Double-Strand Break Accumulation in Alzheimer’s Disease: Evidence from Experimental Models and Postmortem Human Brains. Mol. Neurobiol. 2021, 58, 118–131. https://doi.org/10.1007/s12035-020-02109-8
2021 doi
-
[58]
Alterations in the Gut-Microbial-Inflammasome-Brain Axis in a Mouse Model of Alzheimer’s Disease
Shukla, P.K.; Delotterie, D.F.; Xiao, J.; Pierre, J.F.; Rao, R.; McDonald, M.P.; Khan, M.M. Alterations in the Gut-Microbial-Inflammasome-Brain Axis in a Mouse Model of Alzheimer’s Disease. Cells 2021, 10, 779. https://doi.org/10.3390/cells10040779
2021 doi
-
[59]
DNA Damage and Neurodegenerative Phenotypes in Aged Ciz1 Null Mice
Khan, M.M.; Xiao, J.; Patel, D.; LeDoux, M.S. DNA Damage and Neurodegenerative Phenotypes in Aged Ciz1 Null Mice. Neurobiol. Aging 2018, 62, 180–190. https://doi.org/10.1016/j.neurobiolaging.2017.10.014
2018 doi
-
[60]
Mesoscopic Light Transport Properties of a Single Biological Cell : Early Detection of Cancer
Pradhan, P.; Liu, Y .; Kim, Y .; Li, X.; Wali, R.K.; Roy, H.K.; Backman, V. Mesoscopic Light Transport Properties of a Single Biological Cell : Early Detection of Cancer. In APS March Meeting Abstracts, pp. Q1-326. 2006
2006
-
[61]
Partial Wave Spectroscopy Detection of Cancer Stages Using Tissue Microarrays (TMA) Samples
Adhikari, P.; Alharthi, F.; Pradhan, P. Partial Wave Spectroscopy Detection of Cancer Stages Using Tissue Microarrays (TMA) Samples. In Proceedings of the Frontiers in Optics + Laser Science APS/DLS (2019), Washington, DC, USA, 15 September 2019; paper JW4A.89; Optica Publishi...
2019
-
[62]
Application of Mesoscopic Light Transport Theory to Ultra-Early Detection of Cancer in a Single Biological Cell
Pradhan, P.; Subramanian, H.; Liu, Y .; Kim, Y .; Roy, H.; Backman, V. Application of Mesoscopic Light Transport Theory to Ultra-Early Detection of Cancer in a Single Biological Cell. In Proceedings of the 2007 APS March Meeting, Denver, CO, USA, 1 March 2007; p. B41.013
2007
-
[63]
Phase Statistics of Light/Photonic Wave Reflected from One-Dimensional Optical Disordered Media and Its Effects on Light Transport Properties
Pradhan, P. Phase Statistics of Light/Photonic Wave Reflected from One-Dimensional Optical Disordered Media and Its Effects on Light Transport Properties. Photonics 2021, 8, 485. https://doi.org/10.3390/photonics8110485
2021 doi
-
[64]
Localization of Light in Coherently Amplifying Random Media
Pradhan, P.; Kumar, N. Localization of Light in Coherently Amplifying Random Media. Phys. Rev. B 1994, 50, 9644–9647. https://doi.org/10.1103/PhysRevB.50.9644
1994 doi
-
[65]
Wave Propagation in One-Dimensional Disordered Structures
Haley, S.B.; Erdös, P. Wave Propagation in One-Dimensional Disordered Structures. Phys. Rev. B 1992, 45, 8572–8584. https://doi.org/10.1103/PhysRevB.45.8572
1992 doi
-
[66]
Single-Cell Partial Wave Spectroscopic Microscopy
Subramanian, H.; Pradhan, P.; Kunte, D.; Deep, N.; Roy, H.; Backman, V. Single-Cell Partial Wave Spectroscopic Microscopy. In Proceedings of the Biomedical Optics (2008), St. Petersburg, FL, USA, 16 March 2008; paper BTuC5; Optica Publishing Group: Washington, DC, USA, 2008; p. BTuC5
2008
-
[67]
Optical Detection of Buccal Epithelial Nanoarchitectural Alterations in Patients Harboring Lung Cancer: Implications for Screening
Roy, H.K.; Subramanian, H.; Damania, D.; Hensing, T.A.; Rom, W.N.; Pass, H.I.; Ray, D.; Rogers, J.D.; Bogojevic, A.; Shah, M.; et al. Optical Detection of Buccal Epithelial Nanoarchitectural Alterations in Patients Harboring Lung Cancer: Implications for Screening. Cancer Res....
2010 doi
-
[68]
Optical Detection of the Structural Properties of Tumor Tissue Generated by Xenografting of Drug- Sensitive and Drug-Resistant Cancer Cells Using Partial Wave Spectroscopy (PWS)
Adhikari, P.; Nagesh, P.K.B.; Alharthi, F.; Chauhan, S.C.; Jaggi, M.; Yallapu, M.M.; Pradhan, P. Optical Detection of the Structural Properties of Tumor Tissue Generated by Xenografting of Drug- Sensitive and Drug-Resistant Cancer Cells Using Partial Wave Spectroscopy (PWS). B...
2019 doi
-
[69]
Localization of Light: Beginning of a New Optics
Jimenez-Villar, E.; Xavier, M.C.S.; Ramos, J.G.G.S.; Wetter, N.U.; Mestre, V .; Martins, W.S.; Basso, G.F.; Ermakov, V .A.; Marques, F.C.; de Sá, G.F. Localization of Light: Beginning of a New Optics. In Proceedings of the Complex Light and Optical Forces XII, San Francisco, C...
2018
-
[70]
Light Localization Properties of Weakly Disordered Optical Media Using Confocal Microscopy: Application to Cancer Detection
Sahay, P.; Almabadi, H.M.; Ghimire, H.M.; Skalli, O.; Pradhan, P. Light Localization Properties of Weakly Disordered Optical Media Using Confocal Microscopy: Application to Cancer Detection. Opt. Express 2017, 25, 15428. https://doi.org/10.1364/OE.25.015428
2017 doi
-
[71]
Transport and Anderson Localization in Disordered Two-Dimensional Photonic Lattices
Schwartz, T.; Bartal, G.; Fishman, S.; Segev, M. Transport and Anderson Localization in Disordered Two-Dimensional Photonic Lattices. Nature 2007, 446, 52–55. https://doi.org/10.1038/nature05623
2007 doi
-
[72]
Quantification of Nanoscale Density Fluctuations Using Electron Microscopy: Light-Localization Properties of Biological Cells
Pradhan, P.; Damania, D.; Joshi, H.M.; Turzhitsky, V .; Subramanian, H.; Roy, H.K.; Taflove, A.; Dravid, V .P.; Backman, V. Quantification of Nanoscale Density Fluctuations Using Electron Microscopy: Light-Localization Properties of Biological Cells. Appl. Phys. Lett. 2010, 97...
2010 doi
-
[73]
Transverse Localization of Light in the Disordered One- Dimensional Waveguide Arrays in the Linear and Nonlinear Regimes
Xu, L.; Yin, Y .; Bo, F.; Xu, J.; Zhang, G. Transverse Localization of Light in the Disordered One- Dimensional Waveguide Arrays in the Linear and Nonlinear Regimes. Opt. Commun. 2013, 296, 65–
2013
-
[74]
Light Localization Induced by a Random Imaginary Refractive Index
Basiri, A.; Bromberg, Y .; Yamilov, A.; Cao, H.; Kottos, T. Light Localization Induced by a Random Imaginary Refractive Index. Phys. Rev. A 2014, 90, 043815. https://doi.org/10.1103/PhysRevA.90.043815
2014 doi
-
[75]
Probing Intracellular Mass Density Fluctuation through Confocal Microscopy: Application in Cancer Diagnostics as a Case Study
Sahay, P.; Ganju, A.; Ghimire, H.M.; Almabadi, H.; Yallappu, M.M.; Skalli, O.; Jaggi, M.; Chauhan, S.C.; Pradhan, P. Probing Intracellular Mass Density Fluctuation through Confocal Microscopy: Application in Cancer Diagnostics as a Case Study. arXiv 2015, arXiv:1512.08583
2015 arXiv
-
[76]
Quantification of Light Localization Properties to Study the Effect of Probiotic on Chronic Alcoholic Brain Cells via Confocal Imaging
Adhikari, P.; Shukla, P.K.; Rao, R.; Pradhan, P. Quantification of Light Localization Properties to Study the Effect of Probiotic on Chronic Alcoholic Brain Cells via Confocal Imaging. In Proceedings of the Imaging, Manipulation, and Analysis of Biomolecules, Cells, and Tissue...
2021
-
[77]
https://doi.org/10.1016/j.optcom.2013.01.056
2013 doi
-
[659]
https://doi.org/10.1098/rstb.1997.0046
1997
-
[988]
https://doi.org/10.1055/s-0033-1344617
-
[6038]
https://doi.org/10.1364/BOE.396013
Reviewed August 11, 2026 · model on record in the stance chip above.
Discussion (0). Continue with ORCID to comment.