REVIEW 4 major objections 4 minor 62 references
Vortex dynamics and air entrainment in dam break wave impacting on vertical walls: A multiphase lattice Boltzmann study
T0 review · 4 major / 4 minor · reviewed 2026-08-01 · deepseek-v4-flash
Pith's one-line read A multiphase lattice Boltzmann study of dam-break waves hitting a vertical wall argues that the large air cavity often seen in simulations during run-down is a numerical artifact of free-slip wall treatment, not a real flow feature.
desk verdict Solid, honest DNS study of dam-break impact with a plausible central claim about the large air cavity being a free-slip artifact—but the evidence is a single low-Re comparison without grid convergence, so the claim is conditional, not definitive. read the letter →
The pith
A machine-rendered reading of the paper's core claim, the machinery that carries it, and where it could break.
The reading
What carries the argument
The central machinery is a high-resolution, 3D multiphase lattice Boltzmann solver (thread-safe, D3Q27, with a conservative Allen–Cahn interface-capturing equation) used to run two dam-break simulations that differ only in the wall boundary condition—no-slip versus free-slip—at the same Reynolds number (2.2×10^3). This controlled comparison isolates the role of near-wall shear: the resolved boundary-layer vorticity (a clockwise corner vortex and secondary counter-clockwise vorticity) is the physical mechanism that breaks the jet and mixes air into the water, and its absence in the free-slip case produces the artifact cavity.
What would settle it
A no-slip dam-break simulation at Reynolds number close to 10^5 with a fully resolved boundary layer that still produces a single coherent air cavity during run-down would falsify the artifact claim.
Extended reading notes
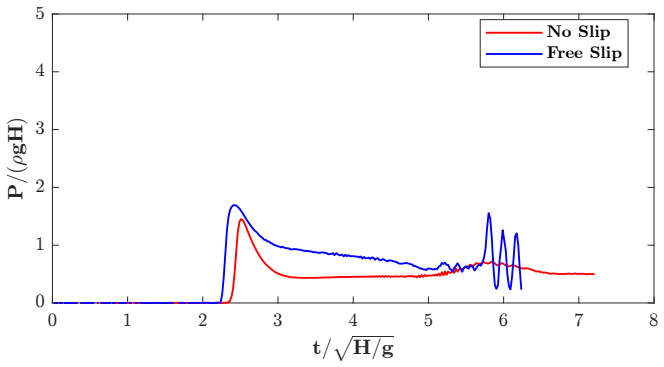
Core claim
The central claim is that the coherent, macroscopic air cavity that appears between the reflected jet and the incoming flow during the run-down phase of dam-break wall impact is a numerical artifact caused by free-slip wall treatment, not an intrinsic flow feature. In otherwise identical simulations at the same Reynolds number, the no-slip case produces a corner vortex that destabilizes the jet, breaks it into droplets, and disperses air into a mixture—matching experiments—while the free-slip case keeps the jet intact and traps a smooth cavity. The paper further shows that this artifact is responsible for spurious pressure oscillations on the wall and that air compressibility is not needed t
Load-bearing premise
The artifact conclusion rests on a low-Reynolds-number comparison (Re=2.2×10^3) and the untested premise that the boundary-layer-induced jet breakup seen at this scale also occurs at experimental Reynolds numbers (10^5–10^6).
Editorial extensions
If this is right
- Simulations that under-resolve the boundary layer and effectively behave as free-slip at the wall will generate spurious large air cavities and over-estimated pressure oscillations during run-down.
- Accurately capturing the no-slip condition is needed to predict the first pressure peak: the corner vortex deflects the wave front and moves the point of maximum pressure away from the wall base.
- Air compressibility plays a secondary role for the second pressure peak; an incompressible 3D model with proper near-wall resolution avoids the spurious peaks seen in 2D and free-slip simulations.
- The corner vortex is a persistent source of finely mixed air that feeds the upward jet, so air entrainment begins near the bottom corner rather than only in run-up and run-down.
Reading between the lines
- A natural extension is a partial-slip boundary scan: varying the degree of wall slip in the same setup should produce a continuous transition from a coherent cavity to a mixed jet, which would test the artifact interpretation directly.
- If the artifact claim transfers to engineering-scale Reynolds numbers, it implies that RANS wall-function treatments applied outside their valid range (effectively slip-like) may systematically mispredict the second force peak on walls.
- The analogy drawn by the authors between the free-slip cavity and plunging-wave air entrapment suggests a quantitative comparison with breaking-wave entrainment scaling could refine the explanation of cavity dynamics.
Signed reviews
Editorial analysis
A structured set of objections, weighed in public.
Referee Report
Summary. The paper presents three-dimensional multiphase lattice Boltzmann simulations (TSLB) of dam-break waves impacting a vertical wall, using a recursive-regularized D3Q27 lattice Boltzmann solver coupled with a conservative Allen–Cahn interface-capturing scheme. The model is validated against two experimental datasets (Lobovský et al. 2014 and Tan et al. 2023) with good reported agreement for free-surface evolution, water levels, pressure histories, and velocity fields. The authors then compare no-slip and free-slip wall boundary conditions at Re = 2.2×10^3 (Case III, Table I) and observe that only the free-slip run develops a large, smooth, coherent air cavity during the run-down phase; the no-slip run instead exhibits jet breakup, strong aeration, and damping of pressure oscillations. On this basis, the paper concludes that the large air cavity commonly reported in dam-break impact CFD is a numerical artifact of wall boundary treatment rather than a physical phenomenon, and that accurate no-slip boundary-layer resolution is essential for predicting impact pressures.
Significance. If correct, the central claim would overturn a common interpretation in the dam-break impact CFD literature, attributing the large run-down cavity to inadequate near-wall shear resolution rather than to physical air entrapment and compressibility. The paper also provides a substantial 3D validation exercise for the TSLB model on grids of approximately 10^8 nodes, including boundary-layer-resolved velocity profiles, and offers a plausible mechanism for the long-standing difficulty of predicting the first pressure peak near the wall corner. The clean no-slip/free-slip comparison at identical Reynolds number and geometry is a useful diagnostic. However, the significance is conditional: the artifact claim is drawn at Re = 2.2×10^3, below the validated cases and far below engineering-scale experiments, and the paper provides no grid-convergence or interface-parameter sensitivity study. The validation strengths are real, but they do not by themselves establish the scale-transferability of the central conclusion.
major comments (4)
- [Section III A and Table I] The central claim of §V B—that the large run-down air cavity is a numerical artifact—rests entirely on a no-slip versus free-slip comparison at Re = 2.2×10^3 (Case III). Section III A explicitly states that strict Reynolds-number similarity with experiments is not enforced; the validated cases are Re = 6×10^3 (Case I) and Re = 5×10^3 (Case II). The proposed mechanism—wall shear amplifies interfacial perturbations and breaks up the jet—is plausible at low Re, where boundary layers are thick, but it is not demonstrated to transfer to engineering-scale Re (~10^5–10^6), where boundary layers are thin and turbulent entrainment is different. Please either restrict the conclusion to the computed Reynolds number or provide a scale analysis/higher-Re test (e.g., repeat Case III at Re = 5×10^3 with the same resolution) showing that no-slip cavity suppression persists.
- [Sections IV–V, Eqs. (29) and (31)] No grid-convergence study or sensitivity analysis for the diffuse-interface parameters D and δ is reported. The no-slip jet breakup and aeration in Case III could be influenced by numerical resolution or by the interface thickness/diffusivity, rather than solely by the boundary condition. Because the central claim is that the cavity seen in earlier simulations is an artifact, the no-slip result must be shown to be independent of these numerical choices. At minimum, provide a coarser/refined run for Case III and a variation of D (or δ) with the boundary condition fixed, and show that the cavity remains suppressed.
- [Section V B, Fig. 19] The no-slip versus free-slip comparison at Case III is not directly validated against experiment at the comparison Reynolds number. The two validation cases are at Re = 6×10^3 and 5×10^3, while Case III is at Re = 2.2×10^3. Figure 19 compares the no-slip and free-slip pressure histories with each other and with qualitative literature observations, but not with a measured pressure signal for this configuration. This leaves open whether the no-slip branch at Re = 2.2×10^3 is the experimentally relevant branch. Please add a quantitative comparison with an experimental dataset for Case III, or justify in more detail why this lower-Reynolds-number run is representative.
- [Section VI, conclusion 1] The inference from resolved no-slip DNS to under-resolved RANS wall-function behavior assumes that an under-resolved no-slip wall is dynamically equivalent to free slip. This is plausible and is supported by reference [42], but the manuscript does not demonstrate the equivalence (for example, with a partial-slip or wall-modeled test). The central conclusion would be better framed as 'in the present resolved simulations, free-slip produces a cavity; under-resolved no-slip may behave similarly' unless the link to wall-function RANS is made explicit.
minor comments (4)
- [Section IV A 3, Fig. 4] The water-level comparison uses a density threshold of ρ = 5 for the primary wave and ρ = 0.3 for the secondary/return wave. This post-hoc threshold selection should be justified more rigorously, and a brief statement of sensitivity to the chosen threshold would help the reader assess the validation.
- [Section IV A 4, Eq. (50)] The mixture classification 0.02 < ρmix < 10 is arbitrary. Since the air-fraction time history is presented as a quantitative result, please provide a sensitivity check or a reference justifying this choice.
- [Section V B 2, Fig. 19] The statement that the no-slip condition produces a smoother profile 'showing better agreement with experimental evidence' is qualitative. Overlay an experimental pressure trace in Fig. 19, or cite the specific dataset used for that comparison.
- [Section IV A 2] Typo: 'istantaneous' should be 'instantaneous'.
Circularity Check
No significant circularity: the central artifact claim rests on a controlled no-slip/free-slip comparison, not on fitted inputs or load-bearing self-citations.
full rationale
The paper's central claim—that the large run-down air cavity is a numerical artifact—is supported by a controlled comparison of no-slip and free-slip wall treatments at identical Reynolds number (Section V B, Figs. 14, 19, 20). This is a difference-of-conditions experiment, not a fit to the target quantity: the no-slip result independently reproduces experimentally observed jet breakup and mixing ([14], [23]; Section IV), while the free-slip result produces the cavity. The multiphase solver accLB is self-cited ([19]-[22]), but the governing equations are given in full (Eqs. 1-44) and the code is benchmarked against external experiments (Sections IV A and IV B), so the self-citation is method attribution, not the load-bearing justification. The only post-processing degree of freedom is the choice of density iso-surface thresholds for water levels (Section IV A 3: rho=5 vs rho=0.3), which is a diagnostic representation of a strongly mixed free surface, not a fitted parameter in the dynamics and not used in the no-slip/free-slip comparison. The paper explicitly acknowledges 'Strict Reynolds-number similarity with the experiments is not enforced' (Section III A) and provides no grid-convergence study; these are scale-transferability and resolution-robustness limitations, not circular reductions. No equation or prediction in the paper reduces by construction to its own input.
Assumptions & free parameters
free parameters (5)
- Reynolds number for boundary-condition comparison =
2.2e3
- Interface diffusivity D and interface thickness δ =
not reported
- Lattice density ratio ρ_l/ρ_g =
500 (10 vs 0.02)
- Lattice gravity g_n =
1e-7 to 1e-6
- Post-hoc density thresholds for water level =
0.3 and 5
assumptions (5)
- standard math The lattice Boltzmann scheme recovers variable-density incompressible Navier-Stokes equations
- domain assumption The conservative Allen-Cahn equation with γ=4D/δ accurately captures air-water interface dynamics including entrainment
- domain assumption The flow is effectively incompressible; air compressibility has only marginal influence on pressure peaks
- domain assumption Froude scaling is the dominant similarity; Reynolds number need not match experiments
- domain assumption No-slip wall with resolved boundary layer represents the experimental wall condition
Cite this review
Pith. "Pith review of Vortex dynamics and air entrainment in dam break wave impacting on vertical walls: A multiphase lattice Boltzmann study." pith.science (2026). https://pith.science/paper/6R24M6FK
@misc{pith2026260725433,
  author       = {Pith},
  title        = {Pith review of: Vortex dynamics and air entrainment in dam break wave impacting on vertical walls: A multiphase lattice Boltzmann study},
  year         = {2026},
  howpublished = {\url{https://pith.science/paper/6R24M6FK}},
  note         = {Machine review of arXiv:2607.25433}
}
read the original abstract
Air entrainment often plays a crucial role in determining impact loads exerted by free-surface wave flows interacting with structures, yet its modelling is often oversimplified in numerical approaches. In this study a two-phase numerical model, based on the Lattice Boltzmann Method coupled to a conservative Allen--Cahn interface-capturing equation is employed to perform direct numerical simulations of dam-break waves propagating over a dry bed and impacting on vertical walls. Access to high-resolution simulations enables a detailed assessment of how accurately resolving both air--water and solid--water interfaces affects local and overall dynamics, as well as quantities of extreme engineering interest. Indeed, the magnitudes and locations of the pressure peaks are strongly affected by wave front deflection and local aeration induced by a small corner vortex. Additionally, comparisons between no-slip and free-slip implementations suggest that the large air cavity formation, commonly observed as trapped inside the reflected jet falling back onto the incoming flow, may be the result of modeling assumptions rather than intrinsic flow physics, again highlighting the key role of near-wall shear in jet breakup dynamics.
Figures


Figures from the paper (14 more)



Reference graph
Works this paper leans on
-
[42]
Kr¨ uger, H
T. Kr¨ uger, H. Kusumaatmaja, A. Kuzmin, O. Shardt, G. Silva, E. M. Viggen, The lattice Boltzmann method, Vol. 10, Springer, 2017
2017
-
[1]
2 for different time instants
Free-surface profile The qualitative comparison of the free-surface profiles between the experimental test and the numerical model is reported in Fig. 2 for different time instants. Both the propagation and the run-up phases are reproduced remarkably well, as shown in the first snapshots of Fig. 2, as well as the plots in Fig. 3. Although the height of th...
-
[2]
Wave front evolution The temporal evolution of the wave front position and velocity prior to impact is reported in Fig. 3. The numerical front position is assumed to be the largest x location of the average iso-density in the domain. The velocities of both the experimental and the numerical wave fronts, extracted at the symmetry plane, are computed using ...
2014
-
[3]
4 shows the temporal evolution of the water levels obtained from the TSLB numerical modeling, compared with the experimental measurements reported by [23]
Water level time histories Fig. 4 shows the temporal evolution of the water levels obtained from the TSLB numerical modeling, compared with the experimental measurements reported by [23]. The analysis is carried out at the vertical sections H1, H2, H3, and H4, located within the computational domain (as shown in Fig. 1), considering an initial water depth...
2014
-
[4]
This allows for an accurate assessment of the air fraction entrained in the jet throughout the event
Air fraction in the mixture As previously discussed, the TSLB numerical model effectively simulates air–water mixing during a dam-break impact against a vertical wall. This allows for an accurate assessment of the air fraction entrained in the jet throughout the event. A computational node is classified as belonging to the air–water mixture phase if its d...
-
[5]
Pressure histories Pressure histories obtained with the TSLB model were extracted at the sensor locations installed on the vertical impact wall, as shown in Fig. 1. Since the spatial extent of the pressure sensor exceeds the numerical grid spacing, an averaging procedure has been applied to the numerical results over the corresponding sensor area. A compa...
2014
-
[6]
This issue was also analyzed in the work by [ 23], who conducted an extensive experimental campaign by repeating the same test 100 times under identical initial conditions
Influence of impact dynamics on first pressure peak uncertainty The uncertainty in the prediction of pressure peaks at the base of the vertical impact wall, induced by a dam-break flow, represents a well-recognized problem investigated in various experimental studies [ 4], [39], [40]. This issue was also analyzed in the work by [ 23], who conducted an ext...
2014
-
[7]
J. Shen, L. Wei, D. Wu, H. Liu, J. Huangfu, Spatiotemporal characteristics of the dam-break induced surge pressure on a vertical wall, Coastal Engineering Journal 62 (4) (2020) 566–581. 38
2020
Show all 62 references
-
[8]
S. Liu, I. Nistor, A. Mohammadian, A. H. Azimi, Experimental investigation on the impact of dam-break induced surges on a vertical wall, Fluids 7 (8) (2022) 258
2022
-
[9]
The dimensionless velocity magnitude in the X–Z plane is defined as V = √ U 2 +W 2
Velocity magnitude mapping The velocity magnitude distribution, compared with experimental data, was obtained by nondimensionalizing the horizontal and vertical components as U = u/√gH and W = w/√gH . The dimensionless velocity magnitude in the X–Z plane is defined as V = √ U ...
-
[10]
Vertical velocity profile The comparison of the vertical velocity profiles, W = w/√gH , along the impact wall at different time instants is shown in Fig. 12. The numerical results obtained using the TSLB modeling framework should be interpreted as mean profiles, computed from ...
2023
-
[11]
15 compares the impact dynamics yielded by a no-slip and free-slip simulations
Shear-induced aeration and jet deflection Fig. 15 compares the impact dynamics yielded by a no-slip and free-slip simulations. The comparison highlights that the clockwise vortex developing at the bottom corner is absent under free-slip conditions. The absence of the boundary ...
-
[12]
:” denotes double contraction and “
or in presence of overtopping flow [13]. In these configurations, the engineering response is not determined solely by the hydrody- namic properties of the flow, such as its kinematics [ 14], but also by the impact dynamics and the resulting fluid–structure interaction. These ...
-
[13]
A comparison of the temporal pressure distributions (Fig
Air entrainment effect on pressure history The pressure response was analyzed using an ideal sensor positioned on the vertical wall at an elevation of 15 mm from the bottom. A comparison of the temporal pressure distributions (Fig. 19) reveals that the free-slip condition yiel...
-
[14]
In contrast, wall friction amplifies interfacial perturbations, promotes jet breakup, and accelerates the deaeration process before the main jet impacts the incoming flow
Comparisons between simulations performed at the same Reynolds number ( Re) show that a large, smooth, coherent air cavity develops during the run-down phase only when a free-slip boundary condition is imposed at the wall. In contrast, wall friction amplifies interfacial pertu...
-
[15]
Air compressibility has only a marginal influence on the prediction of the second pressure peak. Although a coherent air cavity (free-slip case) generates pressure oscillations, these are significantly damped when jet breakup and the resulting air–water mixing occur under no-s...
-
[16]
Ecosistema dell’Innovazione—Rome Technopole
During the impact process, the clockwise vortex developing near the lower corner of the wall governs the upward deflection of the incoming flow. An accurate representation of the no-slip boundary condition is therefore essential. Simulations employing a free-slip condition fai...
-
[17]
Z. Xu, B. Melville, C. Whittaker, N. Nandasena, A. Shamseldin, Mitigation of tsunami bore impact on a vertical wall behind a barrier, Coastal Engineering 164 (2021) 103833
2021
-
[18]
La Rocca, S
M. La Rocca, S. Miliani, P. Prestininzi, Discrete boltzmann numerical simulation of simplified urban flooding configurations caused by dam break, Frontiers in Earth Science 8 (2020) 346
2020
-
[19]
Kleefsman, G
K. Kleefsman, G. Fekken, A. Veldman, B. Iwanowski, B. Buchner, A volume-of-fluid based simulation method for wave impact problems, Journal of computational physics 206 (1) (2005) 363–393
2005
-
[20]
Aureli, S
F. Aureli, S. Dazzi, A. Maranzoni, P. Mignosa, R. Vacondio, Experimental and numerical evaluation of the force due to the impact of a dam-break wave on a structure, Advances in Water Resources 76 (2015) 29–42
2015
-
[21]
Ozmen-Cagatay, S
H. Ozmen-Cagatay, S. Kocaman, Dam-break flow in the presence of obstacle: experiment and cfd simulation, Engineering applications of computational fluid mechanics 5 (4) (2011) 541–552
2011
-
[22]
O. O. Adekoya, K. S. Erduran, Combined influence of pier geometry and downstream bed slope on tsunami-surge impact forces, Physics of Fluids 38 (1) (2026)
2026
-
[23]
and the numerical simulations of [32], [33], [34]
-
[24]
Mokrani, S
C. Mokrani, S. Abadie, Conditions for peak pressure stability in vof simulations of dam break flow impact, Journal of Fluids and Structures 62 (2016) 86–103
2016
-
[25]
Rozki, S
M. Rozki, S. Abadie, D. Morichon, Physical processes explaining the second force peak generated during a surge impact on a vertical wall, Coastal Engineering 197 (2025) 104664
2025
-
[26]
Del Gaudio, G
A. Del Gaudio, G. La Forgia, G. Constantinescu, F. De Paola, C. Di Cristo, M. Iervolino, A. Leopardi, A. Vacca, Modelling the impact of a dam-break wave on a vertical wall, Earth Surface Processes and Landforms 49 (7) (2024) 2080–2095
2024
-
[27]
Z. Huo, H. Liu, Experimental study of the surge-and bore-induced impact pressure on a vertical wall and its foundation, Physics of Fluids 35 (1) (2023)
2023
-
[28]
Rozki, S
M. Rozki, S. Abadie, D. Morichon, First and second force peaks generated by a surge impact on a wall with and without overtopping, Journal of Fluids and Structures 137 (2025) 104380
2025
-
[29]
T. Tan, Y. Ma, J. Zhang, X. Niu, K.-A. Chang, Experimental study on flow kinematics of dam-break induced surge impacting onto a vertical wall, Physics of Fluids 35 (2) (2023)
2023
-
[30]
Lugni, M
C. Lugni, M. Brocchini, O. Faltinsen, Wave impact loads: The role of the flip-through, Physics of fluids 18 (12) (2006)
2006
-
[31]
Bredmose, G
H. Bredmose, G. Bullock, A. Hogg, Violent breaking wave impacts. part 3. effects of scale and aeration, Journal of Fluid Mechanics 765 (2015) 82–113
2015
-
[32]
Colagrossi, M
A. Colagrossi, M. Landrini, Numerical simulation of interfacial flows by smoothed particle hydrodynamics, Journal of computational physics 191 (2) (2003) 448–475
2003
-
[33]
Y. Yang, J. Shao, Numerical simulation of fluid–structure interaction with sph method, The Journal of Engineering 2020 (14) (2020) 958–965
2020
-
[34]
Lauricella, A
M. Lauricella, A. Mukherjee, L. Brandt, S. Succi, D. Izbassarov, A. Montessori, acclb: A high-performance lattice boltzmann code for multiphase turbulence on multi-gpu architectures, Procedia Computer Science 267 (2025) 40–51
2025
-
[35]
Lauricella, A
M. Lauricella, A. Tiribocchi, S. Succi, L. Brandt, A. Mukherjee, M. La Rocca, A. Montessori, Thread-safe multiphase lattice boltzmann model for droplet and bubble dynamics at high density and viscosity contrasts, Physics of Fluids 37 (7) (2025)
2025
-
[36]
Montessori, M
A. Montessori, M. Lauricella, A. Mukherjee, L. Brandt, Breakdown of kolmogorov scaling and modified energy transfer in bubble-laden turbulence, Physical Review Fluids 11 (2) (2026) 39 024605
2026
-
[37]
Montessori, M
A. Montessori, M. La Rocca, G. Amati, M. Lauricella, A. Tiribocchi, S. Succi, High-order thread-safe lattice boltzmann model for high performance computing turbulent flow simulations, Physics of Fluids 36 (3) (2024)
2024
-
[38]
Lobovsk` y, E
L. Lobovsk` y, E. Botia-Vera, F. Castellana, J. Mas-Soler, A. Souto-Iglesias, Experimental investigation of dynamic pressure loads during dam break, Journal of Fluids and Structures 48 (2014) 407–434
2014
-
[39]
Zhao-Li, Z
G. Zhao-Li, Z. Chu-Guang, S. Bao-Chang, Non-equilibrium extrapolation method for velocity and pressure boundary conditions in the lattice boltzmann method, Chinese physics 11 (4) (2002) 366–374
2002
-
[40]
Chikatamarla, S
S. Chikatamarla, S. Ansumali, I. Karlin, Grad’s approximation for missing data in lattice boltzmann simulations, EPL (Europhysics Letters) 74 (2) (2006) 215–221
2006
-
[41]
Latt, Choice of units in lattice boltzmann simulations, Freely available online at http://lbmethod
J. Latt, Choice of units in lattice boltzmann simulations, Freely available online at http://lbmethod. org/ media/howtos: lbunits. pdf (2008)
2008
-
[43]
Stansby, A
P. Stansby, A. Chegini, T. Barnes, The initial stages of dam-break flow, Journal of Fluid Mechanics 374 (1998) 407–424
1998
-
[44]
Lauber, W
G. Lauber, W. H. Hager, Experiments to dambreak wave: Horizontal channel, Journal of Hydraulic research 36 (3) (1998) 291–307
1998
-
[45]
Heller, Scale effects in physical hydraulic engineering models, Journal of Hydraulic Research 49 (3) (2011) 293–306
V. Heller, Scale effects in physical hydraulic engineering models, Journal of Hydraulic Research 49 (3) (2011) 293–306
2011
-
[46]
Heller, Self-similarity and reynolds number invariance in froude modelling, Journal of Hydraulic Research 55 (3) (2017) 293–309
V. Heller, Self-similarity and reynolds number invariance in froude modelling, Journal of Hydraulic Research 55 (3) (2017) 293–309
2017
-
[47]
Lubin, S
P. Lubin, S. Vincent, J.-P. Caltagirone, S. Abadie, Fully three-dimensional direct numerical simulation of a plunging breaker, Comptes Rendus Mecanique 331 (7) (2003) 495–501
2003
-
[48]
Lubin, S
P. Lubin, S. Vincent, S. Abadie, J.-P. Caltagirone, Three-dimensional large eddy simulation of air entrainment under plunging breaking waves, Coastal engineering 53 (8) (2006) 631–655
2006
-
[49]
Landrini, A
M. Landrini, A. Colagrossi, M. Greco, M. Tulin, Gridless simulations of splashing processes and near-shore bore propagation, Journal of Fluid Mechanics 591 (2007) 183–213
2007
-
[50]
M. M. Kamra, N. Mohd, C. Liu, M. Sueyoshi, C. Hu, Numerical and experimental investigation 40 of three-dimensionality in the dam-break flow against a vertical wall, Journal of Hydrodynamics 30 (4) (2018) 682–693
2018
-
[51]
Ritter, Die fortpflanzung der wasserwellen, Zeitschrift des vereines deutscher ingenieure 36 (33) (1892) 947–954
A. Ritter, Die fortpflanzung der wasserwellen, Zeitschrift des vereines deutscher ingenieure 36 (33) (1892) 947–954
-
[52]
L. Peng, T. Zhang, Y. Rong, C. Hu, P. Feng, Numerical investigation of the impact of a dam-break induced flood on a structure, Ocean Engineering 223 (2021) 108669
2021
-
[53]
Garoosi, A
F. Garoosi, A. N. Mellado-Cusicahua, M. Shademani, A. Shakibaeinia, Experimental and numerical investigations of dam break flow over dry and wet beds, International Journal of Mechanical Sciences 215 (2022) 106946
2022
-
[54]
W. Xie, T. Shimozono, Water surge impingement onto a vertical wall: Laboratory experiments and stochastic analysis on impact pressure, Ocean Engineering 248 (2022) 110422
2022
-
[55]
Martinez-Carrascal, P
J. Martinez-Carrascal, P. E. Merino-Alonso, I. Mengual Berjon, M. A. San Gregorio, A. Souto- Iglesias, Experimental investigation of wave impact loads induced by a three-dimensional dam break, Journal of Marine Science and Engineering 14 (2) (2026) 199
2026
-
[56]
H. T.-S. Ko, H. Yeh, On the splash-up of tsunami bore impact, Coastal engineering 131 (2018) 1–11
2018
-
[57]
D. C. Wilcox, Turbulence modelling for CFD, DCW Industries, La Ca˜ nada, 1993
1993
-
[58]
Del Gaudio, G
A. Del Gaudio, G. Constantinescu, F. De Paola, C. Di Cristo, A. Vacca, Turbulent dam-break waves of newtonian and non-newtonian fluids, Journal of Fluid Mechanics 1019 (2025) A58
2025
-
[59]
Kihara, Y
N. Kihara, Y. Niida, D. Takabatake, H. Kaida, A. Shibayama, Y. Miyagawa, Large-scale experiments on tsunami-induced pressure on a vertical tide wall, Coastal engineering 99 (2015) 46–63
2015
-
[60]
Cumberbatch, The impact of a water wedge on a wall, Journal of Fluid Mechanics 7 (3) (1960) 353–374
E. Cumberbatch, The impact of a water wedge on a wall, Journal of Fluid Mechanics 7 (3) (1960) 353–374
1960
-
[61]
Terrington, M
S. Terrington, M. Thompson, K. Hourigan, Vorticity dynamics at partial-slip boundaries, Journal of Fluid Mechanics 980 (2024) A58
2024
-
[62]
Michel, G
J. Michel, G. Oger, D. Le Touz´ e, A. Colagrossi, S. Marrone, Efficient and flexible adaptive particle refinement for free-surface flows based on the regularized high-order diffusive smoothed particle hydrodynamics scheme, Physics of Fluids 37 (12) (2025). 41
2025
Reviewed August 1, 2026 · model on record in the stance chip above.
Discussion (0). Continue with ORCID to comment.