REVIEW 4 major objections 6 minor 59 references
The Influence of Stellar Chromospheres and Coronae on Exoplanet Transmission Spectroscopy
T0 review · 4 major / 6 minor · reviewed 2026-08-09 · deepseek-v4-flash
Pith's one-line read Stellar chromospheres and coronae bias exoplanet transmission spectra, and including them raises HAT-P-18 b's retrieved temperature from 536 K to about 736 K.
desk verdict New transit model (TACHELES) worth knowing, but the headline temperature claim is about 0.7 sigma and the abstract overstates it. read the letter →
The pith
A machine-rendered reading of the paper's core claim, the machinery that carries it, and where it could break.
The reading
What carries the argument
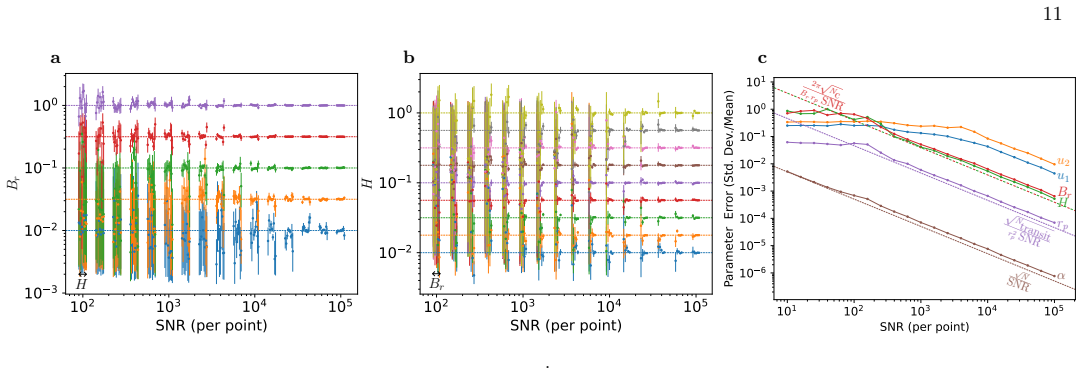
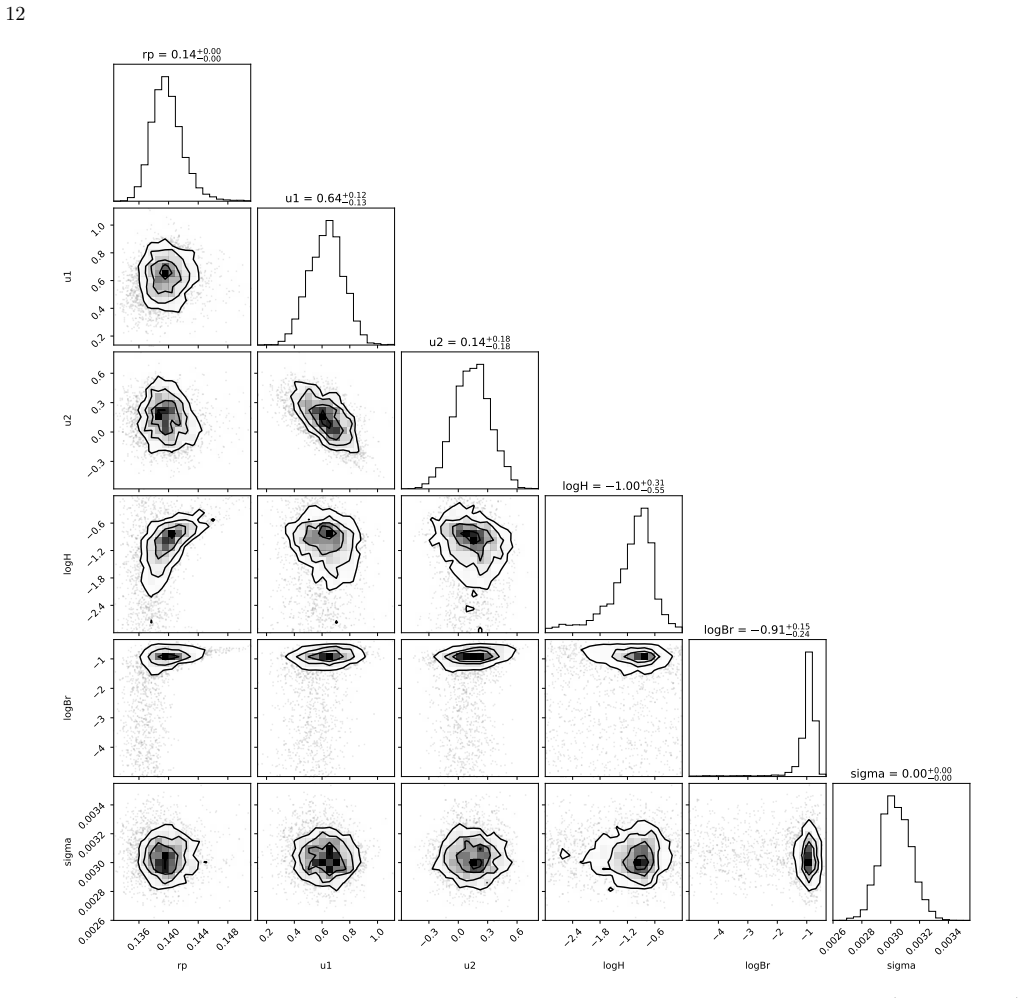
The carrying object is TACHELES, a transit model that adds an optically thin, spherically symmetric, exponentially decaying emitting shell with brightness profile $I_0 e^{-r/H}$ around a standard photospheric Mandel-Agol limb-darkened disk. The shell brightness is integrated along the line of sight (Eq. 2) to give an on-sky radial profile, and the planet occults both photosphere and shell. Two new free parameters, the brightness ratio $\mathrm{Br}$ and scale height $H$, capture the wavelength-dependent line emission of the chromosphere and corona; at near-IR wavelengths this emission is strong enough in some bins to alter the transit shape and depth. The model is validated against solar EUV images showing an exponential line-of-sight integrated profile, and its detection limits are characterized with simulated light curves.
What would settle it
Take a JWST transmission-spectroscopy target whose coronal and chromospheric emission is independently measured in X-ray and ultraviolet at the same epoch; if TACHELES-fitted brightness ratios and scale heights do not track the independently measured emission strengths and their wavelength pattern, the exponential-shell interpretation is wrong. A cheaper check is to measure the Sun's off-limb brightness at 0.85 to 2.8 microns to test whether the exponential line-of-sight model holds at the near-infrared wavelengths where the paper applies it.
Extended reading notes
Core claim
The paper's central claim is that the chromosphere and corona of the host star, not just its photosphere, must be included in transit models before the planetary transmission spectrum is interpreted. For HAT-P-18 b, the authors find that 24 wavelength bins show substantial and 6 show strong statistical evidence for the extended-layer model over a purely photospheric one, with fitted brightness ratios of 0.04 to 0.25 and scale heights of 0.07 to 0.31 stellar radii. Once these layers are accounted for, the best-fit atmospheric temperature rises from 536 K to about 721 to 736 K, much closer to the 852 K equilibrium temperature, and the CO2 mixing ratio drops by almost an order of magnitude. The retrieved chromospheric and coronal spectrum contains nine lines above 5 sigma, all matched to CHIANTI plasma-model lines, including coronal Fe X emission. If this is right, the usual assumption of a purely photospheric transit source is a systematic error source for active host stars.
Load-bearing premise
The argument rests on the assumption that the chromosphere and corona of HAT-P-18 can be described as a single optically thin exponential shell whose brightness falls off as $e^{-r/H}$ at near-infrared wavelengths, an assumption validated only by solar EUV images at 17.1 nm and not by any near-infrared measurement of the target star.
Editorial extensions
If this is right
- Atmospheric temperatures retrieved from transmission spectra of active-host exoplanets are biased low when chromospheric and coronal emission is ignored; the effect can be hundreds of kelvin.
- For HAT-P-18 b, including the outer stellar layers raises the best-fit temperature to near the equilibrium temperature and reduces the CO2 abundance by almost an order of magnitude.
- Wavelength-dependent residuals attributed to spots or third-light dilution may partly be chromospheric and coronal line emission, so published spectra of active stars may need reanalysis.
- TACHELES turns transmission spectroscopy into a probe of stellar chromospheres and coronae, with detected lines such as Fe X, Mg II, and He I in a K dwarf other than the Sun.
- Since most current and scheduled JWST targets orbit stars more active than HAT-P-18, the bias should be larger, not smaller, for the wider sample.
Reading between the lines
- A natural extension, not tested here, is to fold chromospheric and coronal emission into retrieval codes as a standard stellar nuisance parameter alongside spots and faculae; this would let archival JWST datasets be re-fit without new observations.
- The paper's line detections suggest that high-SNR transmission spectroscopy could be used to build differential emission measure models of other stars, effectively extending solar coronal physics to exoplanet hosts.
- If the exponential shell is confirmed at near-infrared wavelengths on the Sun, the same model could be applied to smaller planets or grazing transits, where the finite planet size does not smear out the chromospheric geometry, to map the layer structure.
Editorial analysis
A structured set of objections, weighed in public.
Referee Report
Summary. The paper introduces TACHELES, a transit model that adds an exponentially decaying, optically thin emitting shell to a standard Mandel-Agol photospheric light curve, parameterized by a brightness ratio Br and a scale height H. The model is fit to JWST NIRISS/SOSS observations of HAT-P-18 b; wavelength bins with Bayes factors favoring TACHELES are used to construct a 'chromospheric/coronal spectrum' and to identify emission lines using CHIANTI. The corrected transmission spectrum is then passed to POSEIDON atmospheric retrievals. The authors report that including the stellar outer layers raises the retrieved temperature from 536 K to about 721-736 K, closer to the equilibrium temperature, decreases the retrieved H2O and CO2 abundances, and opens a new window on stellar outer layers.
Significance. If the claims were robust, TACHELES would address an important systematic in transmission spectroscopy: stellar chromospheres and coronae are usually neglected, and for active stars they could bias retrieved temperatures and abundances. The model derivation is transparent, the code and derived data are publicly available, and the synthetic retrieval tests in Appendix B and the solar validation in Appendix A are useful contributions. However, the headline quantitative claim is not supported by the reported uncertainties, and the NIR detection lacks independent validation. The concept is promising and worth publishing after major revision that tempers the claims and adds supporting tests.
major comments (4)
- [§4, Table 3; Abstract] The central claim that accounting for the chromosphere/corona increases the retrieved temperature from 536 K to about 736 K is not statistically supported. Table 3 reports Tref = 536.0+188.9-100.8 K for the photospheric one-heterogeneity model and Tref = 720.8+376.4-188.0 K for the TACHELES one-heterogeneity model. The 1-sigma intervals overlap; the point-estimate shift of 184.8 K is smaller than the lower 1-sigma error on the TACHELES value and comparable to the upper error on the photospheric value, corresponding to roughly 0.7 sigma if the asymmetric errors are combined in quadrature. The abstract's value of 736 K also does not match the body's 720.8 K. The conclusion that ignoring the stellar outer layers biases retrieved atmospheric temperatures is therefore not established by this dataset and should be reframed as tentative or suggestive.
- [§2, Eq. (2); Appendix A] The exponential, optically thin emission law I0 e^{-r/H} integrated along the line of sight (Eq. 2) is the foundation of the TACHELES detection, but its applicability at 0.85-2.8 um is not independently validated. Appendix A validates the exponential form only with SDO EUV images at 17.1 nm, a very different spectral regime, and the fitted Br and H values are not checked against alternative explanations such as unocculted spots, faculae, or wavelength-dependent systematics. Because the derived chromospheric/coronal spectrum and the line identifications are constructed from these same fitted parameters, the CHIANTI matching in §5 is a consistency check of the fit rather than an independent confirmation. The manuscript needs an explicit test (e.g., injection-recovery with spot/faculae models, or a comparison of the NIR line ratios with a solar NIR spectrum) before claiming a detection.
- [§3, §5] The statistical evidence for TACHELES is evaluated bin-by-bin without addressing the multiplicity of wavelength bins: the paper reports 24 bins with Bayes factor >=3 and 6 with Bayes factor >=10, but it never states the total number of bins, so the false-positive rate cannot be assessed. The same issue affects the line identifications: 9 emission peaks at >=5 sigma are matched to CHIANTI lines, but no estimate is given for the expected number of chance matches given the line density in the CHIANTI list and the NIRISS spectral resolution. A binomial or false-discovery-rate calculation, or a null test on the photospheric residuals, is needed to support the per-bin detections and the line identifications.
- [Abstract; §4] The abstract states that the analysis 'decreases the best-fit abundance of CO2 by almost an order of magnitude,' but §4 describes the CO2 decrease as tentative and based on a singular feature at the edge of the spectrum, and it notes that CO2 is hard to constrain with NIRISS/SOSS data. Similarly, the H2O decrease is only about 2 sigma. The abstract and conclusions should carry the same caveats as the body, otherwise readers will take an unsecured abundance shift as a principal result.
minor comments (6)
- [Abstract; §6; Table 3] The temperature value in the abstract (736 K) differs from the value quoted in §6 (721 K) and in Table 3 (720.8 K); please harmonize these numbers.
- [§3] 'Jeffrey's scale' should be 'Jeffreys scale'.
- [Table 4] The column header 'of f' appears to be a typo for the baseline offset parameter.
- [Fig. 6] The black and red line identifications in the figure are hard to distinguish; a legend or distinct marker styles would improve clarity.
- [§5] The statement that the H-alpha peak is 34 A blueward of line center deserves a quantitative discussion, since such a large offset may undermine the line-identification procedure.
- [Appendix A] The azimuthally averaged SDO brightness profile is shown only over a limited radial range (roughly 1-1.2 R*), whereas the fitted scale heights in §3 range from 0.07 to 0.31 R*; please comment on the extrapolation of the solar validation to the fitted regime.
Circularity Check
No significant circularity: the per-wavelength TACHELES fits do not use the CHIANTI line list, and the claimed temperature shift is a fitted retrieval rather than a prediction from the model inputs.
full rationale
The paper's central derivation, the TACHELES forward model in Eq. (1)-(2), is built from an assumed exponential emission law that is independently motivated by SDO observations in Appendix A. The per-wavelength brightness ratios and scale heights are fit to the JWST light curves with uniform priors (Table 1) and without any line-list priors, so the resulting transmission spectrum is an independent fit output rather than a restatement of an input. The CHIANTI comparison in Section 5 is explicitly described as a 'sanity check' performed after the fits; matching fitted peaks to known atomic lines is a post-hoc consistency test, and the paper even reports mismatches, such as the H-alpha peak offset by 34 Angstroms, which shows the matching is not forced. The POSEIDON retrieval temperature increase (from 536.0 K to 720.8 K in Table 3) is a posterior estimate obtained from the corrected spectrum, not a quantity used to construct the TACHELES model. The citation to Perdelwitz et al. (2024) supplies archival activity data for broader context and is not load-bearing for the derivation. Therefore no step reduces by construction to its own inputs; concerns about the statistical significance of the temperature shift are a validity issue, not a circularity issue.
Assumptions & free parameters
free parameters (6)
- Br =
0.04 to 0.25 for significant bins
- H =
0.07 to 0.31 R_star for significant bins
- rp =
varies per bin around 0.138 R_star
- u1 =
Gaussian prior centered on exotik-ld PHOENIX prediction, width 0.2
- u2 =
Gaussian prior centered on exotik-ld PHOENIX prediction, width 0.2
- alpha =
uniform prior 0 to 10000
assumptions (6)
- domain assumption Chromospheric and coronal line emission follows I0 e^{-r/H} with a single scale height H.
- domain assumption The chromosphere/corona is optically thin and contributes only emission, not absorption, along the line of sight.
- standard math The photospheric light curve is exactly a Mandel and Agol (2002) model with quadratic limb darkening.
- domain assumption The POSEIDON retrieval setup, including the P-T parameterization, cloud model, composition set, and spot treatment, is inherited from Fournier-Tondreau et al. (2024).
- domain assumption The CHIANTI line list based on a Solar prominence differential emission measure and solar abundances is representative of HAT-P-18's outer atmosphere.
- ad hoc to paper The spot crossing event is masked by removing all data within 0.011 d of 0.005 d after t0.
Cite this review
Pith. "Pith review of The Influence of Stellar Chromospheres and Coronae on Exoplanet Transmission Spectroscopy." pith.science (2026). https://pith.science/paper/6R4V7EJE
@misc{pith2026250200553,
  author       = {Pith},
  title        = {Pith review of: The Influence of Stellar Chromospheres and Coronae on Exoplanet Transmission Spectroscopy},
  year         = {2026},
  howpublished = {\url{https://pith.science/paper/6R4V7EJE}},
  note         = {Machine review of arXiv:2502.00553}
}
read the original abstract
A main source of bias in transmission spectroscopy of exoplanet atmospheres is magnetic activity of the host star in the form of stellar spots, faculae or flares. However, the fact that main-sequence stars have a chromosphere and a corona, and that these optically thin layers are dominated by line emission may alter the global interpretation of the planetary spectrum, has largely been neglected. Using a JWST NIRISS/SOSS data set of hot Jupiter HAT-P-18 b, we show that even at near-IR and IR wavelengths, the presence of these layers leads to significant changes in the transmission spectrum of the planetary atmosphere. Accounting for these stellar outer layers thus improves the atmospheric fit of HAT-P-18 b, and increases its best-fit atmospheric temperature from 536 K to 736 K, a value much closer to the predicted equilibrium temperature of 852 K. Our analysis also decreases the best-fit abundance of CO2 by almost an order of magnitude. The approach provides a new window to the properties of chromospheres/corona in stars other than our Sun.
Figures


Figures from the paper (6 more)


Reference graph
Works this paper leans on
-
[1]
Ahrer , E.-M., Stevenson , K. B., Mansfield , M., et al. 2023, , 614, 653, 10.1038/s41586-022-05590-4
-
[2]
2023, , 135, 075001, 10.1088/1538-3873/acd7a3
Albert et al., , L. 2023, , 135, 075001, 10.1088/1538-3873/acd7a3
-
[3]
Alderson , L., Wakeford , H. R., Alam , M. K., et al. 2023, , 614, 664, 10.1038/s41586-022-05591-3
-
[4]
Astropy Collaboration , Robitaille , T. P., Tollerud , E. J., et al. 2013, , 558, A33, 10.1051/0004-6361/201322068
-
[5]
Astropy Collaboration , Price-Whelan , A. M., Sip o cz , B. M., et al. 2018, , 156, 123, 10.3847/1538-3881/aabc4f
-
[6]
2022, , 935, 167, 10.3847/1538-4357/ac7c74
Astropy Collaboration et al., . 2022, , 935, 167, 10.3847/1538-4357/ac7c74
-
[7]
2021, The Journal of Open Source Software, 6, 3001, 10.21105/joss.03001
Buchner , J. 2021, The Journal of Open Source Software, 6, 3001, 10.21105/joss.03001
-
[8]
Cadieux , C., Doyon , R., MacDonald , R. J., et al. 2024, , 970, L2, 10.3847/2041-8213/ad5afa
Show all 59 references
-
[9]
2024, Master's thesis, Weizmann Institute of Science, Rehovot, Israel
Chaikin-Lifshitz, A. 2024, Master's thesis, Weizmann Institute of Science, Rehovot, Israel
2024
-
[10]
2024, , 682, A136, 10.1051/0004-6361/202347079
Claudi , R., Bruno , G., Fossati , L., et al. 2024, , 682, A136, 10.1051/0004-6361/202347079
2024 doi
-
[11]
2023, , 943, L10, 10.3847/2041-8213/acaead
Constantinou , S., Madhusudhan , N., & Gandhi , S. 2023, , 943, L10, 10.3847/2041-8213/acaead
2023 doi
-
[12]
de Ferrer, J. J. 1809, Transactions of the American Philosophical Society, 6, 264. http://www.jstor.org/stable/1004801
-
[13]
2021, , 909, 38, 10.3847/1538-4357/abd8ce
Del Zanna et al., , G. 2021, , 909, 38, 10.3847/1538-4357/abd8ce
2021 doi
- [14]
-
[15]
2013, ChiantiPy: Python package for the CHIANTI atomic database, Astrophysics Source Code Library, record ascl:1308.017
---. 2013, ChiantiPy: Python package for the CHIANTI atomic database, Astrophysics Source Code Library, record ascl:1308.017
2013
-
[16]
J., Hutchings , J
Doyon , R., Willott , C. J., Hutchings , J. B., et al. 2023, , 135, 098001, 10.1088/1538-3873/acd41b
2023 doi
-
[17]
2023, , 614, 670, 10.1038/s41586-022-05674-1
Feinstein et al., , A. 2023, , 614, 670, 10.1038/s41586-022-05674-1
2023 doi
-
[18]
2024, , 528, 3354, 10.1093/mnras/stad3813
Fournier-Tondreau et al., , M. 2024, , 528, 3354, 10.1093/mnras/stad3813
2024 doi
-
[19]
France , K., Loyd , R. O. P., Youngblood , A., et al. 2016, , 820, 89, 10.3847/0004-637X/820/2/89
2016 doi
-
[20]
2022, , 940, L35, 10.3847/2041-8213/ac9977
Fu et al., , G. 2022, , 940, L35, 10.3847/2041-8213/ac9977
2022 doi
-
[21]
2009, The Solar Corona (Cambridge University Press)
Golub , L. 2009, The Solar Corona (Cambridge University Press)
2009
-
[22]
Grant, D., & Wakeford, H. R. 2022, Exo-TiC/ExoTiC-LD: ExoTiC-LD v3.0.0, v3.0.0, Zenodo, 10.5281/zenodo.7437681
2022 doi
-
[23]
1939, Naturwissenschaften, 27, 214, 10.1007/BF01488890
Grotrian , W. 1939, Naturwissenschaften, 27, 214, 10.1007/BF01488890
1939 doi
-
[24]
D., Bakos , G
Hartman , J. D., Bakos , G. \'A ., Sato , B., et al. 2011, , 726, 52, 10.1088/0004-637X/726/1/52
2011 doi
-
[25]
2023, , 524, 377, 10.1093/mnras/stad1580
Holmberg , M., & Madhusudhan , N. 2023, , 524, 377, 10.1093/mnras/stad1580
2023 doi
-
[26]
2023, , 959, 64, 10.3847/1538-4357/acfe75
Howard et al., , W. 2023, , 959, 64, 10.3847/1538-4357/acfe75
2023 doi
-
[27]
2013, , 553, A6, 10.1051/0004-6361/201219058
Husser , T.-O. 2013, , 553, A6, 10.1051/0004-6361/201219058
2013 doi
-
[28]
1939, Theory of Probability (Oxford, England: Clarendon Press)
Jeffreys, H. 1939, Theory of Probability (Oxford, England: Clarendon Press)
1939
- [29]
- [30]
-
[31]
2023, , 955, L22, 10.3847/2041-8213/acf7c4
Lim et al., , O. 2023, , 955, L22, 10.3847/2041-8213/acf7c4
2023 doi
-
[32]
2019, Host Stars and their Effects on Exoplanet Atmospheres : An Introductory Overview, 1st edn., Lecture Notes in Physics, 955 (Cham: Springer International Publishing)
Linsky, J. 2019, Host Stars and their Effects on Exoplanet Atmospheres : An Introductory Overview, 1st edn., Lecture Notes in Physics, 955 (Cham: Springer International Publishing)
2019
-
[33]
Linsky , J. L. 1980, , 18, 439, 10.1146/annurev.aa.18.090180.002255
1980
-
[34]
1868, Proceedings of the Royal Society of London Series I, 17, 91
Lockyer , J. 1868, Proceedings of the Royal Society of London Series I, 17, 91
-
[35]
MacDonald, R. J. 2023, Journal of Open Source Software, 8, 4873, 10.21105/joss.04873
2023 doi
-
[36]
J., & Madhusudhan , N
MacDonald , R. J., & Madhusudhan , N. 2017, , 469, 1979, 10.1093/mnras/stx804
2017 doi
-
[37]
MacDonald et al., , R. J. 2020, , 893, L43, 10.3847/2041-8213/ab8238
2020 doi
-
[38]
2009, , 707, 24, 10.1088/0004-637X/707/1/24
Madhusudhan , N., & Seager , S. 2009, , 707, 24, 10.1088/0004-637X/707/1/24
2009 doi
-
[39]
2002, , 580, L171, 10.1086/345520
Mandel , K., & Agol , E. 2002, , 580, L171, 10.1086/345520
2002 doi
-
[40]
M., MacDonald , R
May , E. M., MacDonald , R. J., Bennett , K. A., et al. 2023, , 959, L9, 10.3847/2041-8213/ad054f
2023 doi
-
[41]
E., Stevenson , K
Moran , S. E., Stevenson , K. B., Sing , D. K., et al. 2023, , 948, L11, 10.3847/2041-8213/accb9c
2023 doi
-
[42]
2022, Research Notes of the American Astronomical Society, 6, 272, 10.3847/2515-5172/acabc7
Nikolov et al., , N. 2022, Research Notes of the American Astronomical Society, 6, 272, 10.3847/2515-5172/acabc7
2022 doi
-
[43]
A., et al
Paragas , K., Vissapragada , S., Knutson , H. A., et al. 2021, , 909, L10, 10.3847/2041-8213/abe706
2021 doi
-
[44]
A., & Espinoza, N
Patel, J. A., & Espinoza, N. 2022, The Astronomical Journal, 163, 228, 10.3847/1538-3881/ac5f55
2022 doi
-
[45]
2024, , 683, A125, 10.1051/0004-6361/202348263
Perdelwitz et al., , V. 2024, , 683, A125, 10.1051/0004-6361/202348263
2024 doi
-
[46]
D., Thompson , B
Pesnell , W. D., Thompson , B. J., & Chamberlin , P. C. 2012, , 275, 3, 10.1007/s11207-011-9841-3
2012 doi
-
[47]
Peter , H., & Dwivedi , B. N. 2014, Frontiers in Astronomy and Space Sciences, 1, 2, 10.3389/fspas.2014.00002
2014
-
[48]
2024, , 626, 979, 10.1038/s41586-024-07040-9
Powell et al., , D. 2024, , 626, 979, 10.1038/s41586-024-07040-9
2024 doi
-
[49]
2018, , 853, 122, 10.3847/1538-4357/aaa08c
Rackham , B. 2018, , 853, 122, 10.3847/1538-4357/aaa08c
2018 doi
-
[50]
2024 a , , 962, L20, 10.3847/2041-8213/ad20e4
Radica , M., Coulombe , L.-P., Taylor , J., et al. 2024 a , , 962, L20, 10.3847/2041-8213/ad20e4
2024 doi
- [51]
-
[52]
Rustamkulov et al. , Z. 2023, , 614, 659, 10.1038/s41586-022-05677-y
2023 doi
- [53]
-
[54]
2023, , 524, 817, 10.1093/mnras/stad1547
Taylor , J., Radica , M., Welbanks , L., et al. 2023, , 524, 817, 10.1093/mnras/stad1547
2023 doi
-
[55]
2000, Journal of Mathematical Psychology, 44, 92, https://doi.org/10.1006/jmps.1999.1278
Wasserman, L. 2000, Journal of Mathematical Psychology, 44, 92, https://doi.org/10.1006/jmps.1999.1278
2000
-
[56]
E., Schmieder , B., Kucera , T., et al
Wiik , J. E., Schmieder , B., Kucera , T., et al. 1997, , 175, 411, 10.1023/A:1004925024794
1997 doi
- [57]
-
[58]
2024, , 963, L5, 10.3847/2041-8213/ad2682
Xue et al., , Q. 2024, , 963, L5, 10.3847/2041-8213/ad2682
2024 doi
-
[59]
write newline
" write newline "" before.all 'output.state := FUNCTION string.to.integer 't := t text.length 'k := #1 'char.num := t char.num #1 substring 's := s is.num s "." = or char.num k = not and char.num #1 + 'char.num := while char.num #1 - 'char.num := t #1 char.num substring FUNCTI...
Reviewed August 9, 2026 · model on record in the stance chip above.
Discussion (0). Continue with ORCID to comment.