REVIEW 5 major objections 6 minor 14 references
Analysis of User Dwell Time by Category in News Application
T0 review · 5 major / 6 minor · reviewed 2026-08-14 · deepseek-v4-flash
Pith's one-line read News dwell time varies by category, and short visits can still satisfy the reader.
desk verdict Useful category-level dwell-time data, but the headline correlation gap and the satisfaction claim need more support before I'd trust them. read the letter →
The pith
A machine-rendered reading of the paper's core claim, the machinery that carries it, and where it could break.
The reading
What carries the argument
The analysis is carried by three mechanisms. First, per-page dwell time is defined as the median dwell time over all viewers, chosen because a user who leaves the app open produces extreme outliers. Second, the relation to page length is summarized by Pearson's correlation coefficient computed separately within each of the eight categories, and the spread of those coefficients is the evidence for category dependence. Third, the satisfaction claim rests on a four-question manual content review of short-dwell pages, classifying whether the title alone carries enough information and whether photos match the user's expectation. The named object carrying the argument is the category-specific correlation $r$ between dwell time and page length, with politics $r=0.602$ and technology $r=0.245$ as the extremes.
What would settle it
Re-run the dwell-time/length correlation on all news pages, not just the top 10% by views, and have independent judges label categories and rate the 321 short-dwell pages on the four questions; if the politics-technology gap shrinks or the "yes" rates fall below a majority, the paper's central claims fail.
Extended reading notes
Core claim
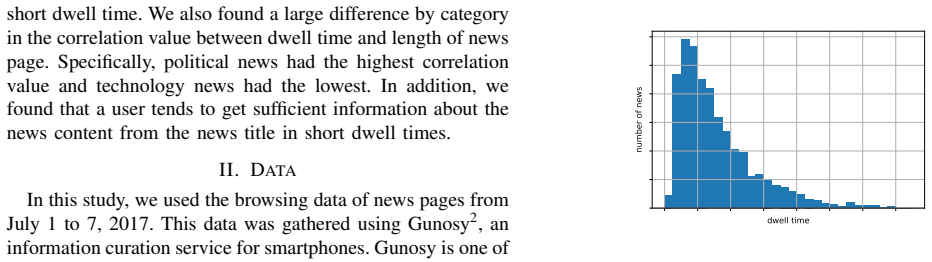
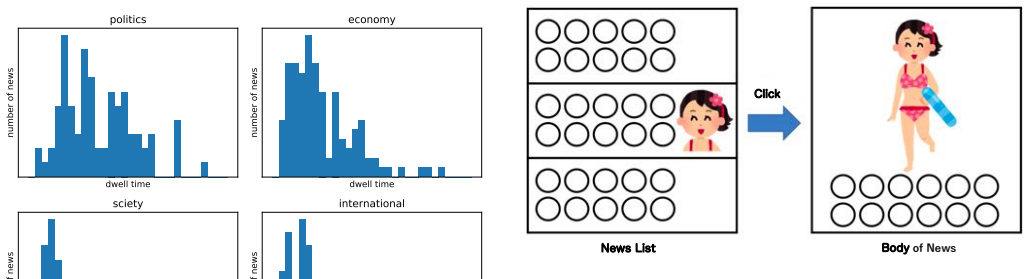
The paper reports three findings. First, the shape of the dwell-time histogram differs by category: society has fewer very-short-dwell-time pages than other categories, while entertainment has many; economy decays slowly toward long dwell times, and column behaves like society with a gentler decay. Second, the Pearson correlation between per-page dwell time (median across users) and page length is category-dependent: politics, sports, and international sit around 0.53-0.60, whereas technology, entertainment, and column sit around 0.25-0.37, and the overall correlation of 0.291 is dragged by the category mix. Third, in a manual review of the 321 shortest-dwell pages, the author answered "yes" to "does the title have enough information?" for 253 pages, "are title and body matched?" for 246, "does the title recall photos?" for 273, and "does a proper photo appear?" for 209; the authors take this as evidence that short dwell times often reflect satisfied users who got the content from title and photos rather than from reading the text.
Load-bearing premise
The load-bearing premise is that the pages and category labels used for the analysis represent normal reading behavior; if the top-10-percent popularity filter, the service's automatic category labels, or one person's judgments on 321 short-dwell pages are not representative, the reported category differences could be artifacts.
Editorial extensions
If this is right
- Products that score pages by dwell time should calibrate thresholds per category; a time span that flags a technology page as unread may be normal for an entertainment page.
- Length-based predictions of engagement will be reliable only for categories like politics and sports, where dwell time and page length correlate around 0.6, and nearly useless for technology and entertainment, where the correlation is below 0.4.
- News-quality metrics built on dwell time should treat short visits as inconclusive unless the title and photo content are also assessed, since many short-dwell pages appear to satisfy the user.
- The category mix of a traffic sample matters: aggregating pages across categories without controlling for category will understate or obscure the true dwell-time/length relationship.
Reading between the lines
- If the top-10-percent-by-page-views filter is hiding a different pattern in long-tail pages, then a testable extension is to rerun the analysis on the full page corpus and check whether the politics-technology gap survives.
- The photo-recall finding suggests that visual thumbnails, especially face-centered crops, can end a reading session early without dissatisfaction; an A/B test that varies thumbnail cropping while measuring dwell time could turn this observation into a design guideline.
- Dwell time may behave differently on desktop or web reading than in a smartphone app, since the title-and-photo satisfaction mechanism is tied to how the app displays lists and thumbnails; replications on other platforms would show how far the category pattern generalizes.
Signed reviews
Editorial analysis
A structured set of objections, weighed in public.
Referee Report
Summary. The paper analyzes one week (July 1-7, 2017) of Gunosy smartphone news browsing data to characterize dwell time across eight news categories: politics, economy, society, international, technology, sports, entertainment, and column. It addresses three research questions: whether dwell-time distributions differ by category (RQ1), whether dwell time correlates with page length by category (RQ2), and what content characterizes short-dwell-time pages (RQ3). Using the median dwell time per news page and restricting to the top 10% of pages by views within each category, the authors report histograms, Pearson correlations (politics 0.602, technology 0.245, whole 0.291), and the results of a single author annotating 321 short-dwell-time pages. They conclude that category-level dwell-time trends differ, that the dwell-time/length correlation differs materially by category, and that short dwell times can still reflect user satisfaction when the title or photo carries the information.
Significance. If the reported category differences are robust, the paper makes a useful practical point: dwell time should be interpreted category by category in mobile news ranking, recommendation, and advertising. The study is a direct empirical description with no fitted model and no circular derivation, and the use of the median rather than the mean is a sensible way to handle app-launch artifacts. The central claims are falsifiable and could inform future work on engagement metrics. However, the current analysis does not yet secure the headline quantitative claims because it lacks uncertainty quantification, provides no sensitivity analysis for the page-view filter, and relies on an unvalidated subjective annotation. The paper's value is conditional on making these supporting analyses available.
major comments (5)
- [Section III-B, Table I] The central RQ2 claim that politics has the highest correlation (0.602) and technology the lowest (0.245) is reported without confidence intervals, significance tests, or per-category sample sizes; the '# of news' column reports only percentage shares. A gap of 0.357 between two Pearson correlations can be within sampling error, especially if some categories contribute only a few hundred pages, so the current table does not rule out that the observed ordering is noise. Please report exact counts, confidence intervals (e.g., via Fisher z-transformation or bootstrap), and significance tests for the pairwise differences.
- [Section II] The restriction to the top 10% of news pages by page views within each category is a free parameter with no sensitivity analysis. If page popularity is correlated with reading behavior, the within-category distributions and correlations describe only popular pages, not the categories as a whole; the authors should repeat the analysis at alternative thresholds (e.g., 5%, 20%, all pages) or justify the filter empirically.
- [Section III-C] The short-dwell-time conclusion rests on one author's answers to four binary questions for 321 pages, but the paper never defines the 'certain limit' used to select short-dwell-time pages, and there is no inter-rater reliability or validation that the questions measure satisfaction. The abstract's statement that 'a user tends to get sufficient information' overstates what these annotations can support; this should be framed as an exploratory content analysis.
- [Section III-A] RQ1 is supported only by visual inspection of histograms whose y-axes differ across categories and whose x-axis uses relative values; no distributional test (e.g., Kolmogorov-Smirnov, quantile comparisons) is reported. The claim of 'different dwell time trends for each category' needs a quantitative test or at least descriptive statistics with confidence intervals.
- [Section II] The category labels come from Gunosy's proprietary heuristic and machine-learning classifier, but no accuracy or validation of this classifier is reported. Measurement error in category labels could attenuate or distort category-level differences; the paper should report a validation result or discuss the likely impact of label noise.
minor comments (6)
- [Title page] The affiliation 'Toyohashi University of Technorogy' contains a typo; 'Technorogy' should be 'Technology'.
- [Section III-A] The sentence 'The visualization does not include e do not use news pages whose dwell time is over a certain threshold for visualization' is garbled and should be rewritten.
- [Fig. 2] The 'society' panel in Fig. 2 is mislabeled as 'sciety'.
- [Section III-A] The statement that 'the values of the x-axis and the y-axis are equally spaced' is unclear; please specify the bin widths and what 'relative values' means for the x-axis.
- [Section II] The page length is said to vary by device, but the paper never defines how page length is measured (e.g., characters, pixels, or scroll height); this should be stated for reproducibility.
- [Index Terms] The Index Terms entry 'click bait' is usually written 'clickbait'.
Circularity Check
No circularity: purely descriptive empirical analysis with no fitted model, no prediction, and no self-citation chain.
full rationale
The paper is a descriptive study of dwell time in a news application. It defines dwell time as the median per-page value, computes histograms and Pearson correlations with page length, and reports the author's answers to four subjective questions about short-dwell-time pages. There is no derivation, no fitted parameter, and no quantity that is predicted from an assumed model. The central claims are direct empirical summaries of the data: category differences in dwell-time distributions and in the dwell-time/length correlation, and an annotation-based argument that short dwell times can accompany satisfaction. The subjective author annotation is a methodological limitation, not a circular step, because the conclusion does not presuppose the annotation result; it is simply the annotation result. The top-10% page-view filter is a data-selection choice, not a result smuggled in as an input. The paper cites prior work for context and motivation, but no load-bearing argument reduces to a self-citation. Therefore there is no significant circularity.
Assumptions & free parameters
free parameters (2)
- Page-view percentile filter =
top 10% page views per category
- Short-dwell-time threshold (unspecified) =
not disclosed; paper says 'over a certain threshold' and 'not over a certain limit'
assumptions (5)
- domain assumption Dwell time for a news page is represented by the median of per-user maximum dwell times.
- domain assumption Only the top 10% of news pages by page views within each category are analyzed.
- domain assumption Gunosy's category labels, assigned by heuristic rules and supervised machine learning, are accurate enough for analysis.
- domain assumption For short dwell times, user satisfaction can be inferred from four yes/no questions about title and photo content answered by one of the authors.
- standard math Pearson's correlation coefficient is a suitable measure of the association between dwell time and page length.
Cite this review
Pith. "Pith review of Analysis of User Dwell Time by Category in News Application." pith.science (2026). https://pith.science/paper/6WADBWJH
@misc{pith2026190808690,
  author       = {Pith},
  title        = {Pith review of: Analysis of User Dwell Time by Category in News Application},
  year         = {2026},
  howpublished = {\url{https://pith.science/paper/6WADBWJH}},
  note         = {Machine review of arXiv:1908.08690}
}
read the original abstract
Dwell time indicates how long a user looked at a page, and this is used especially in fields where ratings from users such as search engines, recommender systems, and advertisements are important. Despite the importance of this index, however, its characteristics are not well known. In this paper, we analyze the dwell time of news pages according to category in smartphone application. Our aim is to clarify the characteristics of dwell time and the relation between length of news page and dwell time, for each category. The results indicated different dwell time trends for each category. For example, the social category had fewer news pages with shorter dwell time than peaks, compared to other categories, and there were a few news pages with remarkably short dwell time. We also found a large difference by category in the correlation value between dwell time and length of news page. Specifically, political news had the highest correlation value and technology news had the lowest. In addition, we found that a user tends to get sufficient information about the news content from the news title in short dwell times.
Figures

Reference graph
Works this paper leans on
-
[1]
The development and evaluation of a survey to measure user engagement,
H. L. O’Brien and E. G. Toms, “The development and evaluation of a survey to measure user engagement,” Journal of the American Society for Information Science and Technology , vol. 61, no. 1, pp. 50–69, 2010
work page 2010
-
[2]
Improving web search ranking by incorporating user behavior information,
E. Agichtein, E. Brill, and S. Dumais, “Improving web search ranking by incorporating user behavior information,” in Proceedings of the 29th annual international ACM SIGIR conference on Research and development in information retrieval , 2006, p. 19
work page 2006
-
[3]
Information Filtering Based on User Behavior Analysis and Best Match Text Retrieval,
M. Morita and Y . Shinoda, “Information Filtering Based on User Behavior Analysis and Best Match Text Retrieval,” in Proceedings of the 17th annual international ACM SIGIR conference on Research and development in information retrieval , 1994, pp. 272–281
work page 1994
-
[4]
Beyond clicks: dwell time for personalization,
X. Yi, L. Hong, E. Zhong, N. N. Liu, and S. Rajan, “Beyond clicks: dwell time for personalization,” in Proceedings of the 8th ACM Confer- ence on Recommender systems , 2014, pp. 113–120
work page 2014
-
[5]
Promoting Positive Post-Click Experience for In-Stream Yahoo Gemini Users,
M. Lalmas, J. Lehmann, G. Shaked, F. Silvestri, and G. Tolomei, “Promoting Positive Post-Click Experience for In-Stream Yahoo Gemini Users,” in Proceedings of the 21th ACM SIGKDD International Confer- ence on Knowledge Discovery and Data Mining , 2015, pp. 1929–1938
work page 2015
-
[6]
Predicting Pre-click Quality for Native Advertisements,
K. Zhou, M. Redi, A. Haines, and M. Lalmas, “Predicting Pre-click Quality for Native Advertisements,” in Proceedings of the 25th Interna- tional Conference on World Wide Web , 2016, pp. 299–310
work page 2016
-
[7]
Social Media and Fake News in the 2016 Election,
H. Allcott and M. Gentzkow, “Social Media and Fake News in the 2016 Election,” Journal of Economic Perspectives, vol. 31, no. 2, pp. 211–236, 2017
work page 2016
-
[8]
P. Bourgonje, J. Moreno Schneider, and G. Rehm, “From Clickbait to Fake News Detection: An Approach based on Detecting the Stance of Headlines to Articles,” in Proceedings of the 2017 EMNLP Workshop: Natural Language Processing meets Journalism , 2017, pp. 84–89
work page 2017
Show all 14 references
-
[9]
Stop Clickbait: Detecting and preventing clickbaits in online news media,
A. Chakraborty, B. Paranjape, S. Kakarla, and N. Ganguly, “Stop Clickbait: Detecting and preventing clickbaits in online news media,” in Proceedings of the 2016 IEEE/ACM International Conference on Advances in Social Networks Analysis and Mining , 2016, pp. 9–16
2016
-
[10]
Clickbait Detection,
M. Potthast, S. K ¨opsel, B. Stein, and M. Hagen, “Clickbait Detection,” in Proceedings of the 38th European Conference on IR Research , 2016, pp. 810–817
2016
-
[11]
The Pulse of News in Social Media: Forecasting Popularity,
R. Bandari, S. Asur, and B. A. Huberman, “The Pulse of News in Social Media: Forecasting Popularity,” inProceedings of the Sixth International AAAI Conference on Weblogs and Social Media , 2012, pp. 26–33
2012
-
[12]
Understanding web browsing behaviors through Weibull analysis of dwell time,
C. Liu, R. W. White, and S. Dumais, “Understanding web browsing behaviors through Weibull analysis of dwell time,” in Proceeding of the 33rd international ACM SIGIR conference on Research and development in information retrieval , 2010, p. 379
2010
-
[13]
Understanding User Attention and Engage- ment in Online News Reading,
D. Lagun and M. Lalmas, “Understanding User Attention and Engage- ment in Online News Reading,” in Proceedings of the Ninth ACM International Conference on Web Search and Data Mining , 2016, pp. 113–122
2016
-
[14]
Latent Dirichlet Allocation,
D. M. Blei, A. Y . Ng, and M. I. Jordan, “Latent Dirichlet Allocation,” Journal of Machine Learning Research , vol. 3, no. Jan, pp. 993–1022, 2003
2003
Reviewed August 14, 2026 · model on record in the stance chip above.
Discussion (0). Continue with ORCID to comment.