REVIEW 3 major objections 4 minor 8 references
CHRONEX-US: City-level historical road network expansion dataset for the conterminous United States
T0 review · 3 major / 4 minor · reviewed 2026-08-15 · deepseek-v4-flash
Pith's one-line read This paper introduces a public geospatial dataset that assigns construction-epoch estimates to local road segments across 693 U.S.
desk verdict A genuinely useful, honestly documented road-age dataset for U.S. metro areas; the core building-road coupling is untested, but the paper's transparency makes it worth peer review. read the letter →
The pith
A machine-rendered reading of the paper's core claim, the machinery that carries it, and where it could break.
The reading
What carries the argument
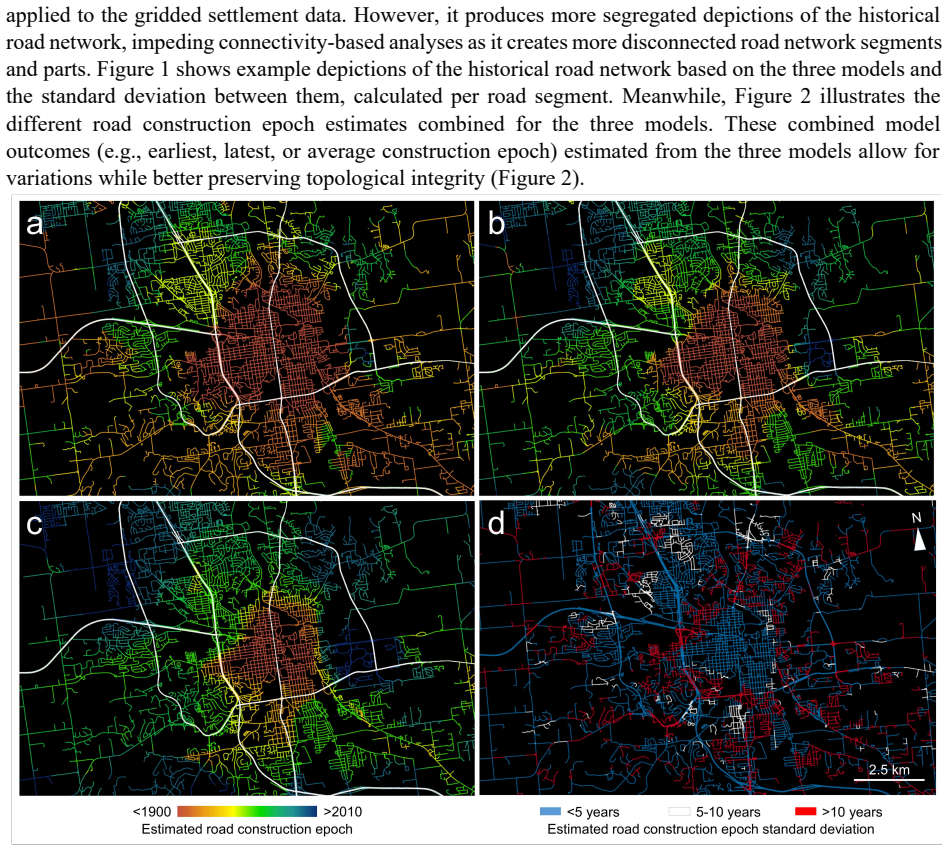
The operation that carries the argument is the overlay of the 2018 road network with historical built-up area polygons: a road segment that falls within the extent of 1920 but not earlier is assigned a lower bound of 1910 and an upper bound of 1920. The historical extents are derived from gridded building-footprint-area surfaces by retaining the top decile of high-density patches per year, which defines the historical urban and peri-urban fringe. Three model variants, M1 and the 500m and 1000m inward-buffered M2 and M3, encode the uncertainty in that spatial generalization.
What would settle it
Take a sample of neighborhoods across several CBSAs and compare CHRONEX-US construction-epoch estimates with independently dated road construction records, such as subdivision plats or street-opening permits. A systematic lag between building era and road era, or large disagreements concentrated in certain regions or road classes, would show that the central assumption fails in those settings.
Extended reading notes
Core claim
The paper's central claim is that the age of a local residential road segment can be inferred from the epoch in which the surrounding neighborhood was first built up, and that this inference can be operationalized at national scale by intersecting present-day road vectors with historical generalized built-up area polygons. CHRONEX-US reports, for every segment in 693 CBSAs, lower and upper construction-year bounds from three models: a baseline model that may overestimate age, and two inward-buffered variants that trade connectivity for a more conservative urban fringe. To support uncertainty analysis, each segment also carries the minimum, maximum, mean, and standard deviation of the across-model estimates. The authors present visual comparisons to early historical topographic maps and trend comparisons to independent modeled road networks as plausibility checks.
Load-bearing premise
The load-bearing premise is that roads and buildings in a neighborhood were built in roughly the same epoch, so the age of the current building stock can be used to date the local street network; if road construction systematically lags or infill redevelopment decouples building age from original street age, every epoch estimate inherits that bias.
Editorial extensions
If this is right
- Researchers can reconstruct, for each of 693 CBSAs, a time series of total urban road length from 1900 to today, including growth-rate changes such as the slowdown after the 1980s.
- Because topological integrity is inherited from the source road data, the temporal strata can be used in routing and connectivity analyses, not just length tallies.
- The MTFCC road-type attribute allows stratification by road category, while non-local roads can be excluded because the model assumptions do not apply to highways.
- Per-segment cross-model uncertainty measures let users weight or filter segments according to model agreement.
- Combined min, max, and mean epoch estimates provide a way to build historical road networks that preserve connectivity better than any single buffered model.
Reading between the lines
- Editorial inference: If the building-road coupling holds broadly, the dataset is also a proxy for the timing of land development itself, so it could be joined with demographic or economic time series to study the sequencing of infrastructure and population growth.
- Editorial inference: A natural extension is to validate the epoch labels against independent municipal street-construction or subdivision records in a sample of cities and to quantify how the bias varies by region and road type.
- Editorial inference: The same overlay logic could be transferred to other countries that have building-age footprints but lack historical road maps, producing comparable national road-expansion datasets.
Signed reviews
Editorial analysis
A structured set of objections, weighed in public.
Referee Report
Summary. The paper introduces CHRONEX-US, a publicly available vector dataset that assigns estimated construction-year bounds to local residential road segments in 693 U.S. core-based statistical areas. The method overlays the contemporary USGS National Transportation Dataset on historical built-up area polygons derived from HISDAC-US building-age information, generating lower and upper construction epoch estimates under a baseline model (M1) and two inward-buffered variants (M2, M3). The authors describe the data record, attribute schema, and limitations, and provide a qualitative visual evaluation against historical topographic maps. The stated central claim is that CHRONEX-US provides model-based construction epoch estimates, not ground-truth measurements, and the paper explicitly cautions against segment-level use.
Significance. If the dataset performs as described, it fills a genuine gap: there is currently no open, nation-level vector dataset of historical road construction epochs covering nearly 700 U.S. urban areas with topological integrity preserved from modern NTD data. The dataset's three-model structure, per-segment lower/upper bounds, and MTFCC stratification are useful design choices for downstream analyses of road network growth, connectivity, and transportation inequality. The paper is transparent about the model-based nature of the estimates and about several known failure modes. The main uncertainty is whether the building-to-road temporal transfer is accurate enough for the intended aggregate trend analyses; the qualitative evaluation currently does not constrain this transfer quantitatively.
major comments (3)
- [§3.2 (Assumption 1) and §3.4 (Evaluation)] Assumption 1, that the majority building epoch in a neighborhood approximates the road construction epoch, is the load-bearing transfer mechanism of the entire dataset, but the evaluation in §3.4 does not test it. The visual comparison with historical maps tests only the spatial footprint of the modeled road network, not the temporal correspondence of individual segments. A systematic lag between building construction and road construction, or decoupling via infill and redevelopment, would bias all downstream trend analyses. The paper needs either quantitative validation against segment-level reference data (e.g., from historical maps in a few cities) or a carefully bounded sensitivity analysis showing that plausible lags do not change the reported national and CBSA-level growth trends.
- [§3.1 and §3.3 (threshold choices and M2/M3 corrections)] The GBUA delineation uses several ad hoc thresholds (5% built-up density, top-10% segment retention, 1-km focal window, and -500 m / -1000 m inward buffers). The Albany example in §3.4 shows that the method can considerably overestimate early road extents in already-dense early-1900s areas, indicating that the thresholds are not universally appropriate. M2 and M3 only shrink the GBUA polygons inward; they do not alter the density or percentile thresholds. The paper should report at least a one-at-a-time sensitivity analysis of these thresholds, or clearly state which threshold combinations are most robust, so users can judge whether the M1-M3 spread brackets the likely error.
- [§5 (Limitations) and §4 (Data records)] The paper states that trends derived from CHRONEX-US (Model 1) have been compared with analytical results from other historical road network models and that results largely agree, but this comparison is only cited (Burghardt et al. 2022) and not shown in the manuscript. Since the §3.4 evaluation is only qualitative, this cited trend comparison is the only quantitative evidence of external validity, and the reader cannot assess its strength without seeing the relevant statistics. A figure or table summarizing the agreement with Barrington-Leigh and Millard-Ball (2015) or Boeing (2021) should be included or reproduced.
minor comments (4)
- [Abstract] The phrase 'for the conterminous United States' and the coverage of 'densely and semi-densely built-up spaces' are clear, but the abstract could state more explicitly that the dataset is intended for aggregate network-level analyses rather than segment-level use, since this is a key limitation stated later.
- [§3.4 and Figure 4 caption] Figure 4's boxplot in panel (c) is described as showing 'the 11 models' but the text references only three model variants plus combined estimates; please clarify the exact set of 11 model outputs or rephrase.
- [§4] The paper mentions that the mean, standard deviation, and range are reported only for upper bounds because lower bounds can be 0; it would help to state explicitly that yr_lower_min and yr_lower_max are also provided, or to list all attribute names in one table.
- [§2] Typo in the introduction: 'becaused data collection' should be 'because data collection'.
Circularity Check
No significant circularity: road epochs are model-based overlays, not fitted outputs.
full rationale
CHRONEX-US derives road construction epoch estimates by overlaying NTD road polylines on historical built-up area extents (GBUA) derived from building property and footprint data (HISDAC-US BUFA/BUPL). The output is a deterministic function of building-age-derived settlement polygons and present-day road geometry; no road-age data are used in the model, and the estimates are not fitted to road-age observations. Load-bearing Assumption 1 (building-road construction coherence) is an explicit modeling assumption, not a tautology or a self-citation. Evaluation uses external USGS historical topographic maps, and the cited trend agreement (Burghardt et al. 2022) refers to external comparisons with Barrington-Leigh and Millard-Ball (2015) and Boeing (2021). Limitations explicitly caution that segment-level estimates may be incorrect. No prediction reduces to its inputs by construction.
Assumptions & free parameters
free parameters (4)
- Minimum built-up surface density threshold =
5%
- Percentile of high-density segments retained =
top 10%
- Focal window radius for density surfaces =
1 km
- Inward buffer distances for M2 and M3 =
-500 m (M2), -1000 m (M3)
assumptions (4)
- domain assumption Buildings and roads in a neighborhood are built in roughly the same epoch.
- domain assumption The dominant age of the contemporary building stock reflects the period of first development.
- domain assumption Local residential road networks only grow and are never removed or re-laid-out.
- domain assumption HISDAC-US and ZTRAX property records are sufficiently complete and accurate for historical building density.
Cite this review
Pith. "Pith review of CHRONEX-US: City-level historical road network expansion dataset for the conterminous United States." pith.science (2026). https://pith.science/paper/6WMLFQRU
@misc{pith2026250616625,
  author       = {Pith},
  title        = {Pith review of: CHRONEX-US: City-level historical road network expansion dataset for the conterminous United States},
  year         = {2026},
  howpublished = {\url{https://pith.science/paper/6WMLFQRU}},
  note         = {Machine review of arXiv:2506.16625}
}
read the original abstract
Geospatial datasets on the long-term evolution of road networks are scarce, hampering our quantitative understanding of how the contemporary road network has evolved over the course of the 20th century. However, such information is crucial to better understand the dynamics of road network growth and expansion, and to shed light on the consequences of (sub-) urbanization processes, such as increasing mobility, traffic congestion, land take and transportation inequality. Herein, we describe CHRONEX-US ('City-level historical road network expansion dataset for the conterminous United States'), a geospatial vector dataset reporting estimates of the construction year for each road segment in densely and semi-densely built-up spaces within 693 core-based statistical areas (i.e., Metropolitan and Micropolitan statistical areas) in the conterminous US. CHRONEX-US is based on the USGS National Transportation Dataset (NTD), integrated with the historical settlement compilation for the US (HISDAC-US). CHRONEX-US reports model-based construction epoch estimates for local residential road network segments within urban and peri-urban areas, using different model-based scenarios. The vector data inherit topological integrity from the NTD data allowing for routing and other connectivity-based analyses within temporal strata of urban road networks. CHRONEX-US vector geometries are attributed with the US Census Bureau's MAF/TIGER Feature Class Code (MTFCC), enabling stratification of the data by road category. CHRONEX-US is available at https://doi.org/10.6084/m9.figshare.28644674.
Figures


Figures from the paper (1 more)

Reference graph
Works this paper leans on
-
[1]
Avcı, C., Sertel, E., & Kabadayı, M. E. (2022). Deep learning-based road extraction from historical maps. IEEE Geoscience and Remote Sensing Letters, 19, 1-5. Barrington-Leigh, C., & Millard-Ball, A. (2015). A century of sprawl in the United States. Proceedings of the National Academy of Sciences, 112(27), 8244-8249. Barrington-Leigh, C., & Millard-Ball, ...
work page 2022
-
[7]
National Transportation Dataset
United States Geological Survey (USGS) (2019). National Transportation Dataset. Available online: https://data.usgs.gov/datacatalog/data/USGS:ad3d631d-f51f-4b6a-91a3-e617d6a58b4e. Last access: March
work page 2019
-
[8]
TopoView historical topographic map viewer
United States Geological Survey (USGS) (2025). TopoView historical topographic map viewer. Available online. https://ngmdb.usgs.gov/topoview/viewer. Last access: March 2025
work page 2025
-
[464]
Thévenin, T., & Mimeur, C. (2023). Mapping Half a Century of Accessibility via the French Railway Network, 1860–1910. In Creative Ways to apply Historical GIS: Promoting Research and Teaching about Europe (pp. 149-162). Cham: Springer International Publishing. 10 Turner, H., Lahoorpoor, B., & Levinson, D. M. (2023). Creating a dataset of historic roads in...
work page 2023
-
[683]
Uhl, J. H., & Burghardt, K. (2022). Historical, generalized built-up areas in us core-based statistical areas 1900-2015. figshare. Dataset. https://doi.org/10.6084/m9.figshare.19593409.v2 Uhl, J. H., Leyk, S., McShane, C. M., Braswell, A. E., Connor, D. S., & Balk, D. (2021). Fine-grained, spatiotemporal datasets measuring 200 years of land development in...
-
[2015]
Universal Patterns in the Long-term Growth of Urban Infrastructure in U.S. Cities from 1900 to 2015
arXiv preprint arXiv:2412.13181. Chiang, Y. Y., Duan, W., Leyk, S., Uhl, J. H., Knoblock, C. A., Chiang, Y. Y., ... & Knoblock, C. A. (2020). Training deep learning models for geographic feature recognition from historical maps. Using historical maps in scientific studies: Applications, challenges, and best practices, 65-98. Jaworski, T., Kitchens, C., & ...
work page Pith review arXiv 2020
-
[2025]
Saeedimoghaddam, M., & Stepinski, T. F. (2020). Automatic extraction of road intersection points from USGS historical map series using deep convolutional neural networks. International Journal of Geographical Information Science, 34(5), 947-968. Sertel, E., Hucko, C. M., & Kabadayı, M. E. (2024). Automatic Road Extraction from Historical Maps Using Transf...
work page 2020
-
[2263]
Burghardt, K., Uhl, J. H., Lerman, K., & Leyk, S. (2024b). Universal Patterns in the Long-term Growth of Urban Infrastructure in US Cities from 1900 to
work page 2024
Reviewed August 15, 2026 · model on record in the stance chip above.
Discussion (0). Continue with ORCID to comment.