REVIEW 4 major objections 5 minor 9 cited by
The JDISC Survey: Linking the Physics and Chemistry of Inner and Outer Protoplanetary Disk Zones
T0 review · 4 major / 5 minor · reviewed 2026-08-15 · deepseek-v4-flash
Pith's one-line read This paper claims that emission from the organic molecules C2H2, HCN, and possibly CO2 in the inner regions of planet-forming disks is optically thin, so the observed mid-infrared line luminosity directly measures the total molecular mass…
desk verdict Valuable legacy dataset for JWST disk chemistry, but the headline pebble-drift trend is weak (p=0.11) and the optical-thinness argument carries a built-in correlation plus a water-subtraction caveat; still warrants serious peer review. read the letter →
The pith
A machine-rendered reading of the paper's core claim, the machinery that carries it, and where it could break.
The reading
What carries the argument
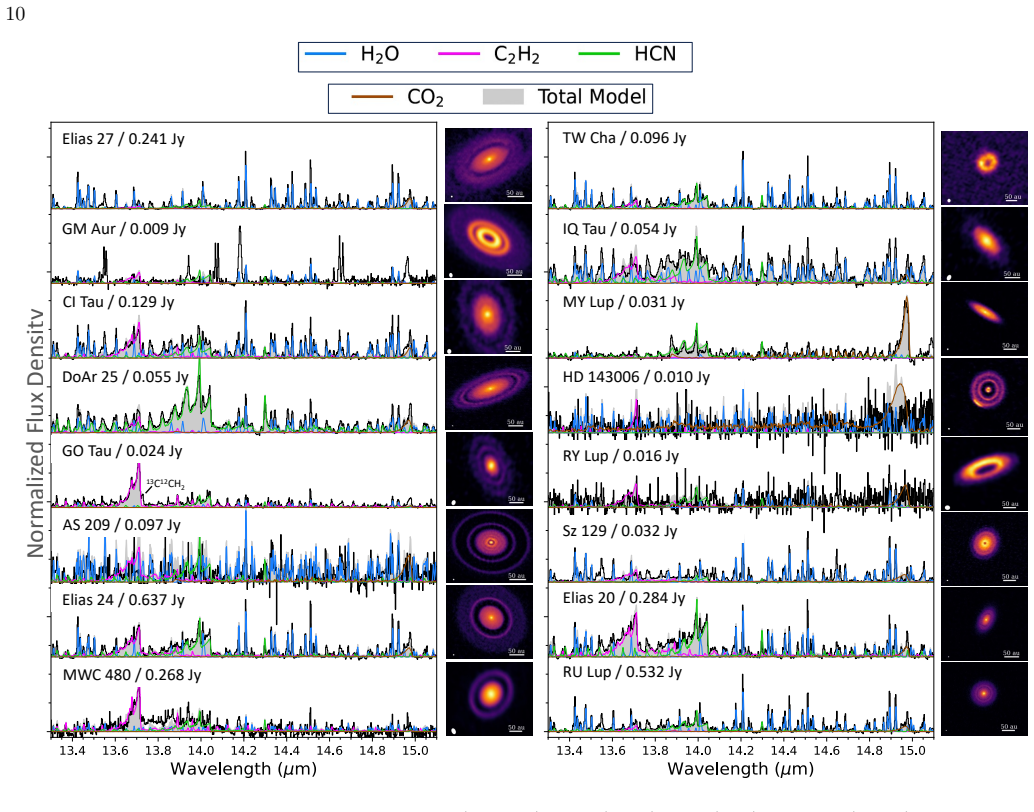
The load-bearing tool is the LTE slab model, a homogeneous gas layer described by temperature, column density, and projected emitting area, fitted to the 12-16 micron spectral region with Markov chain Monte Carlo after first subtracting a single-temperature water model. Its power here is that the fits return families of degenerate (column density, radius) solutions whose integrated luminosity and total mass are nearly invariant; since the luminosity-mass correlation is close to linear, the emission is optically thin, and the degeneracy converts from a flaw into a mass measurement. The ALMA sub-millimeter continuum images supply the outer-disk context, namely dust disk sizes and ring or cavity substructures, against which the inner-disk chemistry is compared.
What would settle it
Detect the 13C12CH2 isotopologue Q-branch near 13.7 microns in a C2H2-bright disk such as AS 205N: at the column densities the optically thin models require, an interstellar 12C/13C ratio near 70 predicts a readily detectable isotopologue line, so a clear non-detection would falsify the large-column-density solutions and the derived masses, while a detection at the predicted strength would confirm the mass interpretation.
Extended reading notes
Core claim
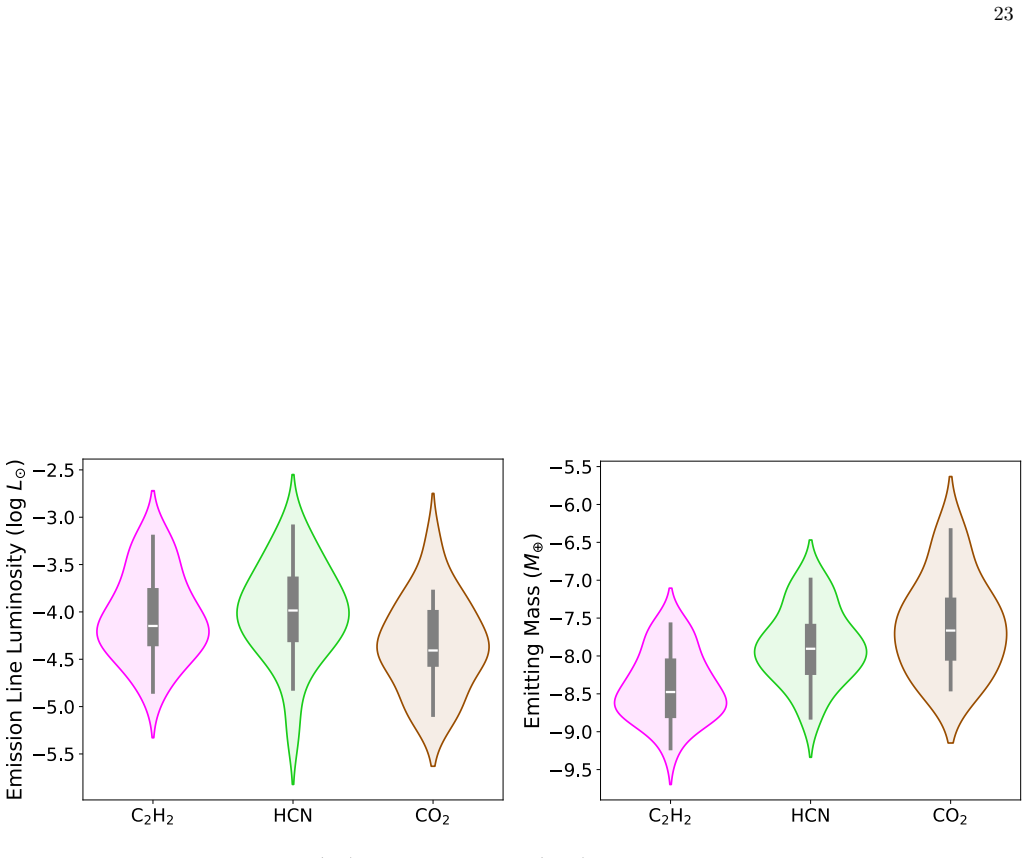
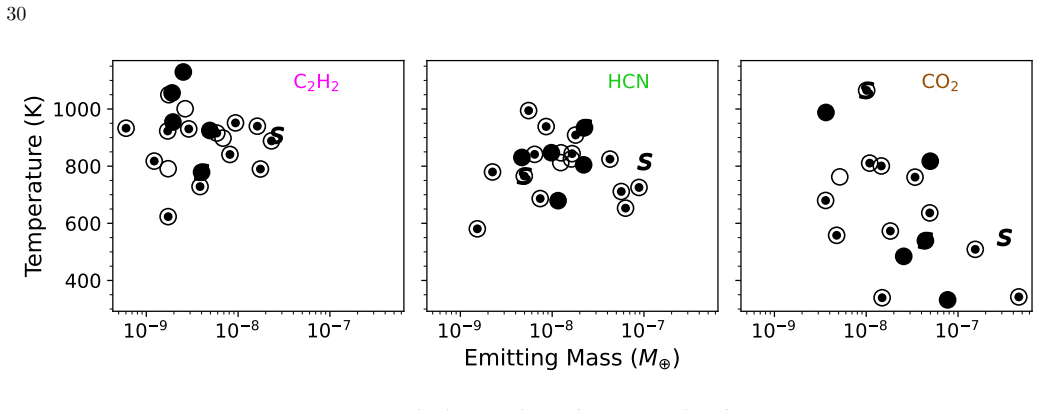
The paper's central claim is that the organic molecules C2H2, HCN, and probably CO2 emit as optically thin gas in the inner disks of T Tauri stars, so the strong degeneracy between column density and emitting radius in slab-model fits is not a nuisance but a route to a physical quantity: total molecular mass. Fits to the 12-16 micron spectra show luminosity scaling nearly linearly with emitting mass (slope near 1 for C2H2 and HCN), as expected for optically thin emission; CO2 has a shallower slope and a cooler median temperature, suggesting it is marginally thicker. The survey also establishes higher detection rates than Spitzer for all molecules, including first detections in transition disks, and reports demographic trends: molecular luminosities correlate with accretion rate, anti-correlate with the 13-26 micron infrared spectral index, and HCN-to-cold-water ratios are low in compact, smooth disks.
Load-bearing premise
The single-temperature LTE water model is subtracted before the organic fits, and the residuals are assumed not to bias the retrieved organic temperatures and optical depths; if hot-band or non-LTE water emission leaks through, the optically thin conclusion and median temperatures could shift.
Editorial extensions
If this is right
- Mid-infrared organic line luminosities can be used directly as relative measures of inner-disk molecular mass, removing the need to know the emitting radius.
- Demographic comparisons with ALMA substructures become meaningful, because disks with dust rings, cavities, or spiral arms can be placed on an equal mass footing with smooth disks.
- The correlation of C2H2, HCN, and CO2 luminosity with mass accretion rate implies that accretion-generated ultraviolet heating is a primary controller of organic line brightness.
- The low HCN-to-cold-water ratios in compact smooth disks support pebble drift as an efficient water delivery mechanism in the absence of dust traps.
- All measured [Ne III]/[Ne II] ratios below unity favor X-ray, not extreme-ultraviolet, irradiation as the driver of disk winds in this sample.
Reading between the lines
- Because optical thinness makes line luminosity a mass tracer, future surveys could use C2H2 and HCN luminosities to map the carbon and nitrogen budgets of inner disks as functions of stellar mass and age, not just accretion rate.
- The paper's interpretation of the pedestal features as dust rather than optically thick gas predicts that high-resolution 10 micron silicate spectroscopy of compact disks should show matching dust composition features, which is a testable extension.
- If CO2 is only marginally optically thin, its 13CO2/12CO2 isotopologue ratio, currently detected in only one JDISCS source, offers a direct route to break the residual CO2 column-density degeneracy.
- The authors' single-temperature water subtraction leaves open the possibility that a second water component biases organic retrievals; extending the fitting to two water components simultaneously is a natural next step.
Signed reviews
Editorial analysis
A structured set of objections, weighed in public.
Referee Report
Summary. The paper presents the first Cycle 1 sample analysis of the JDISCS survey: MIRI-MRS spectra of 31 protoplanetary disks with ALMA millimeter continuum imaging. The authors report near-ubiquitous H2O, OH, and CO emission, higher molecular detection rates than Spitzer-IRS, and LTE slab-model retrievals of temperature, column density, and emitting area for C2H2, HCN, and CO2 in the 12–16 µm region after subtracting a single-temperature water model. They argue that C2H2 and HCN (and possibly CO2) emission is optically thin, so the observations constrain total molecular mass rather than column density or radius separately, and that C2H2 and HCN typically arise in hotter gas than CO2. They also examine correlations with outer disk substructure, finding a tentative trend between HCN/cold-H2O luminosity ratios and dust disk size, and they show that compact-disk 'pedestals' under the organic Q branches are not explained by optically thick C2H2 models. The paper closes with atomic lines ([Ne II], [Ne III], [Ar II]) and their relation to accretion and radiation fields.
Significance. If the conclusions hold, this is a valuable demographic study: it provides a homogeneous, publicly released MIRI-MRS dataset for a sample with high-quality ALMA imaging, demonstrates sensitivity gains over Spitzer, and makes a physically important claim that the inner-disk organic emission is mainly optically thin, thereby lifting the column-density/area degeneracy for total-mass measurements. The paper is commendably explicit about its limitations: it openly discusses the single-temperature water subtraction, the exclusion of flux errors from the loss function, the partial degeneracy of N and r_slab, and the moderate statistical significance of some trends. The isotopologue non-detections and the direct comparison with optically thick models in Section 5.2 provide independent support for parts of the central argument. However, as detailed below, some load-bearing points need additional quantitative support before the headline claims can be considered established.
major comments (4)
- [Section 3.3.1 and Appendix A] The single-temperature LTE water subtraction is acknowledged to leave residuals that include non-LTE signatures and multiple temperature components (Appendix A), and Section 3.3.5 states that CO2 may be particularly dependent on the number of temperature components used to model the H2O. Yet no quantitative test of the impact of this subtraction on the organic retrievals is provided. Because the C2H2 (13.7 µm) and HCN (14.0 µm) Q branches sit in a wavelength region dense with rotational water lines, unsubtracted or mis-subtracted water could be absorbed into the organic slab fits and shift the retrieved temperatures, emitting masses, and inferred optical depths; this would directly propagate into the headline claims of optical thinness and of C2H2/HCN being hotter than CO2. Please add a sensitivity test for at least a subset of sources, such as fitting a two-temperature water model, masking water-dominated spectral regions before fitting the organics, or adding a non-LTE water correction factor, and report how T, M, L, and the derived optical depths change under those alternatives.
- [Section 4.1, Equation (2), and Figure 13] The near-unity slopes of log-L versus log-M for C2H2 and HCN are presented as evidence that the emission is optically thin, but both quantities are outputs of the same slab-model fits and are proportional by construction in the optically thin regime (L is integrated from the model spectrum, and M is derived from the same column density and area, M ∝ N A and L ∝ N A). The set of degenerate solutions within 5% of the minimum L2 norm preserves these products, so the observed slope near 1 is at least partly a consequence of the model construction rather than an independent physical measurement. The isotopologue non-detections and the τ versus N behavior in Figure 15 are more probative for optical thinness. Please either remove the L-M correlation as an argument for thinness, or test it against a null model (e.g., random draws of N and r_slab over the degeneracy set) and state explicitly what the correlation does and does not establish.
- [Section 5.1 and Figure 17] The abstract states that the HCN to cold-H2O luminosity ratios are generally smaller in smooth disks, but the reported Spearman correlation is ρ = 0.36 with p = 0.11, which is not significant at the p < 0.05 threshold used elsewhere in the paper (Section 4.1). The paper itself describes the trend as only marginally statistically significant, but this caveat is not carried into the abstract or the conclusions. Please report this as a tentative trend in the abstract and conclusions, or provide additional statistical support, such as a permutation test or a comparison restricted to the smooth versus structured subsamples, and state the resulting p-value.
- [Sections 3.3.3 and 3.3.5, and Tables 5–7] The detection rates are a headline result, but the threshold for a CO2 detection is not fully reproducible: Section 3.3.5 states that four disks are added on the basis of visual inspection of the Q branch, because any luminosity or peak-to-continuum criterion that includes them also captures non-detections. Since the reported detection rates for CO2 (58% overall) are compared to Spitzer rates and used in subsequent demographic statistics, please provide an explicit decision rule for the visual-inspection step (e.g., independent inspection by two authors, or a blind test) and quantify how the detection rate changes under alternative objective thresholds. A similar concern applies to the 'rough detection threshold' for C2H2 and HCN based on log(L) ~ −5.1 L_sun, which is not tied to a noise or model-significance estimate.
minor comments (5)
- [Equation (1) and Section 3.3.1] The L2 loss function omits flux uncertainties, and the 5% threshold on the L2 norm is described as 'consistent to within roughly 2σ' without a derivation; please clarify that this is not a formal goodness-of-fit or detection significance and state the number of slab models used per source for the medians reported in Tables 5–7.
- [Section 5.1 and Figure 13] The text referencing 'Equation 1' for the linear regressions in Figure 13 should refer to Equation (2), and the earlier cross-reference to 'Section 3.2.2' for the slab-model fits should be Section 3.3.2.
- [Appendix A] The appendix would benefit from a single summary figure or table showing, for a few representative disks, the residuals before and after the single-temperature water subtraction in the 13.4–14.1 µm region; this would make the magnitude of the residual water contamination more transparent than the current qualitative discussion.
- [Tables 5–7] The footnote for Tables 5–7 says 'Since logN and r_slab are degenerate, we do not include them in the analysis,' but the tables do list representative logN and r_slab values; please state explicitly which values are shown (e.g., one member of the degenerate family used for the figures) and how the plotted model was chosen.
- [Figure 9] The ordering of sources by sub-mm dust disk size in Figure 9 is useful, but the two-panel layout with temperature scales repeated on the left and right makes the figure dense; a single aligned panel with shared source labels would improve readability.
Circularity Check
Optical-thinness claim is partly supported by a model-internal L-M correlation; independent isotopologue and pedestal checks reduce the circularity, while the water-subtraction caveat is a separate correctness risk.
-
self definitional
[Section 4.1, Figure 13 and the logL-logM fits (unnumbered equations after 'logL(C2H2) = 1.0×logM(C2H2)+4.3')]
"Instead, we find strong statistically significant positive correlations between the model emission line luminosities and emitting masses for all three molecules (see Figure 13; Spearman ρ=0.98,0.99,0.93). ... The relationships suggest that the emitting regions are optically thin, as an increase in emitting mass leads directly to an increase in luminosity."
L_emit and M_emit are both outputs of the same LTE slab fits: M_emit is computed from the fitted column density and emitting area, while L_emit is integrated from the same slab model spectrum. In the optically thin regime the slab model gives L ∝ N_col A_proj f(T) = M f(T), so a fitted slope near unity is a property of the model's scaling rather than an independent empirical test. The paper uses this correlation as evidence for optical thinness and, in turn, for the claim that observations are sensitive to total molecular mass. This is partly a restatement of the model's own degeneracy structure.
full rationale
The central derivation chain is: fit LTE slab models to 12-16 μm spectra; retrieve N_col, T, and emitting area; construct M_emit and L_emit from those same fits; observe a near-unity L-M slope; conclude the organics are optically thin and that the data constrain total molecular mass. The near-unity slope is partly built into the slab scaling, since at fixed T an optically thin LTE slab has L ∝ M. Thus the L-M correlation is not an independent falsification of optical thickness. However, the paper provides separate, data-driven evidence: the 13C12CH2 non-detections in most disks exclude the high-column, optically thick solutions, and the optically thick pedestal models overpredict P/R-branch fluxes in the compact disks. These checks break the would-be circularity for the main conclusion. The remaining major caveat is correctly acknowledged in the paper itself: the single-temperature LTE water model is subtracted before fitting the organics, and Appendix A states that residual water includes non-LTE and multi-temperature signatures; Section 3.3.5 further notes CO2 may depend on the number of H2O temperature components. That is a systematic-uncertainty issue rather than a circularity. Detection-rate comparisons with Spitzer and the temperature ordering (C2H2/HCN hotter than CO2) are direct fit outputs, not inputs renamed as predictions. Self-citations to the JDISCS pipeline, Banzatti et al. (2025), and related papers are normal method/provenance citations, not load-bearing circular justifications. Overall, one partial circular step (the L-M evidence) is present, but independent constraints prevent the central claim from reducing entirely to its own model. Score 4 reflects this partial circularity with substantial independent content.
Assumptions & free parameters
free parameters (5)
- Slab temperature per molecule (C2H2, HCN, CO2, H2O) =
C2H2 median 920+70-130 K; HCN 820+70-130 K; CO2 600+200-160 K; H2O median 710 K
- Column density per molecule per source =
log N roughly 14-20 cm^-2 depending on molecule and source
- Slab emitting radius per molecule per source =
roughly 0.2-2.5 au across the sample
- Detection threshold for organic molecules =
log L = -5.1 Lsun and P/C < 0.03
- L2-norm threshold defining the family of acceptable fits =
5% above the minimum L2-norm
assumptions (4)
- domain assumption LTE slab model for molecular emission
- ad hoc to paper Single-temperature water subtraction does not bias organic fits
- domain assumption MIR lines originate in the inner few au and ALMA substructures trace the outer disk
- domain assumption Stellar and accretion properties from Manara et al. (2023) are accurate
Cite this review
Pith. "Pith review of The JDISC Survey: Linking the Physics and Chemistry of Inner and Outer Protoplanetary Disk Zones." pith.science (2026). https://pith.science/paper/6ZI4UE4J
@misc{pith2026250507562,
  author       = {Pith},
  title        = {Pith review of: The JDISC Survey: Linking the Physics and Chemistry of Inner and Outer Protoplanetary Disk Zones},
  year         = {2026},
  howpublished = {\url{https://pith.science/paper/6ZI4UE4J}},
  note         = {Machine review of arXiv:2505.07562}
}
abstract
Mid-infrared spectroscopy of protoplanetary disks provides a chemical inventory of gas within a few au, where planets are readily detected around older stars. With the JWST Disk Infrared Spectral Chemistry Survey (JDISCS), we explore demographic trends among 31 disks observed with MIRI (MRS) and with previous ALMA millimeter continuum imaging at high angular resolution (5-10 au). With these S/N $\sim$200-450 spectra, we report emission from H$_2$O, OH, CO, C$_2$H$_2$, HCN, CO$_2$, [Ne II], [Ne III], and [Ar II]. Emission from H$_2$O, OH and CO is nearly ubiquitous for low-mass stars, and detection rates of all molecules are higher than for similar disks observed with Spitzer-IRS. Slab model fits to the molecular emission lines demonstrate that emission from C$_2$H$_2$, HCN, and possibly CO$_2$ is optically thin; thus since column densities and emitting radii are degenerate, observations are actually sensitive to the total molecular mass. C$_2$H$_2$ and HCN emission also typically originate in a hotter region ($920^{+70}_{-130}$, $820^{+70}_{-130}$ K, respectively) than CO$_2$ ($600^{+200}_{-160}$ K). The HCN to cold H$_2$O luminosity ratios are generally smaller in smooth disks, consistent with more efficient water delivery via icy pebbles in the absence of large dust substructures. The molecular emission line luminosities are also correlated with mass accretion rates and infrared spectral indices, similar to trends reported from Spitzer-IRS surveys. This work demonstrates the power of combining multi-wavelength observations to explore inner disk chemistry as a function of outer disk and stellar properties, which will continue to grow as the sample of observed Class II systems expands in the coming JWST observation cycles.
Figures


Figures from the paper (16 more)






Forward citations
Cited by 9 Pith papers
-
JWST/MIRI Reveals the Evolution from Molecular to Atomic Disk Winds
Across 72 protoplanetary disks, JWST shows atomic jets and molecular winds dominate at high accretion rates and give way to predominantly atomic winds as accretion declines.
-
Cosmic cascades: How disk substructure regulates the flow of water to inner planetary systems
Disks with wider inner dust gaps show weaker cold-water emission, implying gaps trap icy pebbles and reduce water delivery to inner planets, matching population synthesis models.
-
JWST Edge-on Disk Ice (JEDIce): Vibrationally hot, rotationally cold H$_2$ in the outer disk of Oph 163131 non-thermally excited by UV and cosmic rays
Outer-disk H2 in Oph 163131 is v-hot and J-cold from combined UV and cosmic-ray excitation plus collisions, implying an effective CR ionization rate of order 10^{-15} s^{-1}.
-
A Chemical Inventory of the Disk around the Class 0 Protostar L1527 IRS with ALMA
A comprehensive ALMA-based chemical inventory of the Class 0 protostar L1527 IRS finds 39 molecular species and a carbon-rich to oxygen-rich transition from envelope to disk.
-
JWST/MIRI Detection of Molecular H$_2$ Winds from an Edge-on Class II Source HV Tau C
The edge-on Class II disk HV Tau C hosts a spatially extended, wide-angled molecular hydrogen wind with warm (~600 K) and hot (~2000 K) components and a mass-loss rate near 1e-8 solar masses per year.
-
Planetesimal Formation Across the Stellar Mass Spectrum and its Influence on Exoplanet-Inherited Volatile Budgets
Discs around 0.1 M⊙ M-dwarfs form all their planetesimals within the 26Al half-life, so the resulting planetesimals—and likely rocky planets—are dehydrated and volatile-poor.
-
The Impact of External Radiation on the Inner Disk Chemistry of Planet Formation
External UV radiation up to 10^4 G0 barely changes the inner-disk chemistry of a typical planet-forming disk, but at 10^6 G0 the disk warms, snowlines move inward, and the midplane chemistry resets to atoms and simple...
-
JWST Observations of Young protoStars (JOYS): overview of program and early results
JWST MIRI-MRS maps of 23 protostars reveal nested jets, cool hot-core molecular emission, comparable ice abundances across stellar masses, a second HDO ice detection near 0.4%, and an O2 ice upper limit near 20% of water.
-
On Linking Planet Formation Models, Protoplanetary Disk Properties, and Mature Gas Giant Exoplanet Atmospheres
A workshop synthesis concludes that linking gas giant exoplanet atmospheres to formation histories requires multiple elemental abundance tracers, not a single C/O ratio, and identifies the most pressing open questions.
Reference graph
Works this paper leans on
-
[1]
´Ad´ amkovics, M., Glassgold, A. E., & Najita, J. R. 2014, ApJ, 786, 135, doi: 10.1088/0004-637X/786/2/135 ´Ad´ amkovics, M., Najita, J. R., & Glassgold, A. E. 2016, ApJ, 817, 82, doi: 10.3847/0004-637X/817/1/82 Ag´ undez, M., Cernicharo, J., & Goicoechea, J. R. 2008, A&A, 483, 831, doi: 10.1051/0004-6361:20077927 Alcal´ a, J. M., Manara, C. F., France, K...
-
[2]
Anderson, D. E., Blake, G. A., Cleeves, L. I., et al. 2021, ApJ, 909, 55, doi: 10.3847/1538-4357/abd9c1
-
[3]
Andrews, S. M., Huang, J., P´ erez, L. M., et al. 2018, ApJL, 869, L41, doi: 10.3847/2041-8213/aaf741
-
[4]
M., Elder, W., Zhang, S., et al
Andrews, S. M., Elder, W., Zhang, S., et al. 2021, ApJ, 916, 51, doi: 10.3847/1538-4357/ac00b9
-
[5]
Ansdell, M., Williams, J. P., van der Marel, N., et al. 2016, ApJ, 828, 46, doi: 10.3847/0004-637X/828/1/46
-
[6]
M., Kamp, I., Henning, T., et al
Arabhavi, A. M., Kamp, I., Henning, T., et al. 2024, Science, 384, 1086, doi: 10.1126/science.adi8147 39 Figure A2.Correlations between best-fit parameters retrieved from single temperature slab model fits to H 2O emission lines between 12-17.5µm. Although statistically significant, the correlation between emission line luminosities and emitting masses (l...
-
[7]
Arulanantham, N., McClure, M. K., Pontoppidan, K., et al. 2024, ApJL, 965, L13, doi: 10.3847/2041-8213/ad35c9 Astropy Collaboration, Robitaille, T. P., Tollerud, E. J., et al. 2013, A&A, 558, A33, doi: 10.1051/0004-6361/201322068 Astropy Collaboration, Price-Whelan, A. M., Sip˝ ocz, B. M., et al. 2018, AJ, 156, 123, doi: 10.3847/1538-3881/aabc4f Astropy C...
-
[8]
2023, in Astronomical Society of the Pacific Conference Series, Vol
Bae, J., Isella, A., Zhu, Z., et al. 2023, in Astronomical Society of the Pacific Conference Series, Vol. 534, Protostars and Planets VII, ed. S. Inutsuka, Y. Aikawa, T. Muto, K. Tomida, & M. Tamura, 423, doi: 10.48550/arXiv.2210.13314
Show all 145 references
-
[9]
S., Pascucci, I., Gorti, U., et al
Bajaj, N. S., Pascucci, I., Gorti, U., et al. 2024, AJ, 167, 127, doi: 10.3847/1538-3881/ad22e1
2024 doi
-
[10]
2019, ApJ, 870, 76, doi: 10.3847/1538-4357/aaf1aa
Banzatti, A., Pascucci, I., Edwards, S., et al. 2019, ApJ, 870, 76, doi: 10.3847/1538-4357/aaf1aa
2019 doi
-
[11]
M., Salyk, C., et al
Banzatti, A., Pontoppidan, K. M., Salyk, C., et al. 2017, ApJ, 834, 152, doi: 10.3847/1538-4357/834/2/152
2017 doi
-
[12]
R., Bruderer, S., et al
Banzatti, A., Meyer, M. R., Bruderer, S., et al. 2012, ApJ, 745, 90, doi: 10.1088/0004-637X/745/1/90
2012 doi
-
[13]
D., et al
Banzatti, A., Pascucci, I., Bosman, A. D., et al. 2020, ApJ, 903, 124, doi: 10.3847/1538-4357/abbc1a
2020 doi
-
[14]
M., Brittain, S., et al
Banzatti, A., Abernathy, K. M., Brittain, S., et al. 2022, AJ, 163, 174, doi: 10.3847/1538-3881/ac52f0
2022 doi
-
[15]
M., Carr, J
Banzatti, A., Pontoppidan, K. M., Carr, J. S., et al. 2023a, ApJL, 957, L22, doi: 10.3847/2041-8213/acf5ec
-
[16]
M., P´ ere Ch´ avez, J., et al
Banzatti, A., Pontoppidan, K. M., P´ ere Ch´ avez, J., et al. 2023b, AJ, 165, 72, doi: 10.3847/1538-3881/aca80b
-
[17]
M., et al
Banzatti, A., Salyk, C., Pontoppidan, K. M., et al. 2025, AJ, 169, 165, doi: 10.3847/1538-3881/ada962
2025 doi
-
[18]
A., Clarke, C
Booth, R. A., Clarke, C. J., Madhusudhan, N., & Ilee, J. D. 2017, MNRAS, 469, 3994, doi: 10.1093/mnras/stx1103
2017 doi
-
[19]
A., & Ilee, J
Booth, R. A., & Ilee, J. D. 2019, MNRAS, 487, 3998, doi: 10.1093/mnras/stz1488
2019 doi
-
[20]
D., Bergin, E
Bosman, A. D., Bergin, E. A., Calahan, J., & Duval, S. E. 2022, ApJL, 930, L26, doi: 10.3847/2041-8213/ac66ce
2022 doi
-
[21]
M., Pontoppidan, K
Brown, J. M., Pontoppidan, K. M., van Dishoeck, E. F., et al. 2013, ApJ, 770, 94, doi: 10.1088/0004-637X/770/2/94
2013 doi
-
[22]
M., Blake, G
Brown, J. M., Blake, G. A., Dullemond, C. P., et al. 2007, ApJL, 664, L107, doi: 10.1086/520808
2007 doi
-
[23]
2006, Science, 314, 1711, doi: 10.1126/science.1135840
Brownlee, D., Tsou, P., Al´ eon, J., et al. 2006, Science, 314, 1711, doi: 10.1126/science.1135840
2006 doi
-
[24]
S., & Najita, J
Carr, J. S., & Najita, J. R. 2008, Science, 319, 1504, doi: 10.1126/science.1153807 —. 2011, ApJ, 733, 102, doi: 10.1088/0004-637X/733/2/102 —. 2014, ApJ, 788, 66, doi: 10.1088/0004-637X/788/1/66
2008 doi
-
[25]
2002, A&A, 391, 267, doi: 10.1051/0004-6361:20020791
Sakamoto, D. 2002, A&A, 391, 267, doi: 10.1051/0004-6361:20020791
2002 doi
-
[26]
2024, A&A, 685, A75, doi: 10.1051/0004-6361/202346662
Chown, R., Sidhu, A., Peeters, E., et al. 2024, A&A, 685, A75, doi: 10.1051/0004-6361/202346662
2024 doi
-
[27]
A., Schreiber, M
Cieza, L. A., Schreiber, M. R., Romero, G. A., et al. 2010, ApJ, 712, 925, doi: 10.1088/0004-637X/712/2/925
2010 doi
-
[28]
J., Bergin, E., Salyk, C., et al
Colmenares, M. J., Bergin, E., Salyk, C., et al. 2024, arXiv e-prints, arXiv:2410.18187. https://arxiv.org/abs/2410.18187
2024 arXiv
-
[29]
2024, ApJ, 962, 90, doi: 10.3847/1538-4357/ad11ed
Plunkett, A. 2024, ApJ, 962, 90, doi: 10.3847/1538-4357/ad11ed
2024 doi
-
[30]
F., Finociety, B., Cristofari, P
Donati, J. F., Finociety, B., Cristofari, P. I., et al. 2024, MNRAS, 530, 264, doi: 10.1093/mnras/stae675 Dra˙ zkowska, J., & Alibert, Y. 2017, A&A, 608, A92, doi: 10.1051/0004-6361/201731491
2024 doi
-
[31]
P., Birnstiel, T., Huang, J., et al
Dullemond, C. P., Birnstiel, T., Huang, J., et al. 2018, ApJL, 869, L46, doi: 10.3847/2041-8213/aaf742 40
2018 doi
-
[32]
2024, ApJ, 977, 21, doi: 10.3847/1538-4357/ad891d
Easterwood, W., Kalyaan, A., & Banzatti, A. 2024, ApJ, 977, 21, doi: 10.3847/1538-4357/ad891d
2024 doi
-
[33]
A., Hillenbrand, L
Eisner, J. A., Hillenbrand, L. A., White, R. J., Akeson, R. L., & Sargent, A. I. 2005, ApJ, 623, 952, doi: 10.1086/428828
2005 doi
-
[34]
2013, ApJ, 762, 62, doi: 10.1088/0004-637X/762/1/62
Espaillat, C., Ingleby, L., Furlan, E., et al. 2013, ApJ, 762, 62, doi: 10.1088/0004-637X/762/1/62
2013 doi
-
[35]
C., Thanathibodee, T., Pittman, C
Espaillat, C. C., Thanathibodee, T., Pittman, C. V., et al. 2023, ApJL, 958, L4, doi: 10.3847/2041-8213/ad023d
2023 doi
-
[36]
H., & Carr, J
Evans, Neal J., I., Lacy, J. H., & Carr, J. S. 1991, ApJ, 383, 674, doi: 10.1086/170824
1991 doi
-
[37]
R., Oudmaijer, R
Fairlamb, J. R., Oudmaijer, R. D., Mendigut´ ıa, I., Ilee, J. D., & van den Ancker, M. E. 2015, MNRAS, 453, 976, doi: 10.1093/mnras/stv1576
2015 doi
-
[38]
2018, ApJ, 868, 28, doi: 10.3847/1538-4357/aae780
Fang, M., Pascucci, I., Edwards, S., et al. 2018, ApJ, 868, 28, doi: 10.3847/1538-4357/aae780
2018 doi
-
[39]
F., et al
Fedele, D., Bruderer, S., van Dishoeck, E. F., et al. 2012, A&A, 544, L9, doi: 10.1051/0004-6361/201219615
2012 doi
-
[40]
W., Lang, D., & Goodman, J
Foreman-Mackey, D., Hogg, D. W., Lang, D., & Goodman, J. 2013, PASP, 125, 306, doi: 10.1086/670067
2013 doi
-
[41]
2020, ApJ, 892, 111, doi: 10.3847/1538-4357/ab7b63
Francis, L., & van der Marel, N. 2020, ApJ, 892, 111, doi: 10.3847/1538-4357/ab7b63
2020 doi
-
[42]
M., et al
Frasca, A., Biazzo, K., Alcal´ a, J. M., et al. 2017, A&A, 602, A33, doi: 10.1051/0004-6361/201630108
2017 doi
-
[43]
M., McClure, M
Furlan, E., Watson, D. M., McClure, M. K., et al. 2009, ApJ, 703, 1964, doi: 10.1088/0004-637X/703/2/1964 Gaia Collaboration, Prusti, T., de Bruijne, J. H. J., et al. 2016, A&A, 595, A1, doi: 10.1051/0004-6361/201629272 Gaia Collaboration, Brown, A. G. A., Vallenari, A., et al...
2009 doi
- [44]
-
[45]
F., Grant, S
Gasman, D., van Dishoeck, E. F., Grant, S. L., et al. 2023, A&A, 679, A117, doi: 10.1051/0004-6361/202347005
2023 doi
-
[46]
F., et al
Gasman, D., Temmink, M., van Dishoeck, E. F., et al. 2025, arXiv e-prints, arXiv:2501.04587. https://arxiv.org/abs/2501.04587
2025 arXiv
-
[47]
Gontcharov, G. A. 2006, Astronomy Letters, 32, 759, doi: 10.1134/S1063773706110065
2006 doi
-
[48]
L., van Dishoeck, E
Grant, S. L., van Dishoeck, E. F., Tabone, B., et al. 2023, ApJL, 947, L6, doi: 10.3847/2041-8213/acc44b
2023 doi
- [49]
-
[50]
1972, GeoCoA, 36, 597, doi: 10.1016/0016-7037(72)90078-6
Grossman, L. 1972, GeoCoA, 36, 597, doi: 10.1016/0016-7037(72)90078-6
1972 doi
-
[51]
1981, Progress of Theoretical Physics Supplement, 70, 35, doi: 10.1143/PTPS.70.35
Hayashi, C. 1981, Progress of Theoretical Physics Supplement, 70, 35, doi: 10.1143/PTPS.70.35
1981 doi
-
[52]
2020, ApJ, 895, 126, doi: 10.3847/1538-4357/ab70ba
Hendler, N., Pascucci, I., Pinilla, P., et al. 2020, ApJ, 895, 126, doi: 10.3847/1538-4357/ab70ba
2020 doi
-
[53]
2013, Chemical Reviews, 113, 9016, doi: 10.1021/cr400128p
Henning, T., & Semenov, D. 2013, Chemical Reviews, 113, 9016, doi: 10.1021/cr400128p
2013 doi
-
[54]
2024, PASP, 136, 054302, doi: 10.1088/1538-3873/ad3455
Henning, T., Kamp, I., Samland, M., et al. 2024, PASP, 136, 054302, doi: 10.1088/1538-3873/ad3455
2024 doi
-
[55]
J., & Hillenbrand, L
Herczeg, G. J., & Hillenbrand, L. A. 2014, ApJ, 786, 97, doi: 10.1088/0004-637X/786/2/97
2014 doi
-
[56]
J., Walter, F
Herczeg, G. J., Walter, F. M., Linsky, J. L., et al. 2005, AJ, 129, 2777, doi: 10.1086/430075
2005 doi
-
[57]
2009, ApJ, 703, 1203, doi: 10.1088/0004-637X/703/2/1203
Hollenbach, D., & Gorti, U. 2009, ApJ, 703, 1203, doi: 10.1088/0004-637X/703/2/1203
2009 doi
-
[58]
R., Roellig, T
Houck, J. R., Roellig, T. L., van Cleve, J., et al. 2004, ApJS, 154, 18, doi: 10.1086/423134
2004 doi
-
[59]
2025, MNRAS, 537, 691, doi: 10.1093/mnras/staf057
Houge, A., Krijt, S., Banzatti, A., et al. 2025, MNRAS, 537, 691, doi: 10.1093/mnras/staf057
2025 doi
-
[60]
C., et al
Hourihane, A., Fran¸ cois, P., Worley, C. C., et al. 2023a, A&A, 676, A129, doi: 10.1051/0004-6361/202345910 —. 2023b, A&A, 676, A129, doi: 10.1051/0004-6361/202345910
-
[61]
M., Dullemond, C
Huang, J., Andrews, S. M., Dullemond, C. P., et al. 2018a, ApJL, 869, L42, doi: 10.3847/2041-8213/aaf740
-
[62]
M., P´ erez, L
Huang, J., Andrews, S. M., P´ erez, L. M., et al. 2018b, ApJL, 869, L43, doi: 10.3847/2041-8213/aaf7a0
-
[63]
M., Dullemond, C
Huang, J., Andrews, S. M., Dullemond, C. P., et al. 2020, ApJ, 891, 48, doi: 10.3847/1538-4357/ab711e
2020 doi
-
[64]
G., Banzatti, A., Johnson, M
Jellison, E. G., Banzatti, A., Johnson, M. B., & Bruderer, S. 2024, AJ, 168, 99, doi: 10.3847/1538-3881/ad6142
2024 doi
-
[65]
2024, spexod/iSLAT: Second release, v4.03, Zenodo, doi: 10.5281/zenodo.12167853
Johnson, M., Banzatti, A., Fuller, J., & Jellison, E. 2024, spexod/iSLAT: Second release, v4.03, Zenodo, doi: 10.5281/zenodo.12167853
2024 doi
-
[66]
C., ´Alvarez-M´ arquez, J., Sloan, G
Jones, O. C., ´Alvarez-M´ arquez, J., Sloan, G. C., et al. 2023, MNRAS, 523, 2519, doi: 10.1093/mnras/stad1609 J¨ onsson, H., Holtzman, J. A., Allende Prieto, C., et al. 2020, AJ, 160, 120, doi: 10.3847/1538-3881/aba592
2023 doi
-
[67]
Kaeufer, T., Min, M., Woitke, P., Kamp, I., & Arabhavi, A. M. 2024a, A&A, 687, A209, doi: 10.1051/0004-6361/202449936
-
[68]
2024b, arXiv e-prints, arXiv:2408.06077
Kaeufer, T., Woitke, P., Kamp, I., Kanwar, J., & Min, M. 2024b, arXiv e-prints, arXiv:2408.06077. https://arxiv.org/abs/2408.06077
-
[69]
2021, ApJ, 921, 84, doi: 10.3847/1538-4357/ac1e96
Banzatti, A. 2021, ApJ, 921, 84, doi: 10.3847/1538-4357/ac1e96
2021 doi
-
[70]
2023, ApJ, 954, 66, doi: 10.3847/1538-4357/ace535
Kalyaan, A., Pinilla, P., Krijt, S., et al. 2023, ApJ, 954, 66, doi: 10.3847/1538-4357/ace535
2023 doi
-
[71]
2024a, A&A, 681, A22, doi: 10.1051/0004-6361/202346262 41
Kanwar, J., Kamp, I., Woitke, P., et al. 2024a, A&A, 681, A22, doi: 10.1051/0004-6361/202346262 41
- [72]
-
[73]
2019, AJ, 157, 196, doi: 10.3847/1538-3881/ab13b1
Kounkel, M., Covey, K., Moe, M., et al. 2019, AJ, 157, 196, doi: 10.3847/1538-3881/ab13b1
2019 doi
-
[74]
E., Tielens, A
Kress, M. E., Tielens, A. G. G. M., & Frenklach, M. 2010, Advances in Space Research, 46, 44, doi: 10.1016/j.asr.2010.02.004
2010 doi
-
[75]
T., P´ erez, L
Kurtovic, N. T., P´ erez, L. M., Benisty, M., et al. 2018, ApJL, 869, L44, doi: 10.3847/2041-8213/aaf746
2018 doi
-
[76]
F., Boogert, A
Lahuis, F., van Dishoeck, E. F., Boogert, A. C. A., et al. 2006, ApJL, 636, L145, doi: 10.1086/500084
2006 doi
-
[77]
2019, A&A, 622, A75, doi: 10.1051/0004-6361/201834157
Liu, Y., Dipierro, G., Ragusa, E., et al. 2019, A&A, 622, A75, doi: 10.1051/0004-6361/201834157
2019 doi
-
[78]
E., Zhang, K., Teague, R., & Bergin, E
Long, D. E., Zhang, K., Teague, R., & Bergin, E. A. 2020, ApJL, 895, L46, doi: 10.3847/2041-8213/ab94a8
2020 doi
-
[79]
J., et al
Long, F., Pinilla, P., Herczeg, G. J., et al. 2018, ApJ, 869, 17, doi: 10.3847/1538-4357/aae8e1
2018 doi
-
[80]
J., Harsono, D., et al
Long, F., Herczeg, G. J., Harsono, D., et al. 2019a, ApJ, 882, 49, doi: 10.3847/1538-4357/ab2d2d —. 2019b, ApJ, 882, 49, doi: 10.3847/1538-4357/ab2d2d
-
[81]
2025, ApJL, 978, L30, doi: 10.3847/2041-8213/ad99d2
Long, F., Pascucci, I., Houge, A., et al. 2025, ApJL, 978, L30, doi: 10.3847/2041-8213/ad99d2
2025 doi
-
[82]
2023, A&A, 677, L7, doi: 10.1051/0004-6361/202347169
Mah, J., Bitsch, B., Pascucci, I., & Henning, T. 2023, A&A, 677, L7, doi: 10.1051/0004-6361/202347169
2023 doi
-
[83]
2024, A&A, 686, L17, doi: 10.1051/0004-6361/202450322
Mah, J., Savvidou, S., & Bitsch, B. 2024, A&A, 686, L17, doi: 10.1051/0004-6361/202450322
2024 doi
- [84]
-
[85]
F., Fedele, D., Herczeg, G
Manara, C. F., Fedele, D., Herczeg, G. J., & Teixeira, P. S. 2016, A&A, 585, A136, doi: 10.1051/0004-6361/201527224
2016 doi
-
[86]
F., Testi, L., Natta, A., et al
Manara, C. F., Testi, L., Natta, A., et al. 2014, A&A, 568, A18, doi: 10.1051/0004-6361/201323318
2014 doi
-
[87]
F., Testi, L., Herczeg, G
Manara, C. F., Testi, L., Herczeg, G. J., et al. 2017, A&A, 604, A127, doi: 10.1051/0004-6361/201630147
2017 doi
-
[88]
F., Frasca, A., Venuti, L., et al
Manara, C. F., Frasca, A., Venuti, L., et al. 2021, A&A, 650, A196, doi: 10.1051/0004-6361/202140639
2021 doi
-
[89]
McClure, M. K. 2019, A&A, 632, A32, doi: 10.1051/0004-6361/201834361
2019 doi
-
[90]
M., Blake, G
Meijerink, R., Pontoppidan, K. M., Blake, G. A., Poelman, D. R., & Dullemond, C. P. 2009, ApJ, 704, 1471, doi: 10.1088/0004-637X/704/2/1471 Mendigut´ ıa, I., Brittain, S., Eiroa, C., et al. 2013, ApJ, 776, 44, doi: 10.1088/0004-637X/776/1/44
2009 doi
-
[91]
Miret-Roig, N., Galli, P. A. B., Olivares, J., et al. 2022, A&A, 667, A163, doi: 10.1051/0004-6361/202244709
2022 doi
-
[92]
S., & Mathieu, R
Najita, J., Carr, J. S., & Mathieu, R. D. 2003, ApJ, 589, 931, doi: 10.1086/374809
2003 doi
-
[93]
R., ´Ad´ amkovics, M., & Glassgold, A
Najita, J. R., ´Ad´ amkovics, M., & Glassgold, A. E. 2011, ApJ, 743, 147, doi: 10.1088/0004-637X/743/2/147
2011 doi
-
[94]
R., Carr, J
Najita, J. R., Carr, J. S., Brittain, S. D., et al. 2021, ApJ, 908, 171, doi: 10.3847/1538-4357/abcfc6
2021 doi
-
[95]
R., Carr, J
Najita, J. R., Carr, J. S., Pontoppidan, K. M., et al. 2013, ApJ, 766, 134, doi: 10.1088/0004-637X/766/2/134
2013 doi
-
[96]
R., Carr, J
Najita, J. R., Carr, J. S., Salyk, C., et al. 2018, ApJ, 862, 122, doi: 10.3847/1538-4357/aaca39
2018 doi
-
[97]
R., Carr, J
Najita, J. R., Carr, J. S., Strom, S. E., et al. 2010, ApJ, 712, 274, doi: 10.1088/0004-637X/712/1/274
2010 doi
-
[98]
R., Doppmann, G
Najita, J. R., Doppmann, G. W., Carr, J. S., Graham, J. R., & Eisner, J. A. 2009, ApJ, 691, 738, doi: 10.1088/0004-637X/691/1/738
2009 doi
-
[99]
2012, ApJ, 745, 119, doi: 10.1088/0004-637X/745/2/119 ¨Oberg, K
Jayawardhana, R. 2012, ApJ, 745, 119, doi: 10.1088/0004-637X/745/2/119 ¨Oberg, K. I., Guzm´ an, V. V., Walsh, C., et al. 2021, ApJS, 257, 1, doi: 10.3847/1538-4365/ac1432
2012 doi
-
[100]
2009, ApJ, 696, 143, doi: 10.1088/0004-637X/696/1/143
Pascucci, I., Apai, D., Luhman, K., et al. 2009, ApJ, 696, 143, doi: 10.1088/0004-637X/696/1/143
2009 doi
-
[101]
S., & Bruderer, S
Pascucci, I., Herczeg, G., Carr, J. S., & Bruderer, S. 2013, ApJ, 779, 178, doi: 10.1088/0004-637X/779/2/178
2013 doi
-
[102]
2014, ApJ, 795, 1, doi: 10.1088/0004-637X/795/1/1
Pascucci, I., Ricci, L., Gorti, U., et al. 2014, ApJ, 795, 1, doi: 10.1088/0004-637X/795/1/1
2014 doi
-
[103]
2007, ApJ, 663, 383, doi: 10.1086/518535
Pascucci, I., Hollenbach, D., Najita, J., et al. 2007, ApJ, 663, 383, doi: 10.1086/518535
2007 doi
-
[104]
J., et al
Pascucci, I., Testi, L., Herczeg, G. J., et al. 2016, ApJ, 831, 125, doi: 10.3847/0004-637X/831/2/125
2016 doi
-
[105]
2020, ApJ, 903, 78, doi: 10.3847/1538-4357/abba3c
Pascucci, I., Banzatti, A., Gorti, U., et al. 2020, ApJ, 903, 78, doi: 10.3847/1538-4357/abba3c
2020 doi
-
[106]
2023, Nature, 620, 516, doi: 10.1038/s41586-023-06317-9
Perotti, G., Christiaens, V., Henning, T., et al. 2023, Nature, 620, 516, doi: 10.1038/s41586-023-06317-9
2023 doi
-
[107]
2012, A&A, 538, A114, doi: 10.1051/0004-6361/201118204
Pinilla, P., Birnstiel, T., Ricci, L., et al. 2012, A&A, 538, A114, doi: 10.1051/0004-6361/201118204
2012 doi
-
[108]
B., Hubickyj, O., Bodenheimer, P., et al
Pollack, J. B., Hubickyj, O., Bodenheimer, P., et al. 1996, Icarus, 124, 62, doi: 10.1006/icar.1996.0190
1996
-
[109]
M., Salyk, C., Banzatti, A., et al
Pontoppidan, K. M., Salyk, C., Banzatti, A., et al. 2019, ApJ, 874, 92, doi: 10.3847/1538-4357/ab05d8
2019 doi
-
[110]
M., Salyk, C., Bergin, E
Pontoppidan, K. M., Salyk, C., Bergin, E. A., et al. 2014, in Protostars and Planets VI, ed. H. Beuther, R. S
2014
-
[111]
Klessen, C. P. Dullemond, & T. Henning, 363–385, doi: 10.2458/azu uapress 9780816531240-ch016
-
[112]
M., Salyk, C., Blake, G
Pontoppidan, K. M., Salyk, C., Blake, G. A., et al. 2010, ApJ, 720, 887, doi: 10.1088/0004-637X/720/1/887
2010 doi
-
[113]
M., Salyk, C., Banzatti, A., et al
Pontoppidan, K. M., Salyk, C., Banzatti, A., et al. 2024, ApJ, 963, 158, doi: 10.3847/1538-4357/ad20f0 Ram´ ırez-Tannus, M. C., Bik, A., Cuijpers, L., et al. 2023, ApJL, 958, L30, doi: 10.3847/2041-8213/ad03f8 42 Ribas, ´A., Clarke, C. J., & Zagaria, F. 2024, MNRAS, 532, 1752,...
2024 doi
-
[114]
H., Wright, G
Rieke, G. H., Wright, G. S., B¨ oker, T., et al. 2015, PASP, 127, 584, doi: 10.1086/682252
2015 doi
-
[115]
E., Banzatti, A., ¨Oberg, K
Romero-Mirza, C. E., Banzatti, A., ¨Oberg, K. I., et al. 2024a, ApJ, 975, 78, doi: 10.3847/1538-4357/ad769e
-
[116]
E., ¨Oberg, K
Romero-Mirza, C. E., ¨Oberg, K. I., Banzatti, A., et al. 2024b, ApJ, 964, 36, doi: 10.3847/1538-4357/ad20e9
-
[117]
2022, csalyk/spectools ir: First release, v1.0.0, Zenodo, doi: 10.5281/zenodo.5818682
Salyk, C. 2022, csalyk/spectools ir: First release, v1.0.0, Zenodo, doi: 10.5281/zenodo.5818682
2022 doi
-
[118]
A., Boogert, A
Salyk, C., Blake, G. A., Boogert, A. C. A., & Brown, J. M. 2009, ApJ, 699, 330, doi: 10.1088/0004-637X/699/1/330 —. 2011a, ApJ, 743, 112, doi: 10.1088/0004-637X/743/2/112
2009 doi
-
[119]
J., Brown, J
Salyk, C., Herczeg, G. J., Brown, J. M., et al. 2013, ApJ, 769, 21, doi: 10.1088/0004-637X/769/1/21
2013 doi
-
[120]
H., Richter, M
Salyk, C., Lacy, J. H., Richter, M. J., et al. 2015, ApJL, 810, L24, doi: 10.1088/2041-8205/810/2/L24
2015 doi
-
[121]
M., Blake, G
Salyk, C., Pontoppidan, K. M., Blake, G. A., Najita, J. R., & Carr, J. S. 2011b, ApJ, 731, 130, doi: 10.1088/0004-637X/731/2/130
-
[122]
M., Banzatti, A., et al
Salyk, C., Pontoppidan, K. M., Banzatti, A., et al. 2025, AJ, 169, 184, doi: 10.3847/1538-3881/adb397
2025 doi
-
[123]
R., Henning, T., Christiaens, V., et al
Schwarz, K. R., Henning, T., Christiaens, V., et al. 2024, ApJ, 962, 8, doi: 10.3847/1538-4357/ad1393
2024 doi
-
[124]
D., Vlasblom, M., & van Dishoeck, E
Sellek, A. D., Vlasblom, M., & van Dishoeck, E. F. 2025, A&A, 694, A79, doi: 10.1051/0004-6361/202451137
2025 doi
-
[125]
D., Bajaj, N
Sellek, A. D., Bajaj, N. S., Pascucci, I., et al. 2024, AJ, 167, 223, doi: 10.3847/1538-3881/ad34ae
2024 doi
-
[126]
C., Lagadec, E., Zijlstra, A
Sloan, G. C., Lagadec, E., Zijlstra, A. A., et al. 2014, ApJ, 791, 28, doi: 10.1088/0004-637X/791/1/28
2014 doi
-
[127]
Ray, T. P. 2022, A&A, 668, A94, doi: 10.1051/0004-6361/202244315
2022 doi
-
[128]
A., Greene, T
Sullivan, T., Wilking, B. A., Greene, T. P., et al. 2019, AJ, 158, 41, doi: 10.3847/1538-3881/ab24c0 Szul´ agyi, J., Pascucci, I.,´Abrah´ am, P., et al. 2012, ApJ, 759, 47, doi: 10.1088/0004-637X/759/1/47
2019 doi
- [129]
-
[130]
F., et al
Tabone, B., Bettoni, G., van Dishoeck, E. F., et al. 2023, Nature Astronomy, 7, 805, doi: 10.1038/s41550-023-01965-3
2023 doi
-
[131]
F., Gasman, D., et al
Temmink, M., van Dishoeck, E. F., Gasman, D., et al. 2024, A&A, 689, A330, doi: 10.1051/0004-6361/202450355
2024 doi
-
[132]
F., et al
Testi, L., Natta, A., Manara, C. F., et al. 2022, A&A, 663, A98, doi: 10.1051/0004-6361/202141380 van der Marel, N., Williams, J. P., Ansdell, M., et al. 2018, ApJ, 854, 177, doi: 10.3847/1538-4357/aaaa6b
2022 doi
-
[133]
D., & van Dishoeck, E
Visser, R., Doty, S. D., & van Dishoeck, E. F. 2011, A&A, 534, A132, doi: 10.1051/0004-6361/201117249
2011 doi
-
[134]
2024, A&A, 682, A91, doi: 10.1051/0004-6361/202348224
Bruderer, S. 2024, A&A, 682, A91, doi: 10.1051/0004-6361/202348224
2024 doi
-
[135]
I., & Basu, S
Vorobyov, E. I., & Basu, S. 2010, ApJ, 719, 1896, doi: 10.1088/0004-637X/719/2/1896
2010 doi
-
[136]
2015, A&A, 582, A88, doi: 10.1051/0004-6361/201526751
Walsh, C., Nomura, H., & van Dishoeck, E. 2015, A&A, 582, A88, doi: 10.1051/0004-6361/201526751
2015 doi
-
[137]
W., Glasse, A., et al
Wells, M., Pel, J. W., Glasse, A., et al. 2015, PASP, 127, 646, doi: 10.1086/682281
2015 doi
-
[138]
T., Pascucci, I., Gorti, U., et al
Whelan, E. T., Pascucci, I., Gorti, U., et al. 2021, ApJ, 913, 43, doi: 10.3847/1538-4357/abf55e
2021 doi
-
[139]
J., & Hillenbrand, L
White, R. J., & Hillenbrand, L. A. 2004, ApJ, 616, 998, doi: 10.1086/425115
2004 doi
-
[140]
F., et al
Woitke, P., Min, M., Thi, W. F., et al. 2018, A&A, 618, A57, doi: 10.1051/0004-6361/201731460
2018 doi
-
[141]
H., Law, D
Worthen, K., Chen, C. H., Law, D. R., et al. 2024, ApJ, 964, 168, doi: 10.3847/1538-4357/ad2354
2024 doi
-
[142]
D., Males, J
Wu, Y.-L., Sheehan, P. D., Males, J. R., et al. 2017, ApJ, 836, 223, doi: 10.3847/1538-4357/aa5b96
2017 doi
-
[143]
2023, ApJL, 959, L25, doi: 10.3847/2041-8213/ad0ed9
Xie, C., Pascucci, I., Long, F., et al. 2023, ApJL, 959, L25, doi: 10.3847/2041-8213/ad0ed9
2023 doi
-
[144]
M., Salyk, C., & Blake, G
Zhang, K., Pontoppidan, K. M., Salyk, C., & Blake, G. A. 2013, ApJ, 766, 82, doi: 10.1088/0004-637X/766/2/82
2013 doi
-
[145]
2009, ApJ, 694, 1045, doi: 10.1088/0004-637X/694/2/1045
Zhu, Z., Hartmann, L., & Gammie, C. 2009, ApJ, 694, 1045, doi: 10.1088/0004-637X/694/2/1045
2009 doi
Reviewed August 15, 2026 · model on record in the stance chip above.
Discussion (0). Continue with ORCID to comment.