REVIEW 3 major objections 5 minor 62 references
Ultra-deep JWST photometry of the Large Magellanic Cloud's outskirts yields a low-mass stellar mass function with slope alpha = -1.49 (shallower than Salpeter) and a total binary fraction of 0.34.
Reviewed by Pith at T0; open to challenge. T0 means a machine referee read the full paper against a public rubric. the ladder, T0–T4 →
T0 review · deepseek-v4-flash
2026-08-01 12:56 UTC pith:74IR3PJV
load-bearing objection A solid, standard-method JWST measurement of the LMC-field binary fraction and MF, with a small internal inconsistency in the binary conversion and an overclaim of depth. the 3 major comments →
The Large Magellanic Cloud through the lens of the James Webb Space Telescope: Binaries and the mass function in the galaxy's outskirts
The pith
A machine-rendered reading of the paper's core claim, the machinery that carries it, and where it could break.
Core claim
On its own terms, the paper's central discovery is that the present-day mass function of LMC field stars, measured for the first time down to 0.17 solar masses, is not Salpeter-like: a single power-law fit to the range 0.17-0.82 solar masses gives alpha = -1.49 ± 0.16, statistically shallower than -2.35. When forced to have a break at 0.5 solar masses, the low-mass side has slope -1.15 ± 0.11 (matching the Kroupa value of -1.3) while the high-mass side is steeper at -2.76 ± 0.15. The paper also finds that unresolved binaries with mass ratios above 0.6 make up 15% of upper-main-sequence sources, which translates to a total binary fraction of 34% under a flat mass-ratio distribution; a separat
What carries the argument
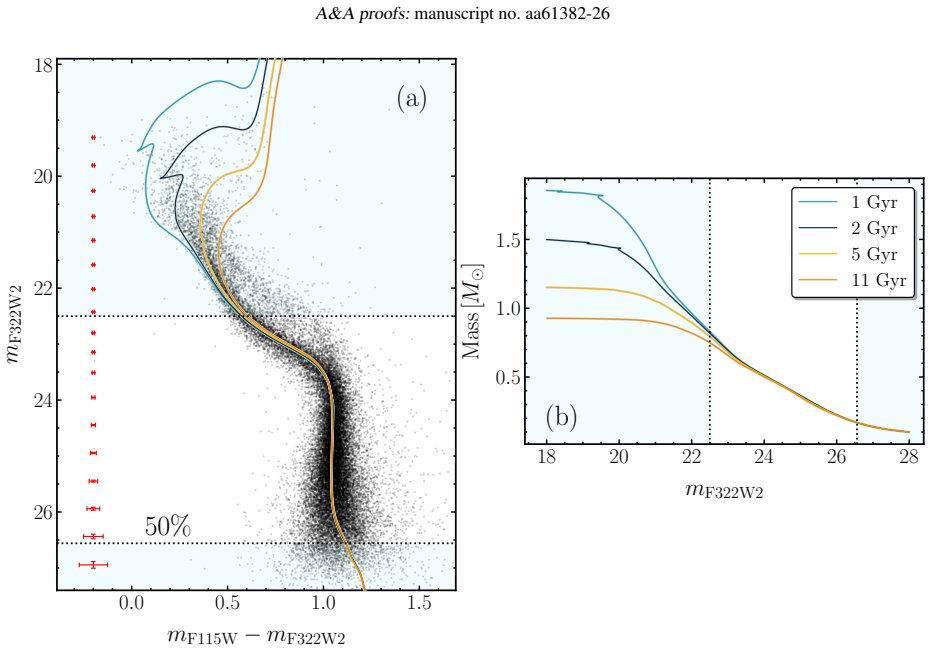
The argument rests on a color-magnitude-diagram census of unresolved binaries. The paper defines a region of the m_F322W2 versus m_F115W-m_F322W2 diagram containing upper-main-sequence stars and counts sources redward of the q=0.6 binary fiducial; after subtracting foreground contamination and completeness losses, that count gives f(q>0.6). A flat mass-ratio distribution converts this to the total binary fraction, which is then used to correct the luminosity function for the light of unresolved companions before converting to masses with a 2-Gyr isochrone. Artificial-star tests supply the completeness and bin-contamination corrections that propagate into the final MF slope.
Load-bearing premise
The load-bearing premise is that unresolved binaries have a flat distribution of mass ratios from 0 to 1 that does not depend on primary mass; if the true distribution is not flat, the reported total binary fraction (0.34) and the binary correction applied before measuring the mass-function slope would both change.
What would settle it
Measure the binary mass-ratio distribution directly in the same LMC field — for example, with multi-epoch radial velocities of upper-main-sequence stars or with higher-resolution imaging that resolves pairs down to smaller separations. If the observed q-distribution deviates from flat (for instance, a deficit or surplus of q<0.6 systems), recomputing f_TOT and the binary-corrected luminosity function with that empirical distribution would either confirm or overturn alpha = -1.49.
If this is right
- If the measured slope stands, the low-mass IMF in the LMC field is not universal in the Salpeter sense; over 0.17-0.82 solar masses it is consistent with a Kroupa-like form.
- A total binary fraction of 0.34 in the LMC outskirts, matching the SMC and Milky Way field, indicates that binary formation efficiency is similar across low-density environments.
- The resolved wide-binary fraction of 1% or less (q>0.6, separations up to roughly 7,700 AU) shows that very wide binaries are rare in this field, as in other low-density systems.
- Because the MF probes to 0.17 solar masses, JWST observations provide a way to test IMF universality below the 0.4-solar-mass limit of earlier HST-era extragalactic studies.
- A broken power law with the Kroupa break at 0.5 solar masses gives a low-mass slope consistent with -1.3 but a high-mass slope steeper than the canonical -2.3; if this persists, it points to a subtle mass-dependent environmental effect.
Where Pith is reading between the lines
- An internal consistency check the paper does not discuss: 0.15/(1-0.6) = 0.375, slightly higher than the quoted 0.34 total binary fraction; tracking down whether this reflects q_min>0, residual field contamination, or the exact treatment of the q=0.6 boundary would tighten the binary measurement.
- The flat-mass-ratio assumption is the main lever: if future data show the true q-distribution favors low-q companions, both the total binary fraction and the binary correction to the luminosity function change, which would shift alpha in the direction of steeper (more Salpeter-like) or shallower values.
- A natural extension is to apply the same analysis to multiple LMC/SMC fields with different star-formation histories; comparing alpha across those fields would directly test whether the weak environmental dependence claimed here is universal or field-specific.
- For population-synthesis models of dwarf galaxies, the result implies that assuming a Salpeter IMF below 0.5 solar masses overpredicts the number of faint low-mass stars; switching to a Kroupa-like form would lower the predicted stellar mass-to-light ratios by a modest factor.
Editorial analysis
A structured set of objections, weighed in public.
Referee Report
Summary. The paper presents JWST/NIRCam F115W+F322W2 photometry of an LMC field near NGC 1846. It separates the cluster and field populations via an EFF radial-density profile, measures the fraction of unresolved binaries with mass ratio q>0.6 from CMD region counts (f_q>0.6 = 0.15±0.01), converts this to a total binary fraction f_TOT = 0.34±0.02 assuming a flat mass-ratio distribution, measures a negligible wide-binary fraction (0.01±0.01), and derives the field mass function over 0.17–0.82 M_sun, obtaining a single power-law slope α = -1.49±0.16. This slope is compared with determinations in the SMC, Milky Way, and star clusters, leading to the conclusion that binary formation and the low-mass MF depend only weakly on environment. The analysis uses standard tools: KS2 photometry, artificial-star completeness, TRILEGAL foreground subtraction, BaSTI isochrones, and the Milone et al. CMD binary-fraction method.
Significance. If correct, this is a valuable first JWST-based low-mass MF measurement in the LMC field, reaching 0.17 M_sun and providing a direct comparison with the SMC field from the same group. The binary-fraction measurement, including the first direct constraint on wide binaries in the LMC, is also of interest. The paper is generally well-structured and uses a standard, well-referenced reduction and analysis pipeline. The main scientific weight, however, rests on two assumptions: the flat mass-ratio distribution and the internal consistency of the binary fraction. The reported slope uncertainty does not yet include systematic variations from the binary correction or the adopted isochrone, so the quoted error budget needs strengthening before the environmental-dependence claim can be accepted at face value.
major comments (3)
- [Section 4.1, Eq. (3), Table 1] The conversion f_q>0.6 = 0.15±0.01 to f_TOT = 0.34±0.02 is not the arithmetic consequence of the stated flat mass-ratio distribution over 0<q<1. For a flat distribution, P(q>0.6)=0.4, so the implied total fraction is 0.15/0.4 = 0.375±0.025, not 0.34±0.02. No q_min or normalization that would produce 0.34 is stated. Since f_TOT is subsequently used in the §5.1 luminosity-function binary correction, this discrepancy is not merely typographical. Please recompute f_TOT consistently, propagate its uncertainty, and re-derive the MF slope with the corrected value.
- [Sections 5.1–5.2, Table 1] The LF correction in §5.1 adopts f_TOT and a flat mass-ratio distribution, but the quoted slope uncertainty (±0.16) contains only the random fit uncertainty. The directly measured f_q>0.6 constrains only the integral of p(q) over q>0.6 for primaries with 22.5<m_F322W2<23.2 (≈0.55–0.76 M_sun); it does not constrain the shape of p(q) below 0.6, which is exactly what is used to correct the LF over 0.17–0.82 M_sun. Please propagate the uncertainty in f_TOT and test alternative p(q) shapes (e.g., p(q)∝q^{-1}, p(q)∝q) in the LF correction, reporting the resulting shifts in α. Without this, the 'weak environmental dependence' conclusion is conditional on an unverified assumption.
- [Sections 3 and 5.2, Fig. 4] The mass–luminosity relation used to convert the LF into a MF is a single 2 Gyr, Z=0.006, [α/Fe]=+0.2 isochrone, while the field population is described as composite with ages from 1 to 11 Gyr. Although the lower MS is nearly age-independent below m_F322W2≈22.5, metallicity and [α/Fe] can still shift the mass scale and hence the fitted slope. A sensitivity test varying these parameters, or at least the adopted age, should be reported. Otherwise the ±0.16 uncertainty excludes a potentially important systematic, particularly because the main conclusion is a cross-environment comparison of α.
minor comments (5)
- [Section 4.1, Table 1] If f_TOT is computed as f_q>0.6/0.4, the propagated uncertainty is 0.025, not 0.02. Please align the quoted uncertainty with the stated propagation formula.
- [Section 5.1, Eq. (5)] The description of the binary correction is brief. Please specify whether the correction is applied by subtracting a synthetic binary population from the observed LF or by reassigning observed binary systems to primary-mass bins, and how this interacts with the contamination-matrix inversion of Eq. (5).
- [Section 3] The statement that differential reddening is 'negligible' is not quantified. A limit or a reference for the adopted value E(B-V)=0.01 would make this more reproducible.
- [Section 3] The robustness test with separation radii 90–125 arcsec is mentioned but the resulting binary fractions and MF slopes are not reported. Including these values in a table or appendix would strengthen the claim that the results are insensitive to the adopted radial cut.
- [Section 5.2] For the broken power-law fit, the break at 0.5 M_sun is fixed a priori; please state this explicitly and describe how the uncertainties on the two slopes were computed.
Circularity Check
f_TOT and the MF correction rest on a self-cited flat-q ansatz, but the MF slope itself is not definitionally tied to the binary fraction.
specific steps
-
ansatz smuggled in via citation
[Sect. 4.1 (after Eq. 3) → Sect. 5.1 (binary correction to LF)]
"Assuming a flat mass-ratio distribution, i.e., a constant probability distribution for all mass ratios 0<q<1, we inferred a total binary fraction of f_TOT_bin=0.34±0.02. This assumption is supported by several studies of binary populations in stellar systems (Milone et al. 2012a, 2016; Cordoni et al. 2023). ... Following Legnardi et al. (2025), we adopted the total binary fraction inferred in Sect. 4, f_TOT_bin=0.34±0.02, and assumed a flat mass-ratio distribution."
The directly measured quantity is only f_q>0.6=0.15±0.01; f_TOT=0.34 is obtained by assuming a flat q distribution, which is then reused in Sect. 5.1 to correct the luminosity function before fitting the MF slope. The cited support for flat q (Milone et al. 2012a, 2016; Cordoni et al. 2023; Legnardi et al. 2025) comes from the same research group and adopts the same flat-q ansatz to convert f_q>0.6 into f_TOT, so no independent constraint on p(q) over 0<q<1 is provided. The binary-fraction result and the binary correction therefore inherit a self-cited assumption. The MF slope is not definitionally equal to f_TOT, so the circularity is partial.
full rationale
The derivation of the MF slope is not circular in the strict sense: α=-1.49±0.16 is fitted from a completeness- and binary-corrected luminosity function, and α is not equal to f_TOT or f_q>0.6 by construction. The binary fraction is measured from a CMD region and then used as an input to correct the LF; this is an internal calibration rather than an independent external benchmark, but it is not a fitted parameter renamed as a prediction. The main circularity-adjacent issue is that f_TOT=0.34 is not directly constrained by the data; it follows from f_q>0.6=0.15 only under a flat-q distribution whose cited support is from the same group's prior work using the same flat-q ansatz. That assumption is then propagated into the MF correction, making the binary-related parts of the analysis partially dependent on a self-cited ansatz. I also flag a correctness/robustness issue, not a circularity: under the stated flat q over 0<q<1, P(q>0.6)=0.4, so f_q>0.6/0.4=0.375, not 0.34; no conversion equation is given. This internal inconsistency could shift the binary correction and hence α, but it does not make α equal to an input by definition. Because the central MF slope retains independent content from star counts, completeness, and the adopted mass-luminosity relation, the circularity score is moderate.
Axiom & Free-Parameter Ledger
free parameters (5)
- Isochrone age =
2 Gyr
- Metallicity Z =
0.006
- [α/Fe] =
+0.2
- Distance modulus (m-M)_0 =
18.50
- Foreground reddening E(B-V) =
0.01
axioms (6)
- domain assumption The mass-ratio distribution of unresolved binaries is flat over 0<q<1 (or over q_min<q<1) and independent of primary mass.
- domain assumption The present-day field MF traces the IMF over 0.17-0.82 M_sun; dynamical evolution has not significantly altered the mass function in the LMC field.
- domain assumption The BaSTI 2 Gyr, Z=0.006 isochrone provides a valid mass-luminosity relation for all field stars with 22.5<m_F322W2<26.6.
- domain assumption TRILEGAL simulations accurately predict foreground/background contamination in the observed field.
- domain assumption Artificial-star tests accurately reproduce the completeness and photometric-error properties of the data.
- domain assumption The EFF profile and the r=100'' cut cleanly separate NGC 1846 from the LMC field, with residual cluster contamination of ~2%.
read the original abstract
Nearby galaxies such as the Large Magellanic Cloud (LMC) offer an ideal laboratory to test the initial mass function under different physical conditions, but previous works have been limited by photometric depth and have therefore poorly constrained the low-mass regime. Here, we analyze ultra-deep James Webb Space Telescope observations of a field in the LMC outskirts, near the intermediate-age and massive star cluster NGC 1846. Using the $m_{\rm F322W2}$ versus $m_{\rm F115W}-m_{\rm F322W2}$ color-magnitude diagram, we derive the mass function (MF) down to unprecedentedly low masses ($M=0.17 M_{\odot}$), explicitly accounting for the contribution of unresolved binaries, whose fraction is constrained directly from the data. For systems with mass ratios $q>0.6$, we measure a binary fraction of $f_{\rm bin}^{q>0.6}=0.15\pm0.01$, implying a total binary fraction of $f_{\rm bin}^{\rm TOT}=0.34\pm0.02$ for a flat mass-ratio distribution. This is consistent with values in the Small Magellanic Cloud (SMC) and in the Milky Way field, suggesting similar binary formation efficiency across low-density environments. We also derive the MF over the mass interval 0.17-0.82 $M_{\odot}$ and fit it with a power law, obtaining a slope of $\alpha = -1.49 \pm 0.16$. This slope is shallower than the canonical Salpeter value ($\alpha=-2.35$) and slightly shallower than that measured in the SMC field, while remaining consistent with determinations for Galactic open clusters and for several clusters in the Magellanic Clouds and the Milky Way. Together, these results support a scenario in which both binary formation efficiency and the shape of the low-mass MF depend only weakly on the environment.
Figures




Reference graph
Works this paper leans on
-
[1]
L., & Norman, M
Abel, T., Bryan, G. L., & Norman, M. L. 2002, Science, 295, 93
2002
-
[2]
R., Koerner, D
Allen, P. R., Koerner, D. W., Reid, I. N., & Trilling, D. E. 2005, ApJ, 625, 385
2005
-
[3]
R., et al
Anderson, J., Sarajedini, A., Bedin, L. R., et al. 2008, AJ, 135, 2055
2008
-
[4]
R., & Meyer, M
Bastian, N., Covey, K. R., & Meyer, M. R. 2010, ARA&A, 48, 339
2010
-
[5]
2023, MNRAS, 521, 3991
Baumgardt, H., Hénault-Brunet, V ., Dickson, N., & Sollima, A. 2023, MNRAS, 521, 3991
2023
-
[6]
R., et al
Bellini, A., Anderson, J., Bedin, L. R., et al. 2017, ApJ, 842, 6
2017
-
[7]
J., Hawley, S
Bochanski, J. J., Hawley, S. L., Covey, K. R., et al. 2010, AJ, 139, 2679
2010
-
[8]
P., et al
Bortolan, E., Bruce, J., Milone, A. P., et al. 2025, A&A, 696, A220
2025
-
[9]
S., & Larson, R
Bromm, V ., Coppi, P. S., & Larson, R. B. 2002, ApJ, 564, 23
2002
-
[10]
2014, MNRAS, 438, 2765
Calura, F., Gilli, R., Vignali, C., et al. 2014, MNRAS, 438, 2765
2014
-
[11]
& Menci, N
Calura, F. & Menci, N. 2009, MNRAS, 400, 1347
2009
-
[12]
M., Alatalo, K., et al
Cappellari, M., McDermid, R. M., Alatalo, K., et al. 2012, Nature, 484, 485
2012
-
[13]
2003, PASP, 115, 763
Chabrier, G. 2003, PASP, 115, 763
2003
-
[14]
E., Gennaro, M., Correnti, M., McQuinn, K
Cohen, R. E., Gennaro, M., Correnti, M., McQuinn, K. B. W., & Chandra, V . 2026, ApJ, 1000, 151
2026
-
[15]
& van Dokkum, P
Conroy, C. & van Dokkum, P. G. 2012, ApJ, 760, 71
2012
-
[16]
P., Marino, A
Cordoni, G., Milone, A. P., Marino, A. F., et al. 2023, A&A, 672, A29 Da Rio, N., Gouliermis, D. A., & Henning, T. 2009, ApJ, 696, 528
2023
-
[17]
P., Renzini, A., et al
Dondoglio, E., Milone, A. P., Renzini, A., et al. 2022, ApJ, 927, 207
2022
-
[18]
Elson, R. A. W., Fall, S. M., & Freeman, K. C. 1987, ApJ, 323, 54
1987
-
[19]
M., Tumlinson, J., et al
Geha, M., Brown, T. M., Tumlinson, J., et al. 2013, ApJ, 771, 29
2013
-
[20]
Girardi, L., Groenewegen, M. A. T., Hatziminaoglou, E., & da Costa, L. 2005, A&A, 436, 895
2005
-
[21]
2014, ApJ, 797, 35
Goudfrooij, P., Girardi, L., Kozhurina-Platais, V ., et al. 2014, ApJ, 797, 35
2014
-
[22]
2005, ApJ, 623, 846
Gouliermis, D., Brandner, W., & Henning, T. 2005, ApJ, 623, 846
2005
-
[23]
2006, ApJ, 641, 838
Gouliermis, D., Brandner, W., & Henning, T. 2006, ApJ, 641, 838
2006
-
[24]
A., Mould, J
Holtzman, J. A., Mould, J. R., Gallagher, III, J. S., et al. 1997, AJ, 113, 656
1997
-
[25]
M., Carraro, G., Evans, C
Kalari, V . M., Carraro, G., Evans, C. J., & Rubio, M. 2018, ApJ, 857, 132
2018
-
[26]
S., Anderson, J., Dotter, A., et al
Kalirai, J. S., Anderson, J., Dotter, A., et al. 2013, ApJ, 763, 110
2013
-
[27]
2020, MNRAS, 492, 2177
Kamann, S., Bastian, N., Gossage, S., et al. 2020, MNRAS, 492, 2177
2020
-
[28]
2001, MNRAS, 322, 231
Kroupa, P. 2001, MNRAS, 322, 231
2001
-
[29]
& Boily, C
Kroupa, P. & Boily, C. M. 2002, MNRAS, 336, 1188
2002
-
[30]
V ., Muratore, F., Milone, A
Legnardi, M. V ., Muratore, F., Milone, A. P., et al. 2025, A&A, 702, A180
2025
-
[31]
D., Broby Nielsen, P., Ferguson, A
Mackey, A. D., Broby Nielsen, P., Ferguson, A. M. N., & Richardson, J. C. 2008, ApJ, 681, L17
2008
-
[32]
D., Da Costa, G
Mackey, A. D., Da Costa, G. S., Ferguson, A. M. N., & Yong, D. 2013, ApJ, 762, 65
2013
-
[33]
V ., Muratore, F., Milone, A
Marchuk, A. V ., Muratore, F., Milone, A. P., et al. 2026, A&A, 708, A329
2026
-
[34]
F., Milone, A
Marino, A. F., Milone, A. P., Legnardi, M. V ., et al. 2024, ApJ, 965, 189
2024
-
[35]
A., Kirkpatrick, J
Metchev, S. A., Kirkpatrick, J. D., Berriman, G. B., & Looper, D. 2008, ApJ, 676, 1281
2008
-
[36]
P., Bedin, L
Milone, A. P., Bedin, L. R., Piotto, G., & Anderson, J. 2009, A&A, 497, 755
2009
-
[37]
P., Cordoni, G., Marino, A
Milone, A. P., Cordoni, G., Marino, A. F., et al. 2023, A&A, 672, A161
2023
-
[38]
P., Marino, A
Milone, A. P., Marino, A. F., Bedin, L. R., et al. 2016, MNRAS, 455, 3009
2016
-
[39]
P., Marino, A
Milone, A. P., Marino, A. F., Bernizzoni, M., et al. 2025, A&A, 698, A247
2025
-
[40]
P., Cordoni, G., et al
Mohandasan, A., Milone, A. P., Cordoni, G., et al. 2024, A&A, 681, A42
2024
-
[41]
Morgan, D. H. 1994, A&AS, 103, 235
1994
-
[42]
V ., Milone, A
Muratore, F., Legnardi, M. V ., Milone, A. P., et al. 2026, A&A, 708, A100
2026
-
[43]
P., D’Antona, F., et al
Muratore, F., Milone, A. P., D’Antona, F., et al. 2024, A&A, 692, A135
2024
-
[44]
2018, MNRAS, 481, 3382
Nardiello, D., Libralato, M., Piotto, G., et al. 2018, MNRAS, 481, 3382
2018
-
[45]
Offner, S. S. R., Clark, P. C., Hennebelle, P., et al. 2014, in Protostars and Planets VI, ed. H. Beuther, R. S. Klessen, C. P. Dullemond, & T. Henning, 53–75
2014
-
[46]
Offner, S. S. R., Moe, M., Kratter, K. M., et al. 2023, in Astronomical Society of the Pacific Conference Series, V ol. 534, Protostars and Planets VII, ed. S. Inutsuka, Y . Aikawa, T. Muto, K. Tomida, & M. Tamura, 275
2023
-
[47]
S., Nordlander, T., Da Costa, G
Oh, W. S., Nordlander, T., Da Costa, G. S., & Mackey, A. D. 2023, MNRAS, 519, 831
2023
-
[48]
Paust, N. E. Q., Reid, I. N., Piotto, G., et al. 2010, AJ, 139, 476
2010
-
[49]
2021, ApJ, 908, 102
Pietrinferni, A., Hidalgo, S., Cassisi, S., et al. 2021, ApJ, 908, 102
2021
-
[50]
J., Burningham, B., Tamura, M., et al
Pinfield, D. J., Burningham, B., Tamura, M., et al. 2008, MNRAS, 390, 304
2008
-
[51]
2022, A&A, 664, A26
Pouteau, Y ., Motte, F., Nony, T., et al. 2022, A&A, 664, A26
2022
-
[52]
N., Gizis, J
Reid, I. N., Gizis, J. E., & Hawley, S. L. 2002, AJ, 124, 2721
2002
-
[53]
N., Kirkpatrick, J
Reid, I. N., Kirkpatrick, J. D., Liebert, J., et al. 1999, ApJ, 521, 613
1999
-
[54]
J., Anderson, J., et al
Sabbi, E., Lennon, D. J., Anderson, J., et al. 2016, ApJS, 222, 11
2016
-
[55]
D., & Loeb, A
Safarzadeh, M., Simon, J. D., & Loeb, A. 2022, ApJ, 930, 54
2022
-
[56]
Salpeter, E. E. 1955, ApJ, 121, 161 Schröder, K. P. & Pagel, B. E. J. 2003, MNRAS, 343, 1231
1955
-
[57]
2025, PASP, 137, 104103
Shariat, C., El-Badry, K., Gennaro, M., et al. 2025, PASP, 137, 104103
2025
-
[58]
2019, MNRAS, 489, 2377
Sollima, A. 2019, MNRAS, 489, 2377
2019
-
[59]
& Baumgardt, H
Sollima, A. & Baumgardt, H. 2017, MNRAS, 471, 3668
2017
-
[60]
2017, MNRAS, 468, 3828 van Dokkum, P
Usher, C., Pastorello, N., Bellstedt, S., et al. 2017, MNRAS, 468, 3828 van Dokkum, P. G. & Conroy, C. 2010, Nature, 468, 940
2017
-
[61]
Wyse, R. F. G., Gilmore, G., Houdashelt, M. L., et al. 2002, New A, 7, 395
2002
-
[62]
A., et al
Zoccali, M., Cassisi, S., Frogel, J. A., et al. 2000, ApJ, 530, 418 Article number, page 10 of 10
2000
discussion (0)
Sign in with ORCID, Apple, or X to comment. Anyone can read and Pith papers without signing in.