REVIEW 3 major objections 5 minor 42 references
Benchmarking air-conditioning energy performance of residential rooms based on regression and clustering techniques
T0 review · 3 major / 5 minor · reviewed 2026-08-14 · deepseek-v4-flash
Pith's one-line read This paper claims that air-conditioning energy performance of residential rooms can be benchmarked fairly by building a regression model for each room, clustering comparable rooms, and comparing predicted power under identical weather and…
desk verdict Competent applied paper with a real niche, but the 'valid and fair' conclusion is stronger than the internal validation supports. read the letter →
The pith
A machine-rendered reading of the paper's core claim, the machinery that carries it, and where it could break.
The reading
What carries the argument
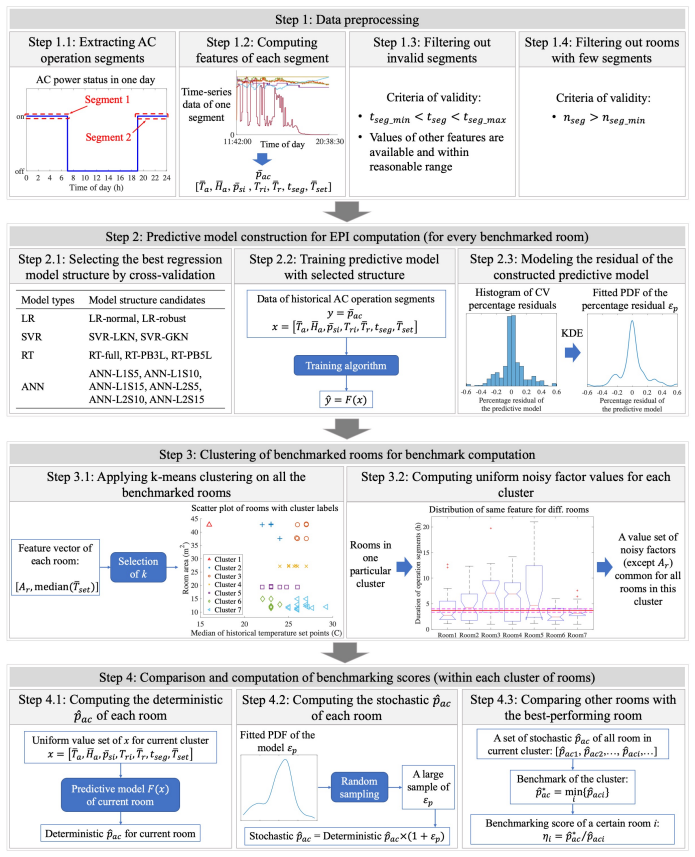
The load-bearing mechanism is the pair of a per-room regression model and a cluster. For each room, a regression model $F(\bar{T}_a, \bar{H}_a, \bar{p}_{si}, T_{ri}, \bar{T}_r, t_{seg}, \bar{T}_{set})$ predicts average AC power $\bar{p}_{ac}$ from segment-wise weather, temperature, duration, and set-point inputs; its percentage residual is modeled by kernel density estimation and sampled so each room's representative energy performance index is stochastic. Rooms are grouped by k-means clustering on room area and median set point, and within each cluster a uniform value set is computed from overlapping percentile ranges of historical data. The benchmark is the lowest stochastic predicted power in the cluster, and the score is $\eta = \hat{p}_{ac}^* / \hat{p}_{ac}$. The regression handles factors that vary segment to segment, the clustering handles the two factors that define comparability, and the uniform value set equalizes the rest.
What would settle it
Take one cluster and the uniform noisy-factor values computed for it. For each room, count the historical operation segments whose features fall within a small neighborhood of that point, for example within one standard deviation of each chosen value. If the room ranked worst has few or no segments there while the room ranked best has many, its predicted power is an extrapolation. A direct test: retrain each room's model only on segments in that neighborhood and recompute the scores; if the rankings change materially, the fairness claim fails.
Extended reading notes
Core claim
The paper's discovery claim is that benchmarking the AC energy performance of residential rooms is feasible as a fully data-driven peer comparison: instead of averaging historical power use, each room gets a regression model of average power per AC operation segment as a function of seven noisy factors (ambient temperature, humidity, solar irradiance, initial room temperature, average room temperature, segment duration, and temperature set point), and rooms are clustered by room area and median set point. Within each cluster, one uniform set of noisy-factor values is chosen from the overlap of the rooms' historical ranges; every room's predicted power at that point, made stochastic by sampling the model's percentage residual, is compared with the lowest predicted power in the cluster. The ratio of best to room becomes the benchmarking score. Using 44 rooms, the paper shows that this procedure changes rankings relative to raw historical comparisons, including reversing the order of two tenants of the same physical room, and concludes that the scores are valid and fair because all eight selected noisy factors have been equalized.
Load-bearing premise
The approach assumes that the single uniform set of weather and setting values used to compare rooms sits inside the reliable prediction region of every room's regression model; the overlap check covers historical percentile ranges, not the accuracy of each model at the chosen point.
Editorial extensions
If this is right
- Within a cluster, benchmarking scores reflect only differences the paper attributes to AC system quality, maintenance, and user behavior, because all eight noisy factors are equalized.
- Rooms that historically operated under different weather and settings can be compared directly, as long as their historical ranges overlap.
- The approach runs without manual benchmark selection or simulation calibration, using only power, temperature, weather, and room-area data, so it scales to larger sets of rooms.
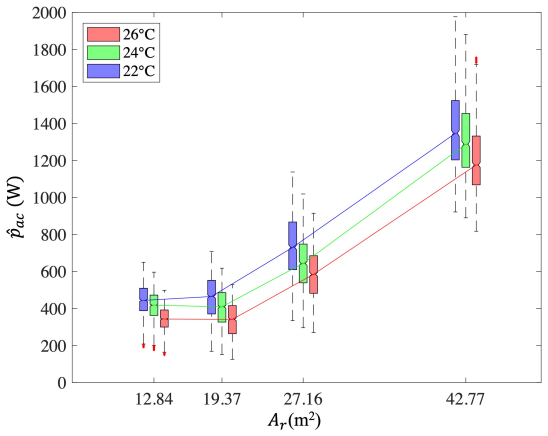
- The trained models can be reused to simulate how room area and temperature set point affect AC power, turning the benchmark into an analytical tool.
- A room that ends up alone in its cluster receives no meaningful peer score; the paper proposes supplementing with previous-performance benchmarking for such cases.
Reading between the lines
- The fairness claim is conditional on model accuracy at the uniform query point; a natural robustness check is to restrict scoring to rooms whose training data actually cover that point, and this could reshuffle rankings in clusters with sparse overlap.
- Because the score is a ratio to the best room in the same cluster, it measures relative performance, not absolute efficiency; a cluster of uniformly wasteful rooms would still produce scores near one, so the method identifies outliers rather than an efficiency target.
- The same regression-plus-equalization template transfers to other decentralized energy systems such as heat pumps, water heaters, or lighting, where energy use depends on user settings and ambient conditions, with the noisy-factor list replaced by domain equivalents.
- The tenant-reversal result in the case study suggests the method separates user behavior from the physical room, but confirming that separation as a measure of hardware or maintenance quality would need independent envelope and equipment data, which the paper leaves to future work.
Signed reviews
Editorial analysis
A structured set of objections, weighed in public.
Referee Report
Summary. The paper proposes a data-driven, peer-to-peer benchmarking method for air-conditioning energy performance of residential rooms. For each room, a regression model is trained to predict average AC power from seven segment-wise factors (ambient temperature, humidity, solar irradiance, initial room temperature, average room temperature, segment duration, and temperature set point). Rooms are then clustered by room area and median set point using k-means; within each cluster, a uniform vector of the seven segment-wise factors is derived from overlapping historical percentile ranges, and each room's fitted model is evaluated at that vector to produce a stochastic predicted power. The benchmarking score is the ratio of the cluster's lowest predicted power to the room's predicted power. A case study on 44 rooms reports an average cross-validated MAPE of 14.9%, seven clusters selected by Silhouette value, and a comparison between the proposed scores and two historical-data baselines (Type A and Type B). The authors conclude that the approach eliminates influences of room area, weather, and AC settings and therefore is 'valid and fair.' The core technical pipeline is coherent and the case study is informative, but the validation does not establish the central fairness claim: it shows only that scores change after equalization, not that the new scores are correct.
Significance. Residential room-level AC benchmarking is a genuine and understudied problem, and the proposed combination of per-room regression, clustering, and noisy-factor equalization is a sensible and scalable design. If the equalization were validated against an independent ground truth, the method would be practically useful for energy feedback programs and could be transferred to similar settings. The paper's literature review organized around benchmarking steps is a useful contribution, and the empirical study provides a transparent account of model selection, including cross-validation accuracy and computational cost. However, the central claims of validity and fairness are not adequately supported: the validation compares only internally derived score variants, and the extrapolation and orientation concerns mean the paper currently demonstrates consistency of a procedure rather than correctness of a benchmark.
major comments (3)
- [Section 5.4.2 and Conclusion] The central claim that the proposed benchmarking scores are 'valid and fair' and reveal 'the real AC energy performance' is not supported by the validation. Type A and Type B scores are both computed from the same historical power data used to build the room models; the finding that the proposed scores differ from Type B after equalization (mean absolute difference 0.1378) demonstrates only that the procedure changes the ranking, not that the new ranking is correct. If the regression models are biased at the evaluation point, the equalized scores inherit that bias. An independent check is needed, for example a field experiment with controlled operation, comparison against manufacturer EER or physical measurements, or a synthetic-data study in which the true energy performance is known.
- [Section 4.3.2 (Step 3.2) with Section 4.3.1] The uniform seven-dimensional noisy-factor vector is selected using only marginal percentile overlaps of each factor's historical range. This does not guarantee that the vector lies inside the joint training support of every room's regression model. The paper itself states in Section 4.3.1 that a predictive model 'usually performs worse on input that it has not seen during the training,' yet Step 3.2 checks only whether historical percentile ranges overlap marginally. For a room with sparse or tightly distributed data, e.g., R14-3's set-point distribution in Fig. 5d, the chosen uniform value can be an extrapolation even when every marginal range overlaps. The predicted power is then unreliable, and because the score is a ratio to the minimum predicted power in the cluster, one extrapolated room can set the benchmark. The authors should add a coverage check (e.g., the density of each room's training data at the uniform vector, or the Mahalanobis distance from the training mean) and either restrict to rooms or clusters where coverage is adequate or quantify the uncertainty in the score.
- [Section 3.3 and Table 2] The noisy-factor list omits room orientation and window/solar aperture properties, although Table 2 reports that the studied rooms have four different orientations. In the thermal model of Eq. (8), solar gain is represented only by global solar irradiance (psi) times a conversion ratio; the effect of orientation on the amount of solar radiation reaching the room is not captured. Since orientation is an objective building characteristic outside the user's control, two rooms in the same cluster with east and west orientations can receive different solar loads at the same measured irradiance, and the benchmarking comparison then penalizes the west-facing room rather than its energy performance. The fairness claim requires either adding orientation to the clustering features and a per-orientation solar model, or an explicit assumption about uniformity of orientation within clusters.
minor comments (5)
- [Section 5.4.1, Fig. 5 caption] The caption contains a typo: 'sevens rooms' should be 'seven rooms,' and 'overlaping' should be 'overlapping.'
- [Section 5.1] The sentence beginning 'Tn the filtering process' should read 'In the filtering process.'
- [Section 5.4.1] The phrase 'to balane between the representativeness and computational cost' contains a typo; 'balane' should be 'balance.'
- [Section 4.3.2] The sentence 'The computation of the uniform values of the seven noisy factors for all rooms in the same cluster is done factor by factor, but in the same manner summarized in the following' is grammatically incomplete; rephrase to make the enumeration explicit.
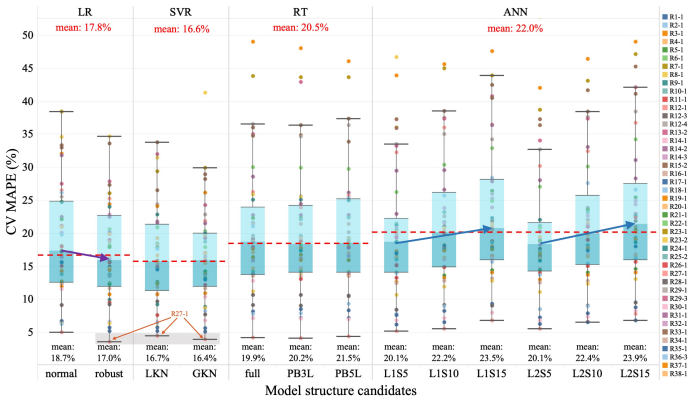
- [Figure 3 and Table 3] The arrows in Fig. 3 indicate how hyper-parameter settings affect model performance, but this is not explained in either the figure caption or the main text; add a clarifying sentence.
Circularity Check
No significant circularity: the equalization of noisy factors is explicit by construction, and the remaining validity question is model accuracy, which is a support gap rather than a circular step.
full rationale
The derivation chain is self-contained: the benchmarking score in Eq. (14) is computed from predicted powers obtained by evaluating each room's fitted regression model at a cluster-uniform noisy-factor vector, with the equalization procedure explicitly described in Sections 4.3.2 and 4.4. This is a design property of the score, not a disguised fitted parameter renamed as a prediction. The paper's claim that the approach "is able to eliminate the influences of room areas, weather conditions, and AC settings" follows directly from the construction of the score, and the paper states this construction openly; it does not present the elimination as an empirical discovery derived from something else. The validation against Type A and Type B scores uses the same historical data that trained the models, so it does not independently verify accuracy at the uniform operating point; this is a limitation of the evidence, and the paper itself acknowledges in Section 4.3.1 that "predictive model usually performs worse on input that it has not seen during the training." That concern, along with the risk of extrapolation for rooms with sparse data, is a correctness or support gap, not circularity. The only self-citation, reference [42], supplies the testbed data and is not load-bearing for the method's derivation. No specific equation reduces to its own input, and no fitted parameter is relabeled as a prediction, so no circular step is present.
Assumptions & free parameters
free parameters (4)
- k (number of clusters) =
7
- nseg_min =
20
- tseg_min and tseg_max =
1 h, 24 h
- Percentile ranges in Step 3.2 =
[40,60], [25,75], [10,90], [min,max]
assumptions (7)
- domain assumption First-order RC thermal model of a cooled room (Eq. 1)
- domain assumption Room temperature stabilizes at the average set point by the end of an operation segment (Eq. 5)
- domain assumption Within a geographical area, room height and envelope conductivity/thickness differences are negligible and wall area is proportional to room area (Section 3.3)
- domain assumption Solar-to-heat conversion (Cs2h) is mostly determined by user curtain behavior (Section 3.3)
- domain assumption The eight selected noisy factors are exhaustive for fairness
- domain assumption Regression models trained on each room's own data generalize to the uniform conditions
- standard math Standard statistical assumptions for cross-validation and KDE (i.i.d. segments, smooth residual density)
Cite this review
Pith. "Pith review of Benchmarking air-conditioning energy performance of residential rooms based on regression and clustering techniques." pith.science (2026). https://pith.science/paper/75MFHKMS
@misc{pith2026190808176,
  author       = {Pith},
  title        = {Pith review of: Benchmarking air-conditioning energy performance of residential rooms based on regression and clustering techniques},
  year         = {2026},
  howpublished = {\url{https://pith.science/paper/75MFHKMS}},
  note         = {Machine review of arXiv:1908.08176}
}
read the original abstract
Air conditioning (AC) accounts for a critical portion of the global energy consumption. To improve its energy performance, it is important to fairly benchmark its energy performance and provide the evaluation feedback to users. However, this task has not been well tackled in the residential sector. In this paper, we propose a data-driven approach to fairly benchmark the AC energy performance of residential rooms. First, regression model is built for each benchmarked room so that its power consumption can be predicted given different weather conditions and AC settings. Then, all the rooms are clustered based on their areas and usual AC temperature set points. Lastly, within each cluster, rooms are benchmarked based on their predicted power consumption under uniform weather conditions and AC settings. A real-world case study was conducted with data collected from 44 residential rooms. Results show that the constructed regression models have an average prediction accuracy of 85.1% in cross-validation tests, and support vector regression with Gaussian kernel is the overall most suitable model structure for building the regression model. In the clustering step, 44 rooms are successfully clustered into seven clusters. By comparing the benchmarking scores generated by the proposed approach with two sets of scores computed from historical power consumption data, we demonstrate that the proposed approach is able to eliminate the influences of room areas, weather conditions, and AC settings on the benchmarking results. Therefore, the proposed benchmarking approach is valid and fair. As a by-product, the approach is also shown to be useful to investigate how room areas, weather conditions, and AC settings affect the AC power consumption of rooms in real life.
Figures


Figures from the paper (5 more)


Reference graph
Works this paper leans on
-
[1]
International Energy Agency (IEA), Building energy performance metrics, https://webstore.iea.org/building-energy-performance-metrics , 2015 [accessed on 12 December 2018]. 34
work page 2015
-
[2]
International Energy Agency (IEA), The future of cooling, https:// webstore.iea.org/the-future-of-cooling , 2018 [accessed on 12 De- cember 2018]
work page 2018
-
[3]
Singapore National Environmental Agency (NEA), Singapore’s second national communication, https://www.nea.gov.sg/ our-services/climate-change-energy-efficiency/climate-change/ national-communications-and-biennial-update-reports , 2010 [accessed on 12 December 2018]
work page 2010
- [4]
-
[5]
S. L. Wong, K. K. Wan, D. H. Li, J. C. Lam, Impact of climate change on residential building envelope cooling loads in subtropical climates, Energy and Buildings 42 (11) (2010) 2098–2103
work page 2010
-
[6]
K. Chua, S. Chou, W. Yang, J. Yan, Achieving better energy-efficient air conditioning–a review of technologies and strategies, Applied Energy 104 (2013) 87–104
work page 2013
-
[7]
V. Vakiloroaya, B. Samali, A. Fakhar, K. Pishghadam, A review of different strategies for hvac energy saving, Energy conversion and management 77 (2014) 738–754
work page 2014
- [8]
Show all 42 references
-
[9]
Kim, J.-H
M.-H. Kim, J.-H. Jo, J.-W. Jeong, Feasibility of building envelope air leak- age measurement using combination of air-handler and blower door, Energy and Buildings 62 (2013) 436–441
2013
-
[10]
A. L. Pisello, F. Asdrubali, Human-based energy retrofits in residential buildings: A cost-effective alternative to traditional physical strategies, Ap- plied Energy 133 (2014) 224–235
2014
-
[11]
Darby, Making it obvious: designing feedback into energy consumption, in: Energy efficiency in household appliances and lighting, Springer, 2001, pp
S. Darby, Making it obvious: designing feedback into energy consumption, in: Energy efficiency in household appliances and lighting, Springer, 2001, pp. 685–696
2001
-
[12]
Chung, Using the fuzzy linear regression method to benchmark the energy efficiency of commercial buildings, Applied Energy 95 (2012) 45–49
W. Chung, Using the fuzzy linear regression method to benchmark the energy efficiency of commercial buildings, Applied Energy 95 (2012) 45–49
2012
-
[13]
H. Wang, P. Xu, X. Lu, D. Yuan, Methodology of comprehensive building energy performance diagnosis for large commercial buildings at multiple levels, Applied Energy 169 (2016) 14–27. 35
2016
-
[14]
Jeong, T
J. Jeong, T. Hong, C. Ji, J. Kim, M. Lee, K. Jeong, Development of an inte- grated energy benchmark for a multi-family housing complex using district heating, Applied energy 179 (2016) 1048–1061
2016
-
[15]
M. Li, Y. Ju, The analysis of the operating performance of a chiller system based on hierarchal cluster method, Energy and Buildings 138 (2017) 695– 703
2017
-
[16]
H. Li, X. Li, Benchmarking energy performance for cooling in large com- mercial buildings, Energy and Buildings 176 (2018) 179–193
2018
-
[17]
P´ erez-Lombard, J
L. P´ erez-Lombard, J. Ortiz, R. Gonz´ alez, I. R. Maestre, A review of bench- marking, rating and labelling concepts within the framework of building energy certification schemes, Energy and Buildings 41 (3) (2009) 272–278
2009
-
[18]
S. Wang, C. Yan, F. Xiao, Quantitative energy performance assessment methods for existing buildings, Energy and buildings 55 (2012) 873–888
2012
-
[19]
Chung, Review of building energy-use performance benchmarking methodologies, Applied Energy 88 (5) (2011) 1470–1479
W. Chung, Review of building energy-use performance benchmarking methodologies, Applied Energy 88 (5) (2011) 1470–1479
2011
-
[20]
E. Wang, Z. Shen, N. Alp, N. Barry, Benchmarking energy performance of residential buildings using two-stage multifactor data envelopment analysis with degree-day based simple-normalization approach, Energy Conversion and Management 106 (2015) 530–542
2015
-
[21]
Z. Li, Y. Han, P. Xu, Methods for benchmarking building energy con- sumption against its past or intended performance: An overview, Applied Energy 124 (2014) 325–334
2014
-
[22]
Lazarova-Molnar, H
S. Lazarova-Molnar, H. R. Shaker, N. Mohamed, et al., Fault detection and diagnosis for smart buildings: State of the art, trends and challenges, in: 2016 3rd MEC International Conference on Big Data and Smart City (ICBDSC), IEEE, 2016, pp. 1–7
2016
-
[23]
P. Wang, R. X. Gao, Automated performance tracking for heat exchangers in hvac, IEEE Transactions on Automation Science and Engineering 14 (2) (2017) 634–645
2017
-
[24]
Z. Du, B. Fan, X. Jin, J. Chi, Fault detection and diagnosis for buildings and hvac systems using combined neural networks and subtractive cluster- ing analysis, Building and Environment 73 (2014) 1–11
2014
-
[25]
Maile, V
T. Maile, V. Bazjanac, M. Fischer, A method to compare simulated and measured data to assess building energy performance, Building and Envi- ronment 56 (2012) 241–251
2012
-
[26]
Kavousian, R
A. Kavousian, R. Rajagopal, Data-driven benchmarking of building energy efficiency utilizing statistical frontier models, Journal of computing in civil engineering 28 (1) (2013) 79–88. 36
2013
-
[27]
Jeong, T
J. Jeong, T. Hong, C. Ji, J. Kim, M. Lee, K. Jeong, C. Koo, Improvements of the operational rating system for existing residential buildings, Applied energy 193 (2017) 112–124
2017
-
[28]
Kavousian, R
A. Kavousian, R. Rajagopal, M. Fischer, Ranking appliance energy ef- ficiency in households: Utilizing smart meter data and energy efficiency frontiers to estimate and identify the determinants of appliance energy ef- ficiency in residential buildings, Energy and Buildings 99 (201...
2015
-
[29]
J. Liu, H. Chen, J. Liu, Z. Li, R. Huang, L. Xing, J. Wang, G. Li, An energy performance evaluation methodology for individual office building with dy- namic energy benchmarks using limited information, Applied Energy 206 (2017) 193–205
2017
-
[30]
Chung, Y
W. Chung, Y. V. Hui, A study of energy efficiency of private office buildings in hong kong, Energy and Buildings 41 (6) (2009) 696–701
2009
-
[31]
P. A. Mathew, L. N. Dunn, M. D. Sohn, A. Mercado, C. Custudio, T. Wal- ter, Big-data for building energy performance: Lessons from assembling a very large national database of building energy use, Applied Energy 140 (2015) 85–93
2015
-
[32]
Filippın, Benchmarking the energy efficiency and greenhouse gases emis- sions of school buildings in central argentina, Building and Environment 35 (5) (2000) 407–414
C. Filippın, Benchmarking the energy efficiency and greenhouse gases emis- sions of school buildings in central argentina, Building and Environment 35 (5) (2000) 407–414
2000
-
[33]
E. Wang, N. Alp, J. Shi, C. Wang, X. Zhang, H. Chen, Multi-criteria build- ing energy performance benchmarking through variable clustering based compromise topsis with objective entropy weighting, Energy 125 (2017) 197–210
2017
-
[34]
C. Koo, T. Hong, Development of a dynamic operational rating system in energy performance certificates for existing buildings: geostatistical ap- proach and data-mining technique, Applied energy 154 (2015) 254–270
2015
-
[35]
H. S. Park, M. Lee, H. Kang, T. Hong, J. Jeong, Development of a new energy benchmark for improving the operational rating system of office buildings using various data-mining techniques, Applied energy 173 (2016) 225–237
2016
-
[36]
Chung, Y
W. Chung, Y. Hui, Y. M. Lam, Benchmarking the energy efficiency of commercial buildings, Applied energy 83 (1) (2006) 1–14
2006
-
[37]
J. Buck, D. Young, The potential for energy efficiency gains in the cana- dian commercial building sector: a stochastic frontier study, Energy 32 (9) (2007) 1769–1780
2007
-
[38]
Charnes, W
A. Charnes, W. W. Cooper, E. Rhodes, Evaluating program and managerial efficiency: an application of data envelopment analysis to program follow through, Management science 27 (6) (1981) 668–697. 37
1981
-
[39]
X. Gao, A. Malkawi, A new methodology for building energy performance benchmarking: An approach based on intelligent clustering algorithm, En- ergy and Buildings 84 (2014) 607–616
2014
-
[40]
Gunay, W
B. Gunay, W. Shen, G. Newsham, Inverse blackbox modeling of the heating and cooling load in office buildings, Energy and Buildings 142 (2017) 200– 210
2017
-
[41]
P. J. Rousseeuw, Silhouettes: a graphical aid to the interpretation and validation of cluster analysis, Journal of computational and applied math- ematics 20 (1987) 53–65
1987
-
[42]
W.-T. Li, S. R. Gubba, W. Tushar, C. Yuen, N. U. Hassan, H. V. Poor, K. L. Wood, C.-K. Wen, Data driven electricity management for residential air conditioning systems: An experimental approach, IEEE Transactions on Emerging Topics in Computing. 38
Reviewed August 14, 2026 · model on record in the stance chip above.
Discussion (0). Continue with ORCID to comment.