REVIEW 3 major objections 5 minor 73 references
Charge-transfer gap size and oxygen hole content as two mechanisms controlling $T_c$ in the Emery model
T0 review · 3 major / 5 minor · reviewed 2026-07-08 · glm-5.2
Pith's one-line read Oxygen holes drive superconducting temperature in cuprate model
desk verdict Two-mechanism Tc optimization in the Emery model: real but preliminary, with a load-bearing caveat on the dominance claim read the letter →
The pith
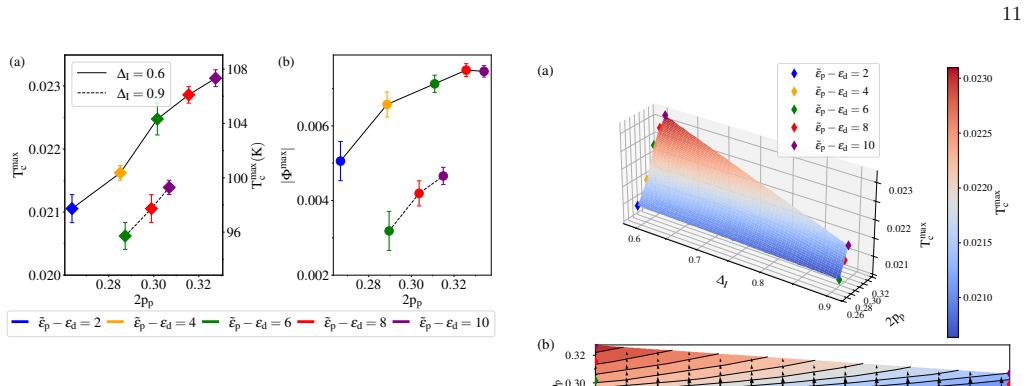
A machine-rendered reading of the paper's core claim, the machinery that carries it, and where it could break.
The reading
What carries the argument
The Zaanen-Sawatzky-Allen diagram serves as the navigational map. It plots the copper onsite repulsion U_d against the bare charge-transfer energy Delta (the energy distance between the upper Hubbard band and the oxygen orbital energy). Contour lines of constant charge gap size and constant oxygen hole content are overlaid on this diagram. The key structural observation is that these two sets of contour lines are not parallel, proving that charge gap size and oxygen hole content are not proportional to each other — they are genuinely independent parameters. This independence is what allows the authors to disentangle their separate effects on the superconducting temperature.
What would settle it
If including Kosterlitz-Thouless phase fluctuations were to shift the optimal doping differently for different charge gap sizes, the ranking of oxygen hole content as the dominant variable could change.
Extended reading notes
Core claim
The charge-transfer gap size and the oxygen hole content are two independent mechanisms controlling the maximum superconducting transition temperature in the Emery model. The temperature increases monotonically as the charge gap decreases and as the oxygen hole content increases, and the oxygen hole content is the dominant variable. This is established by computing superconducting domes at eight points across the Zaanen-Sawatzky-Allen diagram — which classifies insulating states by the relative sizes of the copper repulsion and the copper-oxygen energy difference — at two fixed charge gap sizes, and then mapping the results onto the two-dimensional space of physical observables. The gradient
Load-bearing premise
The superconducting temperature is computed at a mean-field level that neglects Kosterlitz-Thouless phase fluctuations, which are essential in two dimensions. These fluctuations could reduce the maximum temperature and shift the optimal doping, potentially reordering which variable — oxygen hole content or charge gap size — dominates.
Editorial extensions
If this is right
- For proposed ultracold-atom realizations of the Emery model, the paper predicts that maximizing superconducting temperature requires tuning the system deep into the charge-transfer regime (large copper repulsion relative to the copper-oxygen energy difference) while keeping the charge gap small, which corresponds to staying near the metal-insulator boundary.
- The finding that oxygen hole content is the dominant variable suggests that experimental correlations between superconducting temperature and oxygen hole content in real cuprates should be robust against small variations in the charge-transfer gap, providing a theoretical basis for interpreting those measurements.
- The paper provides a two-dimensional optimization framework that can be extended: varying the hopping parameters (currently fixed) would add further dimensions and could reveal whether the dominance of oxygen hole content persists across a broader parameter space.
- The identification of a second favorable region deep in the charge-transfer regime, beyond the previously known optimum near the metal-insulator boundary, suggests a design principle for engineering new superconducting materials: large copper-oxygen covalency combined with a narrow charge gap.
Reading between the lines
- If oxygen hole content is indeed the dominant driver, then material design strategies that increase copper-oxygen covalency — for instance through chemical pressure, strain, or apical oxygen manipulation — should be more effective at raising the superconducting temperature than strategies that only narrow the charge gap.
- The paper's quantitative limitations (oxygen hole content range matching only La2-xSrxCuO4, predicted temperatures about twice experimental values, optimal doping underestimated by a factor of three) suggest that extending the calculation to include Kosterlitz-Thouless physics and variable hopping parameters could shift the quantitative predictions while preserving the qualitative trend that oxyge
- The observation that the parent insulating state's properties predict superconducting trends upon doping hints at a deeper organizing principle: the mixed copper-oxygen character of the ground-state hole may be a more fundamental indicator of pairing strength than any single energy scale, which would connect to the broader question of why charge-transfer insulators host higher superconducting temp
Signed reviews
Editorial analysis
A structured set of objections, weighed in public.
Referee Report
Summary. This paper uses cellular dynamical mean-field theory (CDMFT) to study the maximum superconducting critical temperature $T_c^{max}$ in the Emery model for hole-doped cuprates. Using the Zaanen-Sawatzky-Allen diagram as a framework, the authors fix the hopping parameters ($t_{pd}=1.5$, $t'_{pp}=1$, $t_{pp}=1$) and systematically vary the bare charge-transfer energy $U_d$ and $d-p$ energy distance. They compute $T_c^{CDMFT}$ for eight parent insulating states corresponding to two charge gap sizes ($Delta_I = 0.6, 0.9$). The central claim is that $Delta_I$ and the oxygen hole content $2p_p$ are two independent mechanisms controlling $T_c^{max}$, with $T_c^{max}$ monotonically increasing as $Delta_I$ decreases and $2p_p$ increases. The authors further claim that $2p_p$ is the dominant variable, as inferred from the gradient of the interpolated $T_c^{max}$ surface in the $(Delta_I, 2p_p)$ plane (Fig. 12).
Significance. The paper tackles an important problem: disentangling the roles of charge-transfer gap size and oxygen hole content in determining $T_c$ in cuprates. The CDMFT methodology is standard and well-implemented, and the authors are transparent about limitations (Sec. V.C). A clear strength is the direct computation of $T_c^{CDMFT}$ rather than relying solely on the superconducting order parameter $Phi$ as a proxy, allowing the authors to verify (Fig. 9b, Fig. 10b) that $Phi^{max}$ and $T_c^{max}$ can exhibit different rates of change. The identification of two distinct, non-proportional mechanisms for controlling $T_c$ is a valuable conceptual contribution. The falsifiable predictions for cold-atom simulators are timely.
major comments (3)
- Sec. V.B, Fig. 12: The central claim that $2p_p$ is the 'dominant variable' rests on the gradient of the interpolated $T_c^{max}$ surface. However, the gradient direction is not invariant under rescaling of the axes. The text states that $Delta_I$ varies in [0.6, 0.9] (absolute change 0.3) while $2p_p$ varies in [0.26, 0.33] (absolute change 0.07). Because the axes have 'equal aspect ratio' but the physical quantities have different units and ranges, the gradient direction is an artifact of the chosen axis scaling. If $Delta_I$ were plotted in eV (as in the secondary axis of Fig. 10, where $t_{pp}=0.4$ eV gives a range of ~0.24 to 0.36 eV), the aspect ratio and hence the gradient direction would change. The dominance claim requires a parameter-free metric, such as comparing $partial T_c^{max}/partial Delta_I$ and $partial T_c^{max}/partial (2p_p)$ in physical units, or a regression-based
- sensitivity analysis. As presented, the gradient in Fig. 12(b) is not a physically meaningful measure of relative importance.
- Sec. V.C and Fig. 12: The $T_c^{max}$ surface in Fig. 12 is an interpolation over only 8 data points (5 at $Delta_I=0.6$, 3 at $Delta_I=0.9$). The gradient field and contour lines are thus derived from a very sparse grid, and the monotonicity claim is supported by limited sampling. The authors should explicitly state the interpolation method used and add uncertainty estimates or error bars to the data points in Fig. 12, so that the robustness of the gradient direction and the monotonicity claim can be assessed.
minor comments (5)
- Sec. V.C: The acknowledgment that KT fluctuations 'can alter the $T_c^{max}$ trends' is appreciated, but the specific risk to the dominance claim is not addressed. The superfluid stiffness $rho_s$ depends on quasiparticle coherence and bandwidth, which are directly controlled by $Delta_I$. If the KT correction is preferentially $Delta_I$-dependent, it could rotate the effective gradient in Fig. 12(b). A brief discussion of this specific risk would strengthen the paper.
- Fig. 2(a): The labels for constant $2p_p$ lines list values from 0.24 to 0.28, but the text in Sec. III.A.2 states the step is 0.1, which should presumably be 0.01.
- Fig. 9(a): The $T_c^{max}$ values are converted to Kelvin using $t_{pp}=0.4$ eV, yielding values around 96-108 K. However, Sec. V.C notes that this is approximately twice the experimental $T_c$ for LSCO. This discrepancy should be noted on the figure or in its caption to avoid confusion.
- Sec. III.A.2: The oxygen hole content is defined as $2p_p = 2(2-n_p)$. It would help to clarify early on whether $p_p$ refers to holes per oxygen orbital or per CuO$_2$ unit cell, as the factor of 2 for orbital degeneracy can be a source of confusion.
- Appendix B, Fig. 14: The data points from Ref. [30] use different hopping amplitudes, as noted in the text. It would be helpful to indicate which specific parameters differ so the reader can assess comparability.
Simulated Author's Rebuttal
We thank the referee for a careful reading and for identifying two important issues with our analysis in Sec. V.B. Both points are well-taken and will be addressed in the revised manuscript.
read point-by-point responses
-
Referee: Sec. V.B, Fig. 12: The central claim that 2p_p is the 'dominant variable' rests on the gradient of the interpolated T_c^max surface. However, the gradient direction is not invariant under rescaling of the axes... The dominance claim requires a parameter-free metric, such as comparing partial T_c^max/partial Delta_I and partial T_c^max/partial (2p_p) in physical units, or a regression-based sensitivity analysis. As presented, the gradient in Fig. 12(b) is not a physically meaningful measure of relative importance.
Authors: The referee is correct that the gradient direction of an interpolated surface is not invariant under rescaling of the axes, and that our claim of 2p_p being the 'dominant variable' as inferred from the gradient in Fig. 12(b) is therefore not well-justified as presented. We acknowledge this as a genuine weakness in our argumentation. We will revise the manuscript to address this in two ways. First, we will remove or substantially soften the claim that 2p_p is the 'dominant variable' as inferred from the gradient direction, since the gradient is indeed scale-dependent and not a parameter-free metric. Second, we will provide a quantitative comparison using the actual data points rather than the interpolated surface. Specifically, from the raw data: (i) at fixed Δ_I = 0.6, T_c^max changes by approximately ΔT_c ≈ 0.0015 (in units of t_pp) as 2p_p varies over a range of ~0.05; (ii) at approximately fixed 2p_p, T_c^max changes by approximately ΔT_c ≈ 0.001 as Δ_I varies over a range of 0.3. We will compute the partial derivatives ∂T_c^max/∂Δ_I and ∂T_c^max/∂(2p_p) directly from the data and compare them in physical units (converting to eV using t_pp = 0.4 eV). We will also perform a simple linear regression of T_c^max on both variables to assess relative importance via standardized coefficients. We note that with only 8 data points, any such quantitative assessment will carry significant uncertainty, which we will state explicitly. The qualitative finding that both Δ_I and 2p_p independently control T_c^max (demonstrated by the fact that the two curves in Fig. 11(a) do not overlap) does not depend on the gradient argument and remains valid. However, the quantitative ranking of which variable is 'dominant' requires the more careful analysis we will add. revision: yes
-
Referee: Sec. V.C and Fig. 12: The T_c^max surface in Fig. 12 is an interpolation over only 8 data points (5 at Delta_I=0.6, 3 at Delta_I=0.9). The gradient field and contour lines are thus derived from a very sparse grid, and the monotonicity claim is supported by limited sampling. The authors should explicitly state the interpolation method used and add uncertainty estimates or error bars to the data points in Fig. 12, so that the robustness of the gradient direction and the monotonicity claim can be assessed.
Authors: The referee is correct on all counts. We will make the following revisions. First, we will explicitly state the interpolation method: we used a standard bilinear interpolation on a uniform grid, as implemented in matplotlib's contourf/contour routines. We will state this in the figure caption and in the text. Second, we will add error bars to the data points in Fig. 12. The uncertainty in T_c^max arises from two sources: (a) the finite temperature grid used to locate the superconducting transition (the temperature spacing is Δβ = 0.5–1.0, corresponding to ΔT ≈ 0.0004–0.0008 in units of t_pp), and (b) statistical Monte Carlo errors on the order parameter Φ, which affect the identification of the transition point. We will estimate and display these error bars. Third, we will add an explicit caveat that the monotonicity claim is based on only 8 data points and that additional data points, particularly at intermediate values of Δ_I (e.g., Δ_I = 0.75) and at additional values of 2p_p within each Δ_I slice, would be needed to robustly establish monotonicity. We note that the sign problem, as discussed in Sec. V.C and Appendix C, limits our ability to reach lower temperatures and thus constrains the density of data we can obtain. We will also add a note that the interpolated surface and gradient field in Fig. 12(b) should be interpreted as a guide to the eye rather than a quantitative reconstruction, especially given the sparsity of the grid. revision: yes
Circularity Check
No significant circularity: the central two-mechanism result is computed from independent CDMFT simulations, not defined in terms of its own conclusions.
full rationale
The paper's central claim is that charge-transfer gap size Δ_I and oxygen hole content 2p_p are two independent mechanisms controlling T_c^max, with 2p_p being dominant. Walking the derivation chain: (1) T_c^CDMFT is computed from CDMFT+CT-HYB quantum Monte Carlo simulations (Sec. II, Eq. 1-2) — this is a first-principles numerical computation, not a definition. (2) Δ_I is extracted from the plateau width in δ(μ) at n_tot=5 (Sec. III.A.1, Fig. 2(b)) — an independent measurement from the simulation data. (3) 2p_p is computed from orbital occupancies n_p (Sec. III.A.2) — also independently measured. (4) The 'two mechanisms' conclusion (Sec. V.B.3) follows from observing that the T_c^max vs 2p_p curves for Δ_I=0.6 and Δ_I=0.9 do not overlap (which would mean 2p_p is the only mechanism) and are not parallel with zero slope (which would mean Δ_I is the only mechanism). This is a genuine comparison of independently computed quantities, not a tautology. (5) The dominance claim (Fig. 12b gradient) follows from interpolating the computed T_c^max(Δ_I, 2p_p) surface and measuring the gradient direction — again, not circular. The companion paper [39] (overlapping authors) establishes the Δ_I=0.6 slice; this paper extends to Δ_I=0.9 and performs the 2D optimization. While self-citation to [39] is present, it is not load-bearing for the central claim: the new Δ_I=0.9 data and the 2D gradient analysis are the novel content, and these are computed independently. The parameter choices (t_pd=1.5, t'_pp=1, ε_d=0) inherited from prior work [22,24,46,47] are methodological conventions, not circular inputs. No step reduces to its own inputs by construction.
Assumptions & free parameters
free parameters (6)
- t_pd =
1.5
- t'_pp =
1
- t_pp =
1 (unit of energy)
- ε_d =
0
- t_pp (eV) =
0.4 eV
- |Φ| threshold =
0.001
assumptions (4)
- domain assumption CDMFT with a 12-site cluster adequately captures d-wave superconducting correlations in the Emery model
- domain assumption T_c^CDMFT (mean-field transition where Φ becomes nonzero) is a meaningful proxy for the physical Tc
- domain assumption The charge gap size Δ_I extracted from the n_tot(μ) plateau is a valid proxy for the spectral gap
- domain assumption Hopping parameters t_pd, t'_pp, t_pp can be held fixed while varying only U_d and Δ
Cite this review
Pith. "Pith review of Charge-transfer gap size and oxygen hole content as two mechanisms controlling $T_c$ in the Emery model." pith.science (2026). https://pith.science/paper/7CEH4DYC
@misc{pith2026260706462,
  author       = {Pith},
  title        = {Pith review of: Charge-transfer gap size and oxygen hole content as two mechanisms controlling $T_c$ in the Emery model},
  year         = {2026},
  howpublished = {\url{https://pith.science/paper/7CEH4DYC}},
  note         = {Machine review of arXiv:2607.06462}
}
abstract
Investigating the drivers of superconducting critical temperature trends in cuprates is crucial for uncovering the mechanism of high-temperature superconductivity. Here we study this problem in the canonical model of the copper-oxygen plane, the Emery model, with cellular dynamical mean-field theory. Using the Zaanen-Sawatzky-Allen diagram as a guiding framework, we systematically quantify how the maximum superconducting critical temperature $T_c^{\rm max}$ depends on the copper-oxygen energy distance and on the local repulsion on the copper orbital. Unexpectedly, $T_c^{\rm max}$ is optimized not only near the charge-transfer insulator to metal boundary, consistent with previous findings, but also deep in the charge-transfer regime, revealing an unexplored mechanism. Then we link model parameters to physical observables, identifying the charge-transfer gap size and the oxygen hole content as two mechanisms controlling $T_c^{\rm max}$. $T_c^{\rm max}$ increases monotonically as the oxygen hole content increases and the charge gap size decreases. The oxygen hole content is the dominant variable in varying $T_c^{\rm max}$. Our work provides predictions for proposed realizations of the Emery model with ultracold atoms and a theoretical framework for understanding key experimental trends in hole-doped cuprates.
Figures


Figures from the paper (10 more)




Reference graph
Works this paper leans on
-
[39]
V. J. Emery, Theory of high-T c superconductivity in oxides , Phys. Rev. Lett.58, 2794 (1987)
work page 1987
-
[1]
We obtain ∆I from the width of the plateau atn tot(µ) =
Charge gap size∆ I First, let us study the charge gap size, denoted by ∆ I. We obtain ∆I from the width of the plateau atn tot(µ) =
-
[2]
2(b) shows the isothermδ(µ) = 5–n tot(µ) for a representative point in theU d −∆ diagram
Fig. 2(b) shows the isothermδ(µ) = 5–n tot(µ) for a representative point in theU d −∆ diagram. Numeri- cally, we define the plateau atn tot(µ) = 5 by the condi- tiondn tot/dµ <0.005. A plateau in the isothermδ(µ) signals an incompressible insulating state. The plateau occurs when the total number of electrons in the CuO 2 unit cell is 5, which is an odd n...
-
[3]
Degree of charge shared among copper and oxygen orbitals Second, let us discuss the degree of charge shared among the copper and oxygen orbitals. The charge- transfer insulating phase occurs atn tot =n d + 2np = 5, or equivalently at one hole per CuO 2 unit cell. Due to the Cu-O hopping amplitudet pd, the copper orbital is slightly more than half-filled a...
-
[4]
Discussion By inspection of Fig. 2(a), the lines of constant charge gap size ∆ I and lines of constant O hole content 2p p are not parallel. This is significant, as it shows that the physical quantities ∆I and 2pp are not proportional. Note that ifU d is kept constant, increasing the charge gap size leads to a decrease of 2p p, as the lines of constant 2p...
-
[5]
Let us translate these trends within the Zaanen-Sawatzky- Allen framework
Discussion We identified two key trends: (i) for a fixed charge gap size ∆ I,T max c increases with decreasing the bare charge-transfer ∆ (or with increasing ˜ϵ p −ϵ d); (ii) for a fixed ˜ϵp −ϵ d,T max c increases with decreasingU d. Let us translate these trends within the Zaanen-Sawatzky- Allen framework. According to the first result, maxi- mizingT max...
-
[6]
We can now discuss their inter- play, which forms the key result of this work
Discussion Oxygen hole content and charge gap size are two quan- tities governingT max c . We can now discuss their inter- play, which forms the key result of this work. Fig. 12(a) showsT max c as a function of ∆ I and 2p p. We obtain the surfaceT max c (∆I,2p p) by interpolating our data (di- amonds) on a uniform grid. The color gradient indicates the ma...
-
[7]
M. R. Norman, The challenge of unconventional super- conductivity, Science332, 196 (2011)
work page 2011
Show all 73 references
-
[8]
Keimer, S
B. Keimer, S. A. Kivelson, M. R. Norman, S. Uchida, and J. Zaanen, From quantum matter to high-temperature superconductivity in copper oxides, Nature518, 179 (2015)
2015
-
[9]
Imada, A
M. Imada, A. Fujimori, and Y. Tokura, Metal-insulator transitions, Rev. Mod. Phys.70, 1039 (1998)
1998
-
[10]
Y. J. Uemura, G. M. Luke, B. J. Sternlieb, J. H. Brewer, J. F. Carolan, W. N. Hardy, R. Kadono, J. R. Kempton, R. F. Kiefl, S. R. Kreitzman, P. Mulhern, T. M. Rise- man, D. L. Williams, B. X. Yang, S. Uchida, H. Takagi, J. Gopalakrishnan, A. W. Sleight, M. A. Subramanian, C. L...
1989
-
[11]
L. Wang, G. He, Z. Yang, M. Garcia-Fernandez, A. Nag, K.-J. Zhou, M. Minola, M. Le Tacon, B. Keimer, Y. Peng, and Y. Li, Paramagnons and high-temperature super- conductivity in a model family of cuprates, Nat. Comm. 10.1038/s41467-022-30918-z (2022)
2022 doi
-
[12]
W. Ruan, C. Hu, J. Zhao, P. Cai, Y. Peng, C. Ye, R. Yu, X. Li, Z. Hao, C. Jin, X. Zhou, Z.-Y. Weng, and Y. Wang, Relationship between the parent charge transfer gap and maximum transition temperature in cuprates, Science Bulletin61, 1826 (2016)
2016
-
[13]
Y. Y. Peng, G. Dellea, M. Minola, M. Conni, A. Amorese, D. Di Castro, G. M. De Luca, K. Kummer, M. Sal- luzzo, X. Sun, X. J. Zhou, G. Balestrino, M. Le Tacon, B. Keimer, L. Braicovich, N. B. Brookes, and G. Ghir- inghelli, Influence of apical oxygen on the extent of in- plane ...
2017
-
[14]
S. M. O’Mahony, W. Ren, W. Chen, Y. X. Chong, X. Liu, H. Eisaki, S. Uchida, M. H. Hamidian, and J. C. S. Davis, On the electron pairing mechanism of copper-oxide high temperature superconductivity, Proceedings of the Na- tional Academy of Sciences119, e2207449119 (2022)
2022
-
[15]
Z. Wang, C. Zou, C. Lin, X. Luo, H. Yan, C. Yin, Y. Xu, X. Zhou, Y. Wang, and J. Zhu, Correlating the charge- transfer gap to the maximum transition temperature in Bi2Sr2Can−1CunO2n+4+δ, Science381, 227 (2023)
2023
-
[16]
Rybicki, M
D. Rybicki, M. Jurkutat, S. Reichardt, C. Kapusta, and J. Haase, Perspective on the phase diagram of cuprate high-temperature superconductors, Nature Communica- 15 0.02 0.04 0.06 δ 0.00 0.04 0.08 0.12 0.16 0.20 sign (a) ˜εp − εd =2, Ud =7.76 β = 50.0 β = 48.0 β = 47.0 1 0.02 0...
2016
-
[17]
Jurkutat, C
M. Jurkutat, C. Kattinger, S. Tsankov, R. Reznicek, A. Erb, and J. Haase, How pressure enhances the crit- ical temperature of superconductivity in YBa 2Cu3O6+y , Proceedings of the National Academy of Sciences120, e2215458120 (2023)
2023
-
[18]
Kotliar, P
G. Kotliar, P. Lee, and N. Read, Fermi liquid description of La 2−xSrxCuO4, Physica C: Superconductivity153- 155, 538 (1988)
1988
-
[19]
Kotliar and J
G. Kotliar and J. Liu, Superexchange mechanism and d-wave superconductivity, Phys. Rev. B38, 5142(R) (1988)
1988
-
[20]
Y. Ohta, T. Tohyama, and S. Maekawa, Apex oxygen and critical temperature in copper oxide superconduc- tors: Universal correlation with the stability of local sin- glets, Phys. Rev. B43, 2968 (1991)
1991
-
[21]
L. F. Feiner, M. Grilli, and C. Di Castro, Apical oxygen ions and the electronic structure of the high-Tc cuprates, Phys. Rev. B45, 10647 (1992)
1992
-
[22]
D. J. Scalapino, Does the Hubbard Model Have the Right Stuff?, inPerspectives in Many-Particle Physics, edited by R. Broglia, J. Schrieffer, and P. Bortignon (North- Holland, 1994) pp. 95–125
1994
-
[23]
Raimondi, J
R. Raimondi, J. H. Jefferson, and L. F. Feiner, Effective single-band models for the high-t c cuprates. ii. role of apical oxygen, Phys. Rev. B53, 8774 (1996)
1996
-
[24]
Pavarini, I
E. Pavarini, I. Dasgupta, T. Saha-Dasgupta, O. Jepsen, and O. K. Andersen, Band-Structure Trend in Hole- Doped Cuprates and Correlation withT cmax, Phys. Rev. Lett.87, 047003 (2001)
2001
-
[25]
P. R. C. Kent, T. Saha-Dasgupta, O. Jepsen, O. K. An- dersen, A. Macridin, T. A. Maier, M. Jarrell, and T. C. Schulthess, Combined density functional and dynamical cluster quantum Monte Carlo calculations of the three- band Hubbard model for hole-doped cuprate supercon- ductor...
2008
-
[26]
Arrigoni, M
E. Arrigoni, M. Aichhorn, M. Daghofer, and W. Hanke, Phase diagram and single-particle spectrum of CuO 2 high- Tc layers: variational cluster approach to the three- band hubbard model, New Journal of Physics11, 055066 (2009)
2009
-
[27]
Weber, C
C. Weber, C. Yee, K. Haule, and G. Kotliar, Scaling of the transition temperature of hole-doped cuprate super- conductors with the charge-transfer energy, EPL (Euro- physics Letters)100, 37001 (2012)
2012
-
[28]
Fratino, P
L. Fratino, P. S´ emon, G. Sordi, and A.-M. S. Tremblay, Pseudogap and superconductivity in two-dimensional doped charge-transfer insulators, Phys. Rev. B93, 245147 (2016)
2016
-
[29]
S. S. Dash and D. S´ en´ echal, Pseudogap transition within the superconducting phase in the three-band Hubbard model, Phys. Rev. B100, 214509 (2019)
2019
-
[30]
Kowalski, S
N. Kowalski, S. S. Dash, P. S´ emon, D. S´ en´ echal, and A.- M. Tremblay, Oxygen hole content, charge-transfer gap, covalency, and cuprate superconductivity, Proceedings of the National Academy of Sciences118, e2106476118 (2021)
2021
-
[31]
P. Mai, G. Balduzzi, S. Johnston, and T. A. Maier, Pair- ing correlations in the cuprates: A numerical study of the three-band Hubbard model, Phys. Rev. B103, 144514 (2021)
2021
-
[32]
P. Mai, G. Balduzzi, S. Johnston, and T. A. Maier, Or- bital structure of the effective pairing interaction in the high-temperature superconducting cuprates, npj Quan- tum Materials6, 26 (2021). 16
2021
-
[33]
J. c. v. Vuˇ ciˇ cevi´ c and M. Ferrero, Simple predictors ofTc in superconducting cuprates and the role of interactions between effective Wannier orbitals in thed−pthree-band model, Phys. Rev. B109, L081115 (2024)
2024
-
[34]
Z.-H. Cui, J. Yang, J. T¨ olle, H.-Z. Ye, S. Yuan, H. Zhai, G. Park, R. Kim, X. Zhang, L. Lin, T. C. Berkelbach, and G. K.-L. Chan, Ab initio quantum many-body descrip- tion of superconducting trends in the cuprates, Nature Communications16, 1845 (2025)
2025
-
[35]
Bacq-Labreuil, B
B. Bacq-Labreuil, B. Lacasse, A.-M. S. Tremblay, D. S´ en´ echal, and K. Haule, Toward an ab initio theory of high-temperature superconductors: A study of multi- layer cuprates, Phys. Rev. X15, 021071 (2025)
2025
-
[36]
St-Cyr and D
L.-B. St-Cyr and D. S´ en´ echal, Effect of the Coulomb re- pulsion and oxygen level on charge distribution and su- perconductivity in the Emery model for cuprates super- conductors, SciPost Phys. Core8, 043 (2025)
2025
-
[37]
Vadnais, R
S. Vadnais, R. Duchesne, K. Haule, A. M. S. Tremblay, D. S´ en´ echal, and B. Bacq-Labreuil, The role of the api- cal oxygen in cuprate high-temperature superconductors (2026), arXiv:2601.16017 [cond-mat.str-el]
2026
-
[38]
Jacob, M
E. Jacob, M. O. Malcolms, V. Christiansson, L. M. Ver- hoff, P. Worm, L. Si, P. Hansmann, T. Sch¨ afer, and K. Held, Beyond the conventional Emery model: crucial role of long-range hopping for cuprate superconductivity (2026), arXiv:2605.07739 [cond-mat.str-el]
2026 arXiv
-
[40]
Varma, S
C. Varma, S. Schmitt-Rink, and E. Abrahams, Charge transfer excitations and superconductivity in ionic met- als, Solid State Communications62, 681 (1987)
1987
-
[41]
A.-M. S. Tremblay, Strongly correlated superconductiv- ity, inEmergent Phenomena in Correlated Matter Mod- eling and Simulation, Vol. 3, edited by E. Pavarini, E. Koch, and U. Schollw¨ ock (Verlag des Forschungszen- trum, J¨ ulich, 2013) Chap. 10
2013
-
[42]
Zaanen, G
J. Zaanen, G. A. Sawatzky, and J. W. Allen, Band gaps and electronic structure of transition-metal compounds , Phys. Rev. Lett.55, 418 (1985)
1985
-
[43]
Kotliar, Strong correlation transport and coherence, International Journal of Modern Physics B05, 341 (1991)
G. Kotliar, Strong correlation transport and coherence, International Journal of Modern Physics B05, 341 (1991)
1991
-
[44]
Baumg¨ artel, J
G. Baumg¨ artel, J. Schmalian, and K.-H. Bennemann, Theory for the electronic structure of high-T c supercon- ductors, Phys. Rev. B48, 3983 (1993)
1993
-
[45]
E. M. O’Callaghan, N. Kowalski, P. S´ emon, A.-M. S. Tremblay, and G. Sordi, Correlation of maximum su- perconducting critical temperature with copper-oxygen energy distance and oxygen hole content in the Emery model (2026)
2026
-
[46]
Andersen, A
O. Andersen, A. Liechtenstein, O. Jepsen, and F. Paulsen, LDA energy bands, low energy hamiltoni- ans, t’,t”,t ⊥(k) andJ ⊥, J. Phys, Chem. Solids56, 1573 (1995)
1995
-
[47]
Maier, M
T. Maier, M. Jarrell, T. Pruschke, and M. H. Hettler, Quantum cluster theories, Rev. Mod. Phys.77, 1027 (2005)
2005
-
[48]
Kotliar, S
G. Kotliar, S. Y. Savrasov, K. Haule, V. S. Oudovenko, O. Parcollet, and C. A. Marianetti, Electronic struc- ture calculations with dynamical mean-field theory, Rev. Mod. Phys.78, 865 (2006)
2006
-
[49]
A.-M. S. Tremblay, B. Kyung, and D. S´ en´ echal, Pseudo- gap and high-temperature superconductivity from weak to strong coupling. Towards a quantitative theory, Low Temp. Phys.32, 424 (2006)
2006
-
[50]
Georges, G
A. Georges, G. Kotliar, W. Krauth, and M. J. Rozen- berg, Dynamical mean-field theory of strongly correlated fermion systems and the limit of infinite dimensions, Rev. Mod. Phys.68, 13 (1996)
1996
-
[51]
Kowalski,Dopage, temperature critique et ´ etude du mod` ele de Hubbard ` a trois bandes, Master’s thesis, Uni- versit´ e de Sherbrooke, Sherbrooke, QC, Canada (2021)
N. Kowalski,Dopage, temperature critique et ´ etude du mod` ele de Hubbard ` a trois bandes, Master’s thesis, Uni- versit´ e de Sherbrooke, Sherbrooke, QC, Canada (2021)
2021
-
[52]
Sordi, G
G. Sordi, G. L. Reaney, N. Kowalski, P. S´ emon, and A.- M. S. Tremblay, Ambipolar doping of a charge-transfer insulator in the emery model, Phys. Rev. B111, 045117 (2025)
2025
-
[53]
G. L. Reaney, N. Kowalski, A.-M. S. Tremblay, and G. Sordi, Charge gap and charge redistribution among copper and oxygen orbitals in the normal state of the Emery model, Phys. Rev. B112, 125106 (2025)
2025
-
[54]
Go and A
A. Go and A. J. Millis, Spatial correlations and the in- sulating phase of the high-T c cuprates: Insights from a configuration-interaction-based solver for dynamical mean field theory, Phys. Rev. Lett.114, 016402 (2015)
2015
-
[55]
de’ Medici, X
L. de’ Medici, X. Wang, M. Capone, and A. J. Millis, Correlation strength, gaps, and particle-hole asymmetry in high-T c cuprates: A dynamical mean field study of the three-band copper-oxide model , Phys. Rev. B80, 054501 (2009)
2009
-
[56]
Jurkutat, D
M. Jurkutat, D. Rybicki, O. P. Sushkov, G. V. M. Williams, A. Erb, and J. Haase, Distribution of electrons and holes in cuprate superconductors as determined from 17O and 63Cu nuclear magnetic resonance, Phys. Rev. B 90, 140504 (2014)
2014
-
[57]
Bergeron and A.-M
D. Bergeron and A.-M. S. Tremblay, Algorithms for opti- mized maximum entropy and diagnostic tools for analytic continuation, Phys. Rev. E94, 023303 (2016)
2016
-
[58]
Lange, L
H. Lange, L. Qiu, R. Groth, A. von Haaren, L. Mus- carella, T. Franz, I. Bloch, F. Grusdt, P. M. Preiss, and A. Bohrdt, Realizing the Emery Model in Optical Lat- tices for Quantum Simulation of Cuprates and Nickelates (2026), arXiv:2603.11037 [cond-mat.quant-gas]
2026
-
[59]
McCabe, J
C. McCabe, J. Boyd, K. Wang, M. Lebrat, C. Regal, A. Kaufman, A. M. Rey, and L. Homeier, Realizing multi-orbital Emery models with ultracold atoms (2026), arXiv:2604.22955 [cond-mat.quant-gas]
2026 arXiv
-
[60]
N. D. Mermin and H. Wagner, Absence of Ferro- magnetism or Antiferromagnetism in One- or Two- Dimensional Isotropic Heisenberg Models, Phys. Rev. Lett.17, 1133 (1966)
1966
-
[61]
Z.-H. Cui, C. Sun, U. Ray, B.-X. Zheng, Q. Sun, and G. K.-L. Chan, Ground-state phase diagram of the three- band Hubbard model from density matrix embedding theory, Phys. Rev. Res.2, 043259 (2020)
2020
-
[62]
Ponsioen, S
B. Ponsioen, S. S. Chung, and P. Corboz, Superconduct- ing stripes in the hole-doped three-band Hubbard model, Phys. Rev. B108, 205154 (2023)
2023
-
[63]
Fratino, P
L. Fratino, P. S´ emon, G. Sordi, and A.-M. S. Tremblay, An organizing principle for two-dimensional strongly cor- related superconductivity, Sci. Rep.6, 22715 (2016)
2016
-
[64]
R. T. Scalettar, D. J. Scalapino, R. L. Sugar, and S. R. White, Antiferromagnetic, charge-transfer, and pairing correlations in the three-band Hubbard model, Phys. Rev. B44, 770 (1991)
1991
-
[65]
S. R. White and D. J. Scalapino, Doping asymmetry and striping in a three-orbital CuO 2 Hubbard model, Phys. Rev. B92, 205112 (2015). 17
2015
-
[66]
Y. F. Kung, C.-C. Chen, Y. Wang, E. W. Huang, E. A. Nowadnick, B. Moritz, R. T. Scalettar, S. Johnston, and T. P. Devereaux, Characterizing the three-orbital Hub- bard model with determinant quantum Monte Carlo, Phys. Rev. B93, 155166 (2016)
2016
-
[67]
Peng and M
Y. Peng and M. Jiang, Interplay between Hubbard in- teraction and charge transfer energy in the three-orbital Emery model: Implications for cuprates and nickelates, Phys. Rev. B112, 235147 (2025)
2025
-
[68]
Polat and E
G. Polat and E. Jeckelmann, Pairing and charge distri- bution in emery ladders preserving the ratio of cu to o atoms (2026), arXiv:2603.10755 [cond-mat.str-el]
2026
-
[69]
Sordi, P
G. Sordi, P. S´ emon, K. Haule, and A.-M. S. Trem- blay, Strong Coupling Superconductivity, Pseudogap, and Mott Transition, Phys. Rev. Lett.108, 216401 (2012)
2012
-
[70]
E. Gull, O. Parcollet, and A. J. Millis, Superconductiv- ity and the pseudogap in the two-dimensional hubbard model, Phys. Rev. Lett.110, 216405 (2013)
2013
-
[71]
M. Qin, T. Sch¨ afer, S. Andergassen, P. Corboz, and E. Gull, The Hubbard Model: A Computational Per- spective, Annual Review of Condensed Matter Physics 13, 275 (2022)
2022
-
[72]
Sordi, E
G. Sordi, E. M. O’Callaghan, C. Walsh, M. Charlebois, P. S´ emon, and A.-M. S. Tremblay, Dynamics of Supercon- ducting Pairs in the Two-Dimensional Hubbard Model, Phys. Rev. Lett.136, 256503 (2026)
2026
-
[73]
M. Xu, L. H. Kendrick, A. Kale, Y. Gang, C. Feng, S. Zhang, A. W. Young, M. Lebrat, and M. Greiner, A neutral-atom Hubbard quantum simulator in the cryo- genic regime, Nature642, 909–915 (2025)
2025
Reviewed July 8, 2026 · model on record in the stance chip above.
Discussion (0). Continue with ORCID to comment.