REVIEW 3 major objections 6 minor 61 references
Probabilistic Projections of Baseline 21st Century CO$_2$ Emissions Using a Simple Calibrated Integrated Assessment Model
T0 review · 3 major / 6 minor · reviewed 2026-08-14 · deepseek-v4-flash
Pith's one-line read The paper argues that SSP5-RCP8.5 is a below-1% tail risk, not a baseline.
desk verdict Careful Bayesian calibration that makes a strong, conditional case that SSP5-RCP8.5 is a tail risk; the quantitative anchor is weakened by an untested saturating-TFP structure. read the letter →
The pith
A machine-rendered reading of the paper's core claim, the machinery that carries it, and where it could break.
The reading
What carries the argument
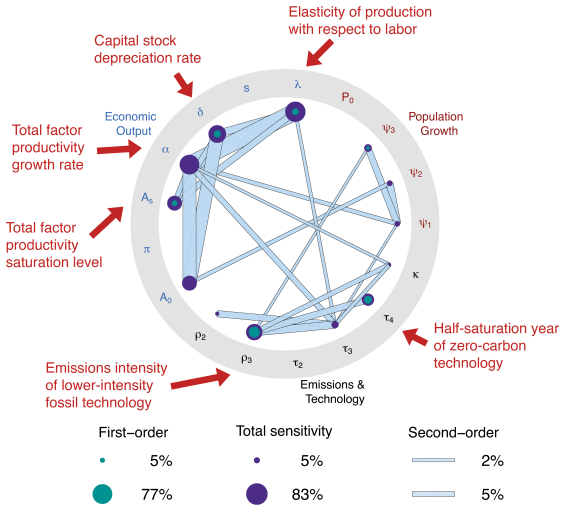
The machinery is a simple, globally aggregated integrated assessment model that couples logistic population growth, a Solow–Swan/Cobb–Douglas production block, and emissions from four competing technologies with logistic penetration curves: a zero-carbon pre-industrial source, a coal-like high-carbon source, an oil-and-gas-like lower-carbon source, and an advanced zero-carbon source. Two structural assumptions carry the conclusions: total factor productivity grows logistically toward a saturation level, which keeps long-run growth near 1.2% per year, and a hard cap on cumulative fossil-fuel emissions (6,000 GtC in the standard case, with 3,000 and 10,000 GtC variants) forces eventual substitution to zero-carbon technology. The model is calibrated by Markov chain Monte Carlo with a vector-autoregressive error structure, and the prior distributions incorporate two expert assessments of long-run growth and 2100 emissions. The same machinery yields both the probabilistic emissions projections and a Sobol' variance decomposition showing that interactions among productivity growth, the labor elasticity, and the carbon intensity of the lower-carbon fossil technology dominate emissions uncertainty.
What would settle it
Track realized global per-capita gross world product growth and annual CO2 emissions over 2021–2040 and compare them with the model's 90% credible intervals. If average growth consistently exceeds the projected upper bound (roughly 2% per year) or if cumulative emissions drift above the interval's upper edge, the calibrated TFP-saturation mechanism is contradicted, and the below-1% tail probability for SSP5-RCP8.5 would not hold.
Extended reading notes
Core claim
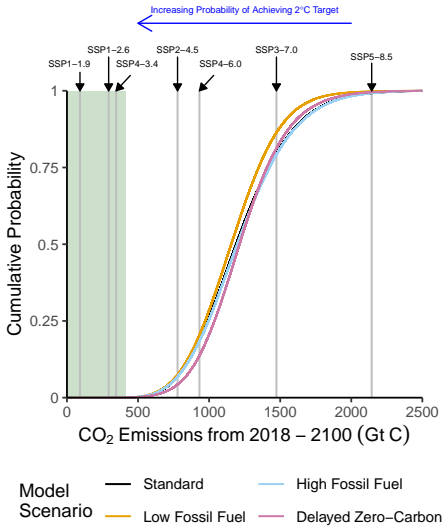
The study's central discovery is a probabilistic ranking of SSP-RCP emissions scenarios conditional on current policies and no negative-emissions technologies. In the standard calibration the central 90% interval for annual CO2 emissions in 2100 is 6–28 GtC, and the 34 GtC emissions of SSP5-RCP8.5 sit above that upper limit; its cumulative emissions of about 2,100 GtC are exceeded by fewer than 1% of posterior simulations. The median cumulative projection is roughly 1,200 GtC, and the likely range is 700–1,800 GtC across the standard and high-fossil-fuel cases. The driver of SSP5-RCP8.5's tail status is primarily the model's modest median economic growth of about 1.2% per year, lower than the inverted expert-growth assessment and SSP5's own assumptions. The result is robust to varying fossil-fuel resource caps and decarbonization priors, though delayed zero-carbon penetration thickens the upper tail.
Load-bearing premise
The load-bearing premise is that long-run innovation slows as total factor productivity approaches a saturation ceiling, so median economic growth stays near 1.2% per year; if innovation does not saturate, the probability assigned to very high emissions could be materially larger.
Editorial extensions
If this is right
- If the projections are right, intermediate-high scenarios such as SSP3-7.0 and SSP4-6.0 are better baselines than SSP5-RCP8.5 for climate risk assessment.
- Achieving even a 50% chance of meeting the 2°C target is very unlikely under baseline emissions, because the remaining carbon budgets for 1.5°C and 2°C are below the 1st percentile of projected cumulative emissions.
- Fossil-fuel resource uncertainty shifts the projections modestly; even the high-resource case does not bring SSP5-RCP8.5 inside the likely range.
- Population uncertainty contributes little to cumulative-emissions variability, while economic and technology uncertainties dominate, with strong interactions among them.
- More aggressive mitigation than current pledges is required to reliably achieve the 2°C Paris Agreement target.
Reading between the lines
- If autonomous productivity growth turns out not to saturate, for example because automation keeps shifting the technological frontier, the model's low-growth prior may be too pessimistic, and the probability attached to SSP5-RCP8.5 could rise well above 1%; this is a direct, testable implication of the structural assumption.
- Because the model disallows coal from regaining energy share, it may understate how quickly emissions could rise if coal became cheap again; adding an explicit coal-return mechanism would be a robustness test of the tail-risk claim.
- The same calibration framework could be rerun as new policies are implemented, so the baseline and the tail status of high scenarios should be treated as an evolving standard rather than a fixed result.
Signed reviews
Editorial analysis
A structured set of objections, weighed in public.
Referee Report
Summary. The paper calibrates a simple, DICE-like integrated assessment model with globally aggregated population, Solow-Swan economic growth, and a four-technology emissions module to historical observations (1820-2014) and two expert assessments, then produces probabilistic baseline CO2 emissions projections through 2100. Four scenarios vary fossil fuel resource caps (3,000/6,000/10,000 GtC) and prior beliefs about the zero-carbon technology half-saturation year. The central findings are that medium-to-high SSP scenarios (SSP3-7.0, SSP4-6.0) fall within the central 90% prediction intervals, that SSP5-RCP8.5 cumulative emissions (~2,100 GtC) have a posterior exceedance probability below 1% and should be interpreted as a tail-risk scenario, that likely cumulative emissions from 2018-2100 are 700-1,800 GtC, and that economic and technology dynamics dominate sensitivity of cumulative emissions, with population dynamics less important.
Significance. If the quantitative claims hold, the paper makes a valuable, decision-relevant contribution by providing probabilistic baselines for 21st-century CO2 emissions and by explicitly situating SSP scenarios within those distributions. The statistical treatment is careful: a VAR(1) residual structure, explicit likelihood derivation, four-chain MCMC with Gelman-Rubin diagnostics, k-fold cross-validation with 93% coverage, and variance-based Sobol sensitivity analysis with bootstrap confidence intervals are all strengths. The paper's simple, transparent model structure and explicit scenario analysis make it a useful reference point for risk assessments. However, the central quantitative claim--that SSP5-RCP8.5 has a below-1% exceedance probability--is conditional on a structural assumption about saturating total factor productivity that is weakly identified by historical data, and the abstract overstates support regarding the low end of the scenario distribution. The paper is therefore significant but requires additional structural robustness analysis before its headline quantitative claim can be accepted as stated.
major comments (3)
- [Section 3 and Supplemental Sections S1, S4] The below-1% exceedance probability for SSP5-RCP8.5 cumulative emissions is driven primarily by the model's relatively low economic growth projections, which in turn are driven by the saturating total factor productivity (TFP) equation A_t = A_{t-1} + alpha*A_{t-1}*(1 - A_{t-1}/A_s) (Section S1). The paper itself notes in Section S4 that some parameters used in the alternate-prior testing were 'not updated by the Bayesian inversion,' and Table S1 shows wide priors on alpha and A_s. Over the 1820-2014 calibration window the system is far from TFP saturation, so the data are nearly uninformative about A_s, leaving the low-growth projection (median roughly 1.2% per year) heavily dependent on the assumed saturating functional form. The alternate-prior analysis in Table S3 and Figure S1 changes prior shapes but does not test structurally different TFP dynamics, even though Section 4 explicitly lists trend breaks in TFP growth as a relevant extension. A non-saturating or trend-breaking TFP process could materially shift the upper tail of cumulative emissions and hence the stated <1% exceedance probability. The qualitative ordering of SSP scenarios may survive, but the precise quantitative tail-risk claim is conditional on an untested structural assumption. Please demonstrate robustness under structurally alternative TFP specifications or revise the probability claims to reflect this conditioning.
- [Abstract and Section 2] The abstract claims that 'more moderate scenarios used by the Intergovernmental Panel on Climate Change are more likely than the extreme high or low scenarios,' but Section 2 explicitly states that the model cannot compare with SSP1-1.9, SSP2-2.6, and SSP4-3.4 because those scenarios include negative emissions technologies, which are not represented in the model. The analysis therefore provides no quantitative support for statements about the low end of the scenario distribution; it can only support comparisons among the high and medium scenarios that are actually evaluated. The abstract should be revised to align with the scenarios actually analyzed.
- [Section 3, Figure 2] The text states that SSP5-RCP8.5 'remains exceptionally unlikely ... with an exceedance probability below 1%,' but the numerical exceedance probability is not reported anywhere in the main text or supplement. Figure 2 shows cumulative density functions, but precise values cannot be read from the figure, especially for tails below 1%. Please report the estimated exceedance probabilities (and, if possible, posterior credible intervals for those probabilities) for all four model scenarios in a table so that the central quantitative claim is directly verifiable.
minor comments (6)
- [Section S2] The sentence 'The average cross-validation coverage of the 90% credible intervals for the held-out data are 93' appears truncated; it should read 'are 93%.' Please also report the standard error or range across the fifty hold-out sets.
- [Figure 1 caption] The phrase 'The marker baseline SSP-RCP emissions scenarios which will be used...' likely should be 'The marked baseline SSP-RCP emissions scenarios...' or 'The markers show baseline SSP-RCP emissions scenarios...' for clarity.
- [Section 3] The sentence 'Depending on the scenario, however, the 90% credible interval of our projections can include anywhere from 78-85% of the SSP5-RCP8.5 cumulative emissions depending on the scenario' is ambiguous: it is unclear whether the 78-85% refers to the share of the scenario's cumulative emissions that falls inside the interval or the probability mass of the interval overlapping the scenario value. Please clarify.
- [Table S1] The prior table lists separate normal priors for rho2 and rho3 with the same bounds, but the text in Section S1 states the constraint rho2 >= rho3 is imposed. The table and text should make clear how the constraint is incorporated in the prior specification.
- [Table S2] The observation error variance for emissions is labeled 'epsilon1' in the table, duplicating the label for population; it should be labeled 'epsilon3' (or similar) to be consistent with the three-module notation.
- [General] No data or code availability statement is provided in the manuscript. Given the paper's emphasis on transparency and reproducibility, a statement indicating where the data and code (if available) can be accessed would strengthen the contribution.
Circularity Check
No load-bearing circularity; the <1% SSP5 exceedance claim is a calibrated model output, and the one self-cited expert assessment is shown to fatten, not force, the upper tail.
full rationale
The derivation chain is self-contained. The posterior predictive distribution for cumulative CO2 emissions is produced by calibrating a three-module IAM (population, Solow-Swan growth with saturating TFP, and logistic technology substitution) to century-scale observations via a VAR(1) likelihood, with priors listed in Supplemental Tables S1-S3. The central quantitative claim, that SSP5-RCP8.5 cumulative emissions (~2,100 GtC) have an exceedance probability below 1%, is an output of this posterior, not a parameter fitted to that scenario. The paper explicitly attributes the low probability to its relatively low economic growth projections ('This is primarily due to our lower projections of economic growth compared to both the inverted economic-growth expert assessment and the SSP5-8.5 scenario'), and the low growth follows from the saturating TFP equation adopted from Nordhaus and Yohe (1983) with priors on alpha and A_s; this is an externally cited, stated structural assumption rather than an equation that defines the target probability in terms of itself. The only overlapping-authorship citation is Ho et al. (2019), where Klaus Keller is a co-author; the paper uses it as an expert-assessment prior and reports that including it increases the size of the tail extending past RCP 8.5 (Supplemental Figure S6), so this prior does not produce the sub-1% exceedance result. Alternate priors and expert-assessment exclusions preserve the qualitative ordering, and the paper reports cross-validation coverage. Concerns about whether saturating TFP is the correct structural model, and whether alternative TFP dynamics would shift the tail, are correctness and robustness risks rather than circularity, because the target probability is not definitionally linked to the assumed TFP form.
Assumptions & free parameters
free parameters (7)
- alpha (TFP growth rate) =
Posterior distribution via MCMC; point estimate not stated in text
- A_s (TFP saturation level) =
Posterior distribution; uniform prior 5.3-16.11
- lambda (elasticity of production w.r.t. labor) =
Posterior distribution; normal prior 0.6-0.8
- delta (capital depreciation rate) =
Posterior distribution; uniform prior 0.01-0.14
- tau_4 (zero-carbon half-saturation year) =
Posterior distribution; prior truncated normal with mode 2100
- rho_3 (carbon intensity of technology 3) =
Posterior distribution; normal prior 0-0.75 kgC/2011US$
- kappa (technology penetration rate) =
Posterior distribution; uniform 0.005-0.2
assumptions (6)
- domain assumption Cobb-Douglas production function with constant savings rate in a Solow-Swan growth model
- domain assumption Total factor productivity grows logistically toward a saturation level (Nordhaus-Yohe)
- domain assumption Technology penetration follows logistic curves with a common rate kappa
- ad hoc to paper Fossil fuel resource constraints are fixed caps; simulated emissions exceeding the cap get zero likelihood
- domain assumption Expert assessments (Christensen et al. 2018, Ho et al. 2019) are used as informative priors
- standard math VAR(1) residual process for observation errors
Cite this review
Pith. "Pith review of Probabilistic Projections of Baseline 21st Century CO$_2$ Emissions Using a Simple Calibrated Integrated Assessment Model." pith.science (2026). https://pith.science/paper/7DDAKENL
@misc{pith2026190801923,
  author       = {Pith},
  title        = {Pith review of: Probabilistic Projections of Baseline 21st Century CO$_2$ Emissions Using a Simple Calibrated Integrated Assessment Model},
  year         = {2026},
  howpublished = {\url{https://pith.science/paper/7DDAKENL}},
  note         = {Machine review of arXiv:1908.01923}
}
read the original abstract
Probabilistic projections of baseline (with no additional mitigation policies) future carbon emissions are important for sound climate risk assessments. Deep uncertainty surrounds many drivers of projected emissions. Here we use a simple integrated assessment model, calibrated to century-scale data and expert assessments of baseline emissions, global economic growth, and population growth, to make probabilistic projections of carbon emissions through 2100. Under a variety of assumptions about fossil fuel resource levels and decarbonization rates, our projections largely agree with several emissions projections under current policy conditions. Our global sensitivity analysis identifies several key economic drivers of uncertainty in future emissions and shows important higher-level interactions between economic and technological parameters, while population uncertainties are less important. Our analysis also projects relatively low global economic growth rates over the remainder of the century. This illustrates the importance of additional research into economic growth dynamics for climate risk assessment, especially if pledged and future climate mitigation policies are weakened or have delayed implementations. These results showcase the power of using a simple, transparent, and calibrated model. While the simple model structure has several advantages, it also creates caveats for our results which are related to important areas for further research.
Figures

Reference graph
Works this paper leans on
-
[1]
J Econ Perspect 33(2):3--30, doi:10.1257/jep.33.2.3
Acemoglu D, Restrepo P (2019) Automation and new tasks: How technology displaces and reinstates labor. J Econ Perspect 33(2):3--30, doi:10.1257/jep.33.2.3
-
[2]
Boden TA, Andres RJ, Marland G (2017) Global, regional, and national Fossil-Fuel CO2 emissions (1751 - 2014) (v. 2017). doi:10.3334/CDIAC/00001\_V2017
-
[3]
Bolt J, Inklaar R, de Jong H, van Zanden JL (2018) Maddison project database, version 2018. Title of the publication associated with this dataset: Rebasing 'Maddison': New income comparisons and the shape of long-run economic development
work page 2018
-
[4]
Bruckner T, Bashmakov IA, Mulugetta Y, Chum H, De la Vega Navarro A, Edmonds J, Faaij A, Fungtammasan B, Garg A, Hertwich E, Honnery D, Infield D, Kainuma M, Khennas S, Kim S, Nimir HB, Riahi K, Strachan N, Wiser R, Zhang X (2014) Energy systems. In: Edenhofer O, Pichs-Madruga R, Sokona Y, Farahani E, Kadner S, Seyboth K, Adler A, Baum I, Brunner S, Eicke...
work page 2014
-
[5]
Environ Res Lett 16(1):014016, doi:10.1088/1748-9326/abcdd2
Burgess MG, Ritchie J, Shapland J, Pielke R (2020) IPCC baseline scenarios have over-projected CO2 emissions and economic growth. Environ Res Lett 16(1):014016, doi:10.1088/1748-9326/abcdd2
-
[6]
Energy Environ Sci 9(8):2482--2496, doi:10.1039/C6EE01008C
Capell \'a n-P \'e rez I, Arto I, Polanco-Mart \' nez JM, Gonz \'a lez-Eguino M, Neumann MB (2016) Likelihood of climate change pathways under uncertainty on fossil fuel resource availability. Energy Environ Sci 9(8):2482--2496, doi:10.1039/C6EE01008C
-
[7]
Proc Natl Acad Sci U S A 115(21):5409--5414, doi:10.1073/pnas.1713628115
Christensen P, Gillingham K, Nordhaus W (2018) Uncertainty in forecasts of long-run economic growth. Proc Natl Acad Sci U S A 115(21):5409--5414, doi:10.1073/pnas.1713628115
-
[8]
Nat Clim Chang 4:850, doi:10.1038/nclimate2392
Fuss S, Canadell JG, Peters GP, Tavoni M, Andrew RM, Ciais P, Jackson RB, Jones CD, Kraxner F, Nakicenovic N, Le Qu \'e r \'e C, Raupach MR, Sharifi A, Smith P, Yamagata Y (2014) Betting on negative emissions. Nat Clim Chang 4:850, doi:10.1038/nclimate2392
Show all 61 references
-
[9]
Energies
Gambhir A, Drouet L, McCollum D, Napp T, Bernie D, others (2017) Assessing the feasibility of global long-term mitigation scenarios. Energies
2017
-
[10]
Science 346(6206):234--237, doi:10.1126/science.1257469
Gerland P, Raftery AE, Sev c \' kov \'a H, Li N, Gu D, Spoorenberg T, Alkema L, Fosdick BK, Chunn J, Lalic N, Bay G, Buettner T, Heilig GK, Wilmoth J (2014) World population stabilization unlikely this century. Science 346(6206):234--237, doi:10.1126/science.1257469
2014 doi
-
[11]
Nature 577:618--620
Hausfather Z, Peters GP (2020) Emissions -- the `business as usual' story is misleading. Nature 577:618--620
2020
-
[12]
Clim Change 155(4):545--561, doi:10.1007/s10584-019-02500-y
Ho E, Budescu DV, Bosetti V, van Vuuren DP, Keller K (2019) Not all carbon dioxide emission scenarios are equally likely: a subjective expert assessment. Clim Change 155(4):545--561, doi:10.1007/s10584-019-02500-y
2019 doi
-
[13]
Cambridge University Press, Cambridge, UK
IPCC (2014) Climate Change 2014: Mitigation of Climate Change. Cambridge University Press, Cambridge, UK
2014
-
[14]
J Clim 26(13):4398--4413, doi:10.1175/JCLI-D-12-00554.1
Jones C, Robertson E, Arora V, Friedlingstein P, Shevliakova E, Bopp L, Brovkin V, Hajima T, Kato E, Kawamiya M, Liddicoat S, Lindsay K, Reick CH, Roelandt C, Segschneider J, Tjiputra J (2013) Twenty-First-Century compatible CO2 emissions and airborne fraction simulated by CMI...
2013 doi
-
[15]
Wiley Interdiscip Rev Clim Change 1(5):729--740
Kwadijk JCJ, Haasnoot M, Mulder JPM, Hoogvliet MMC, Jeuken ABM, van der Krogt RAA, van Oostrom NGC, Schelfhout HA, van Velzen EH, van Waveren H, Others (2010) Using adaptation tipping points to prepare for climate change and sea level rise: a case study in the netherlands. Wil...
2010
-
[16]
Communications Earth & Environment 2(1):29, doi:10.1038/s43247-021-00097-8
Liu PR, Raftery AE (2021) Country-based rate of emissions reductions should increase by 80\ target. Communications Earth & Environment 2(1):29, doi:10.1038/s43247-021-00097-8
2021 doi
-
[17]
Clim Change 108(4):675, doi:10.1007/s10584-011-0178-6
Mastrandrea MD, Mach KJ, Plattner GK, Edenhofer O, Stocker TF, Field CB, Ebi KL, Matschoss PR (2011) The IPCC AR5 guidance note on consistent treatment of uncertainties: a common approach across the working groups. Clim Change 108(4):675, doi:10.1007/s10584-011-0178-6
2011 doi
-
[18]
Nature 517(7533):187--190, doi:10.1038/nature14016
McGlade C, Ekins P (2015) The geographical distribution of fossil fuels unused when limiting global warming to 2 °c. Nature 517(7533):187--190, doi:10.1038/nature14016
2015 doi
-
[19]
Energy 59:116--125, doi:10.1016/j.energy.2013.05.031
McGlade C, Speirs J, Sorrell S (2013) Methods of estimating shale gas resources -- comparison, evaluation and implications. Energy 59:116--125, doi:10.1016/j.energy.2013.05.031
2013 doi
-
[20]
Energy 47(1):262--270, doi:10.1016/j.energy.2012.07.048
McGlade CE (2012) A review of the uncertainties in estimates of global oil resources. Energy 47(1):262--270, doi:10.1016/j.energy.2012.07.048
2012 doi
-
[21]
Clim Change 90(3):189--215, doi:10.1007/s10584-008-9458-1
Morgan MG, Keith DW (2008) Improving the way we think about projecting future energy use and emissions of carbon dioxide. Clim Change 90(3):189--215, doi:10.1007/s10584-008-9458-1
2008 doi
-
[22]
Nordhaus W, Sztorc P (2013) DICE 2013R: Introduction and User's Manual
2013
-
[23]
Science 258(5086):1315--1319, doi:10.1126/science.258.5086.1315
Nordhaus WD (1992) An optimal transition path for controlling greenhouse gases. Science 258(5086):1315--1319, doi:10.1126/science.258.5086.1315
1992
-
[24]
Proc Natl Acad Sci U S A 114(7):1518--1523, doi:10.1073/pnas.1609244114
Nordhaus WD (2017) Revisiting the social cost of carbon. Proc Natl Acad Sci U S A 114(7):1518--1523, doi:10.1073/pnas.1609244114
2017 doi
-
[25]
Clim Change 122(3):387--400, doi:10.1007/s10584-013-0905-2
O'Neill BC, Kriegler E, Riahi K, Ebi KL, Hallegatte S, Carter TR, Mathur R, van Vuuren DP (2014) A new scenario framework for climate change research: the concept of shared socioeconomic pathways. Clim Change 122(3):387--400, doi:10.1007/s10584-013-0905-2
2014 doi
-
[26]
Geoscientific Model Development 9(9):3461--3482, doi:10.5194/gmd-9-3461-2016
O'Neill BC, Tebaldi C, van Vuuren DP, Eyring V, Friedlingstein P, Hurtt G, Knutti R, Kriegler E, Lamarque JF, Lowe J, Meehl GA, Moss R, Riahi K, Sanderson BM (2016) The scenario model intercomparison project ( ScenarioMIP ) for CMIP6 . Geoscientific Model Development 9(9):3461...
2016 doi
-
[27]
Nat Clim Chang 7:637, doi:10.1038/nclimate3352
Raftery AE, Zimmer A, Frierson DMW, Startz R, Liu P (2017) Less than 2 °c warming by 2100 unlikely. Nat Clim Chang 7:637, doi:10.1038/nclimate3352
2017 doi
-
[28]
Glob Environ Change 42:153--168, doi:10.1016/j.gloenvcha.2016.05.009
Riahi K, van Vuuren DP, Kriegler E, Edmonds J, O'Neill BC, Fujimori S, Bauer N, Calvin K, Dellink R, Fricko O, Lutz W, Popp A, Cuaresma JC, Kc S, Leimbach M, Jiang L, Kram T, Rao S, Emmerling J, Ebi K, Hasegawa T, Havlik P, Humpen \"o der F, Da Silva LA, Smith S, Stehfest E, B...
2017
-
[29]
Ritchie J, Dowlatabadi H (2017 a ) The 1000 GtC coal question: Are cases of vastly expanded future coal combustion still plausible? Energy Econ 65:16--31, doi:10.1016/j.eneco.2017.04.015
2017 doi
-
[30]
Ritchie J, Dowlatabadi H (2017 b ) Why do climate change scenarios return to coal? Energy 140:1276--1291, doi:10.1016/j.energy.2017.08.083
2017 doi
-
[31]
Nature 534(7609):631--639, doi:10.1038/nature18307
Rogelj J, den Elzen M, H \"o hne N, Fransen T, Fekete H, Winkler H, Schaeffer R, Sha F, Riahi K, Meinshausen M (2016) Paris agreement climate proposals need a boost to keep warming well below 2 °c. Nature 534(7609):631--639, doi:10.1038/nature18307
2016 doi
-
[32]
Nat Clim Chang 8(4):325--332, doi:10.1038/s41558-018-0091-3
Rogelj J, Popp A, Calvin KV, Luderer G, Emmerling J, Gernaat D, Fujimori S, Strefler J, Hasegawa T, Marangoni G, Krey V, Kriegler E, Riahi K, van Vuuren DP, Doelman J, Drouet L, Edmonds J, Fricko O, Harmsen M, Havl \' k P, Humpen \"o der F, Stehfest E, Tavoni M (2018 a ) Scena...
2018 doi
-
[33]
Rogelj J, Shindell D, Jiang K, Fifita S, Forster P, Ginzburg V, Handa C, Kheshgi H, Kobayashi S, Kriegler E, Mundaca L, S \'e f \'e rian R, Vilari \ n o MV (2018 b ) Mitigation pathways compatible with 1.5°c in the context of sustainable development. In: Masson-Delmotte V, Zha...
2018
-
[34]
Annu Rev Energy Environ 22(1):217--262, doi:10.1146/annurev.energy.22.1.217
Rogner HH (1997) An assessment of world hydrocarbon resources. Annu Rev Energy Environ 22(1):217--262, doi:10.1146/annurev.energy.22.1.217
1997 doi
-
[35]
Nat Clim Chang 6:42, doi:10.1038/nclimate2870
Smith P, Davis SJ, Creutzig F, Fuss S, Minx J, Gabrielle B, Kato E, Jackson RB, Cowie A, Kriegler E, van Vuuren DP, Rogelj J, Ciais P, Milne J, Canadell JG, McCollum D, Peters G, Andrew R, Krey V, Shrestha G, Friedlingstein P, Gasser T, Gr \"u bler A, Heidug WK, Jonas M, Jones...
2015
-
[36]
Mathematical Modeling and Computational Experiment 1(4):407--414
Sobol' IM (1993) Sensitivity estimates for nonlinear mathematical models. Mathematical Modeling and Computational Experiment 1(4):407--414
1993
-
[37]
Math Comput Simul 55(1):271--280, doi:10.1016/S0378-4754(00)00270-6
Sobol' IM (2001) Global sensitivity indices for nonlinear mathematical models and their monte carlo estimates. Math Comput Simul 55(1):271--280, doi:10.1016/S0378-4754(00)00270-6
2001 doi
-
[38]
United Nations Department of Economic and Social Affairs Population Division (2019) World population prospects 2019 highlights. Tech. Rep. ST/ESA/SER.A/423, United Nations
2019
-
[39]
Environ Res Lett 11(9):095003, doi:10.1088/1748-9326/11/9/095003
Vaughan NE, Gough C (2016) Expert assessment concludes negative emissions scenarios may not deliver. Environ Res Lett 11(9):095003, doi:10.1088/1748-9326/11/9/095003
2016 doi
-
[40]
Science 293(5529):451--454, doi:10.1126/science.1061604
Wigley TM, Raper SC (2001) Interpretation of high projections for global-mean warming. Science 293(5529):451--454, doi:10.1126/science.1061604
2001 doi
-
[41]
Energy Policy 23(4):411--416, doi:10.1016/0301-4215(95)90166-5
Ausubel JH (1995) Technical progress and climatic change. Energy Policy 23(4):411--416, doi:10.1016/0301-4215(95)90166-5
1995 doi
-
[42]
Philosophical Transactions of the Royal Society of London 53:370--418
Bayes T (1763) An essay towards solving a problem in the doctrine of chance. Philosophical Transactions of the Royal Society of London 53:370--418
-
[43]
Science 269(5222):341--346, doi:10.1126/science.7618100
Cohen JE (1995) Population growth and earth's human carrying capacity. Science 269(5222):341--346, doi:10.1126/science.7618100
1995 doi
-
[44]
Stat Sci 7(4):457--511, doi:10.1214/ss/1177011136
Gelman A, Rubin DB (1992) Inference from iterative simulation using multiple simulations. Stat Sci 7(4):457--511, doi:10.1214/ss/1177011136
1992
-
[45]
Technol Forecast Soc Change 39(1):159--180, doi:10.1016/0040-1625(91)90034-D
Gr \"u bler A (1991) Diffusion: Long-term patterns and discontinuities. Technol Forecast Soc Change 39(1):159--180, doi:10.1016/0040-1625(91)90034-D
1991 doi
-
[46]
Energy Policy 27(5):247--280, doi:10.1016/S0301-4215(98)00067-6
Gr \"u bler A, Naki \'c enovi \'c N, Victor DG (1999) Dynamics of energy technologies and global change. Energy Policy 27(5):247--280, doi:10.1016/S0301-4215(98)00067-6
1999 doi
-
[47]
Biometrika 57(1):97--109, doi:10.2307/2334940
Hastings WK (1970) Monte carlo sampling methods using markov chains and their applications. Biometrika 57(1):97--109, doi:10.2307/2334940
1970 doi
-
[48]
Nature 387(6635):803--805, doi:10.1038/42935
Lutz W, Sanderson W, Scherbov S (1997) Doubling of world population unlikely. Nature 387(6635):803--805, doi:10.1038/42935
1997 doi
-
[49]
Nature 412(6846):543--545, doi:10.1038/35087589
Lutz W, Sanderson W, Scherbov S (2001) The end of world population growth. Nature 412(6846):543--545, doi:10.1038/35087589
2001 doi
-
[50]
OECD, doi:10.1787/9789264104143-en
Maddison A (2003) The World Economy. OECD, doi:10.1787/9789264104143-en
2003 doi
-
[51]
Technol Forecast Soc Change 10(4):345--356, doi:10.1016/0040-1625(77)90031-2
Marchetti C (1977) Primary energy substitution models: On the interaction between energy and society. Technol Forecast Soc Change 10(4):345--356, doi:10.1016/0040-1625(77)90031-2
1977 doi
-
[52]
J Chem Phys 21(6):1087--1092, doi:10.1063/1.1699114
Metropolis N, Rosenbluth AW, Rosenbluth MN, Teller AH, Teller E (1953) Equation of state calculations by fast computing machines. J Chem Phys 21(6):1087--1092, doi:10.1063/1.1699114
1953 doi
-
[53]
total manufacturing sector
Nadiri MI, Prucha IR (1996) Estimation of the depreciation rate of physical and R&D capital in the U.S. total manufacturing sector. Econ Inq 34(1):43--56, doi:10.1111/j.1465-7295.1996.tb01363.x
1996
-
[54]
MIT Press, Cambridge, Mass
Nordhaus WD (1994) Managing the global commons : the economics of climate change. MIT Press, Cambridge, Mass
1994
-
[55]
In: National Research Council (ed) Changing Climate: Report of the Carbon Dioxide Assessment Committee, The National Academies Press, Washington, DC, pp 87--153, doi:10.17226/18714
Nordhaus WD, Yohe GW (1983) Future carbon dioxide emissions from fossil fuels. In: National Research Council (ed) Changing Climate: Report of the Carbon Dioxide Assessment Committee, The National Academies Press, Washington, DC, pp 87--153, doi:10.17226/18714
1983 doi
-
[56]
Romer D (2012) Advanced Macroeconomics, fourth ed. edn. McGraw-Hill/Irwin, New York
2012
-
[57]
Clim Change 61(3):261--293, doi:10.1023/B:CLIM.0000004577.17928.fa
Ruddiman WF (2003) The anthropogenic greenhouse era began thousands of years ago. Clim Change 61(3):261--293, doi:10.1023/B:CLIM.0000004577.17928.fa
2003
-
[58]
design and estimator for the total sensitivity index
Saltelli A, Annoni P, Azzini I, Campolongo F, Ratto M, Tarantola S (2010) Variance based sensitivity analysis of model output. design and estimator for the total sensitivity index. Comput Phys Commun 181(2):259--270, doi:10.1016/j.cpc.2009.09.018
2010 doi
-
[59]
Science 182(4110):358--364, doi:10.1126/science.182.4110.358
Starr C, Rudman R (1973) Parameters of technological growth. Science 182(4110):358--364, doi:10.1126/science.182.4110.358
1973 doi
-
[60]
World Bank (2018) Gross savings (\ https://data.worldbank.org/indicator/ny.gns.ictr.zs?end=2017&start=1960&view=chart, accessed: 2019-5-15
2018
-
[61]
https://data.worldbank.org/indicator/sl.tlf.cact.zs, accessed: 2019-5-15
World Bank (2019) Labor force participation rate, total (\ population ages 15+). https://data.worldbank.org/indicator/sl.tlf.cact.zs, accessed: 2019-5-15
2019
Reviewed August 14, 2026 · model on record in the stance chip above.
Discussion (0). Continue with ORCID to comment.