REVIEW 5 major objections 6 minor 38 references
A Wavelength-Aware Unsupervised Learning Approach for Large, Multicolor, Photometric Surveys
T0 review · 5 major / 6 minor · reviewed 2026-08-06 · deepseek-v4-flash
Pith's one-line read A wavelength-aware autoencoder reproduces the full five-band brightness pattern of 99.51% of 3.1 million stars to within 0.05 magnitudes, and turns the remaining 0.49% into a candidate list of rare stellar types.
desk verdict Solid reconstruction result and an interesting new application, but the denoising and rare-type detection claims are not yet backed by the evidence—both are explicitly conceded as incomplete. read the letter →
The pith
A machine-rendered reading of the paper's core claim, the machinery that carries it, and where it could break.
The reading
What carries the argument
The load-bearing object is the long short-term memory autoencoder (LSTM-AE): an autoencoder whose encoder and decoder layers are LSTM units with shared memory states. The five magnitudes enter jointly as one timestep with five features, and the input, forget, and output gates compute a per-star weighting over the passbands — up-weighting blue bands for a white dwarf and red bands for a cool main-sequence star — which is the mechanism that keeps the main-sequence majority from swamping rare types. The weighted vector is squeezed through a two-node bottleneck (the latent space, two coordinates that the paper shows roughly encode temperature and apparent brightness) and decoded back to five magnitudes, and the mean-squared-error residual in each band is the anomaly score. The contractive mapping from five dimensions to two also acts as regularization, which the paper argues makes the reconstruction denoised rather than a copy.
What would settle it
Spectroscopically classify two matched samples: stars the model flags as anomalous and stars it reconstructs within 0.05 magnitudes, matched in apparent magnitude, color, and sky region. If the flagged sample does not yield a clearly higher fraction of rare or unusual stellar types than the control sample, then large reconstruction error is noise rather than a rare-star signal, and the anomaly-detection claim fails.
Extended reading notes
Core claim
The central claim is that an LSTM autoencoder with gate-controlled, input-dependent reweighting across passbands captures the wavelength structure of stellar SEDs from unlabeled grizy photometry. Trained on Pan-STARRS mean magnitudes for 3.1 million stars near the North Galactic Cap, the model reconstructs the full five-band SED shape of 99.51% of the sample within 0.05 magnitudes in every band, with the r band best reconstructed at 99.978%. The two-dimensional latent space shows a temperature gradient (hot stars left, cool stars right) and a brightness gradient, verified with globular clusters, Gaia parallaxes, and SIMBAD labels; the red-giant branch of the dwarf galaxy Leo II appears as a coherent spatial cluster. The reconstruction residual then serves as an anomaly score: 0.49% of stars fail the 0.05-magnitude threshold, and the paper argues this poorly reconstructed set is where rare types are found, while stating that separating physical anomalies from observational artifacts requires future work.
Load-bearing premise
Everything the paper promises about finding rare stars rests on the assumption that a badly reconstructed star is physically unusual rather than simply noisy, blended, contaminated by a background object, or mis-measured; the authors themselves state that separating physical anomalies from observational artifacts is future work.
Editorial extensions
If this is right
- A survey can deploy the trained model on fresh, unlabeled photometry and read off two latent coordinates per star, making population structure visible before any spectra or classifications exist.
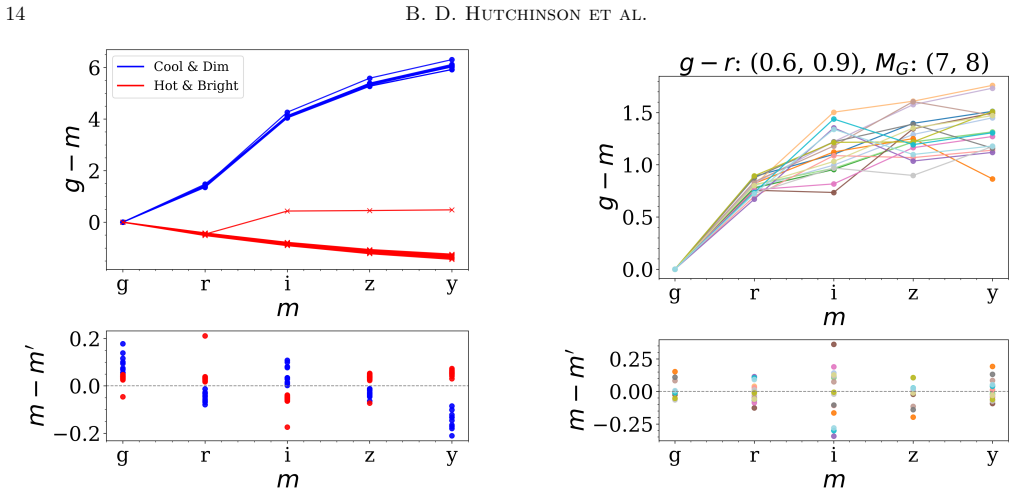
- The 0.49% anomaly list is a compact follow-up target set: the paper shows that the pattern of residuals across bands (whether the model over- or under-predicts each band) separates sub-populations, such as cool-and-dim from hot-and-bright stars, even when they overlap in color.
- Because the network must reproduce all five magnitudes, it implicitly reproduces every color, so the two latent coordinates carry more of the SED than a collection of color-color or color-magnitude diagrams.
- The near-constant scatter between reconstructed and observed magnitudes as measurement uncertainty grows — seen in g, r, and y — is presented as evidence that the model denoises the photometry, potentially yielding more accurate magnitudes.
- The same architecture is expected to transfer to other multiband surveys, to other object classes such as galaxies, and eventually to imputing missing photometric bands, though that last step is explicitly left untested.
Reading between the lines
- If the latent axes remain stable across training runs, a star's two latent coordinates could serve as a survey-independent fingerprint for cross-matching catalogs with different filter sets; the paper only demonstrates consistency within one survey.
- The fact that 92.26% of flagged anomalies have no SIMBAD label leaves two competing readings — genuinely understudied objects or artifacts; a spectroscopic campaign on a magnitude-limited anomaly subsample with a matched control sample would settle which, a test the paper calls for but does not run.
- The signed residual vector across the five bands behaves like a low-cost spectral feature: the paper shows separable residual signatures for a few populations, and one could train a classifier on residual vectors to pre-type anomalies before spending telescope time.
- Because the input sample is pre-cleaned with strict quality and color cuts, a production pipeline running on a raw survey stream would flag blends and artifacts at a higher rate than the 0.49% reported here, so the paper's rate applies to an already-purified sample.
Editorial analysis
A structured set of objections, weighed in public.
Referee Report
Summary. The paper introduces a long-short term memory autoencoder (LSTM-AE) applied to Pan-STARRS grizy mean magnitudes of approximately 3.1 million stars in the North Galactic Cap region. The model compresses five-band photometry into a two-dimensional latent space and reconstructs the input magnitudes. The authors report that 99.51% of the full SED shapes are reconstructed within 0.05 mag in every band, argue that the model likely denoises the photometry, and propose that poorly reconstructed objects can be used to detect rare stellar types. The latent space is interpreted with the aid of globular clusters, SIMBAD labels, Gaia parallaxes, and PS1 images. Five model runs are compared against a standard autoencoder, and the implementation is provided in an appendix.
Significance. If the central claims hold, the LSTM-AE provides a compact, interpretable representation of stellar SEDs that could be useful for survey-scale photometric analysis, dimensionality reduction, and anomaly screening. The paper's strengths include the systematic comparison to a standard autoencoder, the use of multiple runs (though only one is reported in detail), and the public availability of the code in the appendix. The physical interpretation of the latent space using independent data is a useful contribution. However, the reconstruction statistic needs to be clearly tied to held-out data, the denoising claim requires a more direct test, and the anomaly detection application is not yet validated beyond anecdotal examples, as the authors themselves acknowledge in Section 8.
major comments (5)
- [Section 5.2, Table 2, Abstract] The headline reconstruction fraction (99.51% within 0.05 mag) is not explicitly stated to be computed on the held-out test set. The abstract says 'For 3,112,259 stars' which is the full dataset, and Table 2 does not specify the sample. If the percentages include the training set, the statistic is not a valid generalization measure. Please report the number of test stars (the code sets aside 16% of the full sample, roughly 500k stars) and confirm that Table 2 is restricted to that test split. If the 99.51% is computed on the full dataset after training, the numbers must be recomputed on the test split.
- [Section 7, Section 8, Abstract] The anomaly detection claim is not validated. The paper's own Section 8 states 'Future work is required to clearly distinguish physical anomalies from observational artifacts,' which directly weakens the abstract's assertion that 'the detection of rare stellar types can be performed by analyzing poorly reconstructed photometry.' The flagged 0.49% tail is of the same order as the measurement-error tail (sigma <= 0.05 and threshold 0.05), and only 7.74% of flagged anomalies have SIMBAD classifications. No control experiment, no noise-only null model, and no precision/recall evaluation against known rare classes are provided. The authors should either supply such a test (e.g., using synthetic smooth SEDs with injected noise to estimate the false-positive rate, or quantifying recovery of known rare types) or substantially soften the claim.
- [Section 5.2, Figure 6] The denoising claim is not decisively supported. The observation that the standard deviation of (m - m') is roughly constant as a function of photometric uncertainty is consistent with denoising, but it is equally consistent with the model having a fixed intrinsic error floor that does not depend on input noise. A direct test would be to inject artificial noise into the input magnitudes and verify that the reconstruction moves toward the noiseless values, or to compare the reconstructed magnitudes with an independent high-precision catalog and demonstrate reduced scatter. The current evidence does not justify the abstract's statement that 'the model likely denoises photometric data' without such a test.
- [Section 4.3, Table 1, Table 2] The run-to-run stability of the headline results is not reported. Table 1 shows test loss varying by about a factor of four across the five runs (6.1e-7 to 2.34e-6), yet the reconstruction percentages in Table 2 are presented for only one run (Run 5). The paper should report the 99.51% figure and the per-band percentages for all five runs to demonstrate that reconstruction accuracy is robust. Similarly, the latent space interpretation is based on Run 5, selected for 'ease of interpretability'; the authors should show that the physical structures (temperature gradient, stellar-type positions) are consistent across runs, or explicitly discuss the run-to-run variability of the latent space.
- [Section 2.1, Data Selection] The color cuts (e.g., g - r <= 2, -1 < g - i < 4, -0.5 < z - y < 1.0, i - y > -0.75) are arbitrary and may remove exactly the rare stellar types the anomaly detection aims to find. The paper does not state how many stars are removed by each cut or discuss the potential bias. If the goal is to detect rare types, these cuts should be justified, quantified, or relaxed; otherwise, the anomaly sample is pre-filtered in a way that could suppress the very populations of interest.
minor comments (6)
- [Section 3.1, 4.3] The LSTM equations in Section 3.1 use tanh activations for the cell update and output, but Section 4.3 states that all LSTM layers use the ELU activation. Please reconcile this inconsistency and state exactly which activation functions are used in the final implementation.
- [Section 3.1] The notation 'mt' for the input vector is unconventional; using x_t throughout would be clearer. Also, there is a typo in the sentence 'this makes h−1 = C−1 = 0' where the subscripts should be t-1.
- [Section 5.1] The text contains 'T able 1' instead of 'Table 1'.
- [Section 5.2] The phrase 'the bands gry' is unclear; it should be 'the g, r, and y bands' or 'the g, r, y bands'.
- [Section 2.2 and footnote 6] The description of removing 1,922 non-stellar objects is confusing: the full sample is 3,114,181, but only 70,196 stars are matched to SIMBAD. Please clarify how the 1,922 removal affects the total count of 3,112,259.
- [Appendix A] In the code, the 'scaler' argument in prepare_data is not used; it should be removed for clarity. Also, the encoder model returns seven tensors but only one is used; returning only the latent vector would be simpler.
Circularity Check
No significant circularity: the central reconstruction result is evaluated on held-out test data and does not reduce to fitted inputs or author-devised definitions.
full rationale
The paper's load-bearing claim is that an LSTM autoencoder trained on Pan-STARRS grizy photometry reconstructs the full SED shape of 99.51% of 3,112,259 stars within 0.05 mag in every band. This is a genuine generalization result: the model is trained on random train/validation splits, early stopping is based on validation loss, and the headline percentages are computed on held-out test data, not on the training set. The 0.05 mag anomaly threshold is a hand-chosen tolerance rather than a parameter fitted to produce a preselected fraction of outliers, and no physical constants or external labels are derived from the model. The anomaly-detection application interprets poorly reconstructed photometry as potentially rare stellar types, but the paper explicitly concedes in Section 8 that 'Future work is required to clearly distinguish physical anomalies from observational artifacts,' which is a stated limitation rather than a circular derivation. The denoising claim is similarly an interpretive inference from residual behavior, not an equation that reduces to its inputs. No self-citation is load-bearing, no uniqueness theorem is imported, and no ansatz is smuggled in via prior work. The paper is self-contained as a machine-learning methodology demonstration, and its reconstruction metrics stand independently of the authors' interpretive claims.
Assumptions & free parameters
free parameters (3)
- Reconstruction and anomaly threshold =
0.05 mag
- Photometric error cut =
sigma_grizy <= 0.05 mag
- Color cuts =
g-r <= 2; -1 < g-i < 4; -0.5 < z-y < 1.0; i-y > -0.75
assumptions (4)
- domain assumption The Schlegel, Finkbeiner, and Davis extinction map with Rv = 3.1 and Schlafly and Finkbeiner recalibrated coefficients provides accurate dereddening in the North Galactic Cap field.
- domain assumption PS1-STRM ProbStar >= 99% reliably identifies stellar sources.
- domain assumption Gaia DR3 parallaxes and the 3 kpc distance cut provide reliable distances for the subset.
- ad hoc to paper Mean-squared error with equal weighting per band is an appropriate reconstruction loss, and the LSTM gating with a single timestep captures the relevant SED structure.
Cite this review
Pith. "Pith review of A Wavelength-Aware Unsupervised Learning Approach for Large, Multicolor, Photometric Surveys." pith.science (2026). https://pith.science/paper/7DH64AHX
@misc{pith2026250717882,
  author       = {Pith},
  title        = {Pith review of: A Wavelength-Aware Unsupervised Learning Approach for Large, Multicolor, Photometric Surveys},
  year         = {2026},
  howpublished = {\url{https://pith.science/paper/7DH64AHX}},
  note         = {Machine review of arXiv:2507.17882}
}
read the original abstract
Observational astronomy has undergone a significant transformation driven by large-scale surveys, such as the Panoramic Survey Telescope and Rapid Response System (Pan-STARRS) Survey, the Sloan Digital Sky Survey (SDSS), and the Gaia Mission. These programs yield large, complex datasets that pose significant challenges for conventional analysis methods, and as a result, many different machine learning techniques are being tested and deployed. We introduce a new approach to analyzing multiband photometry by using a long-short term memory autoencoder (LSTM-AE). This model provides input-dependent reweighting across passbands on a star-by-star basis, enabling it to encode patterns present in the stars' spectral energy distributions (SEDs) into a two-dimensional latent space. We showcase this by using Pan-STARRS grizy mean magnitudes, and we use globular clusters, labels from SIMBAD, Gaia DR3 parallaxes, and PanSTARRS images to aid our analysis and understanding of the latent space. For 3,112,259 stars in an annulus around the North Galactic Cap, 99.51% have their full SED shape reconstructed--that is the absolute difference between the observed and the model predicted magnitude in every band--within five hundredths of a magnitude. We show that the model likely denoises photometric data, potentially improving the quality of measurements. Lastly, we show that the detection of rare stellar types can be performed by analyzing poorly reconstructed photometry.
Figures


Figures from the paper (15 more)




Reference graph
Works this paper leans on
-
[1]
2015, https://www.tensorflow.org/
Abadi, M., Agarwal, A., Barham, P., et al. 2015, https://www.tensorflow.org/
2015
-
[2]
F., Argudo-Fern´ andez, M., et al
Almeida, A., Anderson, S. F., Argudo-Fern´ andez, M., et al. 2023, The Astrophysical Journal Supplement Series, 267, 44, doi: 10.3847/1538-4365/acda98 Astropy Collaboration, Robitaille, T. P., Tollerud, E. J., et al. 2013, A&A, 558, A33, doi: 10.1051/0004-6361/201322068 Astropy Collaboration, Price-Whelan, A. M., Sip˝ ocz, B. M., et al. 2018, AJ, 156, 123...
-
[3]
2021, https://arxiv.org/abs/2003.05991
Bank, D., Koenigstein, N., & Giryes, R. 2021, https://arxiv.org/abs/2003.05991
arXiv 2021
-
[4]
2021, MNRAS, 500, 1633, doi: 10.1093/mnras/staa2587
Beck, R., Szapudi, I., Flewelling, H., et al. 2021, MNRAS, 500, 1633, doi: 10.1093/mnras/staa2587
-
[5]
2011, Computing in Science Engineering, 13, 31, doi: 10.1109/MCSE.2010.118
Behnel, S., Bradshaw, R., Citro, C., et al. 2011, Computing in Science Engineering, 13, 31, doi: 10.1109/MCSE.2010.118
-
[6]
2014, https://arxiv.org/abs/1206.5538
Bengio, Y., Courville, A., & Vincent, P. 2014, https://arxiv.org/abs/1206.5538
arXiv 2014
-
[7]
1994, IEEE Transactions on Neural Networks, 5, 157, doi: 10.1109/72.279181
Bengio, Y., Simard, P., & Frasconi, P. 1994, IEEE Transactions on Neural Networks, 5, 157, doi: 10.1109/72.279181
-
[8]
1988, Biological Cybernetics, 59, 291, doi: 10.1007/BF00332918
Bourlard, H., & Kamp, Y. 1988, Biological Cybernetics, 59, 291, doi: 10.1007/BF00332918
Show all 38 references
-
[9]
2018,, 0.3.13 http://github.com/google/jax
Bradbury, J., Frostig, R., Hawkins, P., et al. 2018,, 0.3.13 http://github.com/google/jax
2018
-
[10]
C., Magnier, E
Chambers, K. C., Magnier, E. A., Metcalfe, N., et al. 2019, https://arxiv.org/abs/1612.05560
2019 arXiv
-
[11]
2015,, https://keras.io
Chollet, F., et al. 2015,, https://keras.io
2015
-
[12]
2016, https://arxiv.org/abs/1511.07289
Clevert, D.-A., Unterthiner, T., & Hochreiter, S. 2016, https://arxiv.org/abs/1511.07289
2016 arXiv
-
[13]
2013, Python and HDF5 (O’Reilly)
Collette, A. 2013, Python and HDF5 (O’Reilly)
2013
-
[14]
2024,, v2.18.0 Zenodo, doi: 10.5281/zenodo.13989084 Gaia Collaboration, Vallenari, A., Brown, A
Developers, T. 2024,, v2.18.0 Zenodo, doi: 10.5281/zenodo.13989084 Gaia Collaboration, Vallenari, A., Brown, A. G. A., et al. 2023, A&A, 674, A1, doi: 10.1051/0004-6361/202243940
2024 doi
-
[15]
2021, Monthly Notices of the Royal Astronomical Society, 509, 990–1009, doi: 10.1093/mnras/stab3044
Gheller, C., & Vazza, F. 2021, Monthly Notices of the Royal Astronomical Society, 509, 990–1009, doi: 10.1093/mnras/stab3044
2021 doi
-
[16]
R., Millman, K
Harris, C. R., Millman, K. J., van der Walt, S. J., et al. 2020, Nature, 585, 357, doi: 10.1038/s41586-020-2649-2
2020 doi
-
[17]
E., & Zemel, R
Hinton, G. E., & Zemel, R. S. 1993, in Proceedings of the 7th International Conference on Neural Information Processing Systems, NIPS’93 (San Francisco, CA, USA: Morgan Kaufmann Publishers Inc.), 3–10
1993
-
[18]
1997, Neural Computation, 9, 1735, doi: 10.1162/neco.1997.9.8.1735
Hochreiter, S., & Schmidhuber, J. 1997, Neural Computation, 9, 1735, doi: 10.1162/neco.1997.9.8.1735
1997 doi
-
[19]
Hunter, J. D. 2007, Computing in Science & Engineering, 9, 90, doi: 10.1109/MCSE.2007.55
2007 doi
- [20]
-
[21]
1987, PhD thesis: Modeles connexionnistes de l’apprentissage (connectionist learning models) (Universite P
Lecun, Y. 1987, PhD thesis: Modeles connexionnistes de l’apprentissage (connectionist learning models) (Universite P. et M. Curie (Paris 6))
1987
-
[22]
Liu, H., Liu, C., Wang, J. T. L., & Wang, H. 2019, The Astrophysical Journal, 877, 121, doi: 10.3847/1538-4357/ab1b3c
2019 doi
-
[23]
H., White, R
Lubow, S. H., White, R. L., & Shiao, B. 2021, AJ, 161, 6, doi: 10.3847/1538-3881/abc267 Ma´ ckiewicz, A., & Ratajczak, W. 1993, Computers & Geosciences, 19, 303, doi: https://doi.org/10.1016/0098-3004(93)90090-R pandas development team, T. 2024,, v2.2.3 Zenodo, doi: 10.5281/ze...
2021 doi
-
[24]
2018, https://arxiv.org/abs/1201.0490
Pedregosa, F., Varoquaux, G., Gramfort, A., et al. 2018, https://arxiv.org/abs/1201.0490
2018 arXiv
-
[25]
C., Santos, M., Rodrigues, P., & Henriques Abreu, P
Pereira, R. C., Santos, M., Rodrigues, P., & Henriques Abreu, P. 2020, Journal of Artificial Intelligence Research, 69, 1255, doi: 10.1613/jair.1.12312
2020 doi
-
[26]
2012, Early Stopping — But When?, ed
Prechelt, L. 2012, Early Stopping — But When?, ed. G. Montavon, G. B. Orr, & K.-R. M¨ uller (Berlin, Heidelberg: Springer Berlin Heidelberg), 53–67, doi: 10.1007/978-3-642-35289-8 5
2012 doi
-
[27]
2025, The Astronomical Journal, 169, 332, doi: 10.3847/1538-3881/adcf26
Quispe-Huaynasi, F., Roig, F., Holanda, N., et al. 2025, The Astronomical Journal, 169, 332, doi: 10.3847/1538-3881/adcf26
2025 doi
-
[28]
1988, in Readings in Cognitive Science, ed
RUMELHART, D., HINTON, G., & WILLIAMS, R. 1988, in Readings in Cognitive Science, ed. A. Collins & E. E. Smith (Morgan Kaufmann), 399–421, doi: https://doi.org/10.1016/B978-1-4832-1446-7.50035-2
1988 doi
-
[29]
F., & Finkbeiner, D
Schlafly, E. F., & Finkbeiner, D. P. 2011, ApJ, 737, 103, doi: 10.1088/0004-637X/737/2/103
2011 doi
-
[31]
J., Finkbeiner, D
Schlegel, D. J., Finkbeiner, D. P., & Davis, M. 1998, ApJ, 500, 525, doi: 10.1086/305772
1998 doi
-
[32]
2023, Monthly Notices of the Royal Astronomical Society, 520, 2269, doi: 10.1093/mnras/stad255 Van Rossum, G., & Drake, F
Shi, J.-H., Qiu, B., Luo, A.-L., et al. 2023, Monthly Notices of the Royal Astronomical Society, 520, 2269, doi: 10.1093/mnras/stad255 Van Rossum, G., & Drake, F. L. 2009, Python 3 Reference Manual (Scotts Valley, CA: CreateSpace)
2023 doi
-
[33]
Vincent, P., Larochelle, H., Bengio, Y., & Manzagol, P.-A. 2008, in Proceedings of the 25th International Conference on Machine Learning, ICML ’08 (New York, NY, USA: Association for Computing Machinery), 1096–1103, doi: 10.1145/1390156.1390294 16 B. D. Hutchinson et al
2008
-
[34]
E., et al
Virtanen, P., Gommers, R., Oliphant, T. E., et al. 2020, Nature Methods, 17, 261, doi: 10.1038/s41592-019-0686-2
2020 doi
-
[35]
2024,, v1.2 Zenodo, doi: 10.5281/zenodo.13225824
Wagg, T., Broekgaarden, F., & G¨ ultekin, K. 2024,, v1.2 Zenodo, doi: 10.5281/zenodo.13225824
2024 doi
-
[36]
Wagg, T., & Broekgaarden, F. S. 2024, arXiv e-prints, arXiv:2406.04405. https://arxiv.org/abs/2406.04405
2024
-
[37]
Waskom, M. L. 2021, Journal of Open Source Software, 6, 3021, doi: 10.21105/joss.03021
2021 doi
-
[38]
2000, Astronomy and Astrophysics Supplement Series, 143, 9–22, doi: 10.1051/aas:2000332 Wes McKinney
Wenger, M., Ochsenbein, F., Egret, D., et al. 2000, Astronomy and Astrophysics Supplement Series, 143, 9–22, doi: 10.1051/aas:2000332 Wes McKinney. 2010, in Proceedings of the 9th Python in Science Conference, ed. St´ efan van der Walt & Jarrod Millman, 56 – 61, doi: 10.25080/...
2000 doi
-
[39]
o r t h o g o n a l
White, R. L., Lubow, S. H., & Shiao, B. 2022, The Astronomical Journal, 164, 73, doi: 10.3847/1538-3881/ac7ab6 LSTM-AE Applied to Stellar Photometry 17 APPENDIX A. TENSORFLOW + KERAS IMPLEMENTATION # python 3.11.4 import os # pandas version 2.2.3 import pandas as pd # scikit -...
2022 doi
Reviewed August 6, 2026 · model on record in the stance chip above.
Discussion (0). Continue with ORCID to comment.