REVIEW 5 major objections 5 minor 1 cited by
The Samples and Binary Fractions of Red Supergiant in M31 and M33 by the HST Observations
T0 review · 5 major / 5 minor · reviewed 2026-08-07 · deepseek-v4-flash
Pith's one-line read This paper measures the binary fraction of red supergiants in M31 and M33 using HST photometry, finding about one third have hot companions, and shows HST resolves far more RSGs than ground-based surveys.
desk verdict Worth sending to review: solid HST-resolution RSG catalogs and a genuinely new M33 measurement, but 'binary fraction' overstates what the UV-excess method demonstrates. read the letter →
The pith
A machine-rendered reading of the paper's core claim, the machinery that carries it, and where it could break.
The reading
What carries the argument
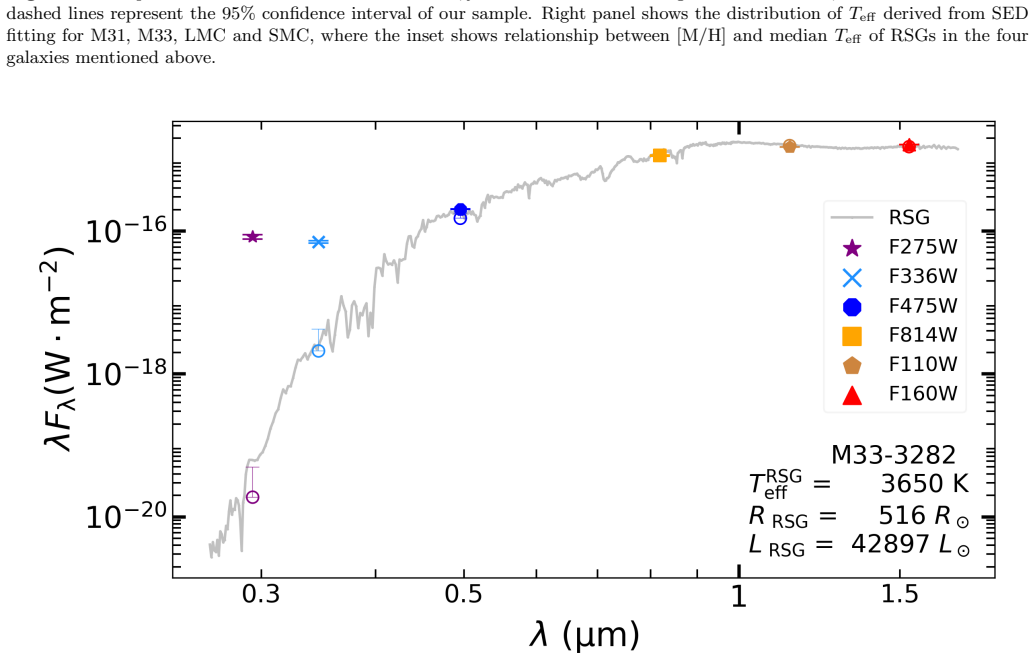
The identifying mechanism is the ultraviolet excess test. A star is declared a binary when its observed F275W or F336W flux exceeds the flux predicted by a single-red-supergiant model spectrum by more than 3$\sigma$ of the observational error plus 3$\sigma$ of the model uncertainty, where the model uncertainty accounts for surface gravity up to $\log g = 0.5$. Because red supergiants emit very weakly in the UV, any such excess is attributed to a hot main-sequence companion. Stellar parameters are obtained from SED fitting to the redder bands using the adopted model grid.
What would settle it
Measure radial velocities for a sample of RSGs classified as single in this work; if a large fraction show orbital motion with hot companions, the UV-excess method misses binaries, whereas if single-star RSGs show intrinsic UV variability or UV emission, the method overcounts. Alternatively, spatially resolve the UV emission of binary candidates with integral-field spectroscopy to confirm a genuine hot companion rather than scattered light.
Extended reading notes
Core claim
The central claim is that the binary fractions of red supergiants in M31 and M33 are about one third, obtained by applying a UV-excess SED-fitting method to HST-resolved samples. The paper reports 828 binary candidates among 2,481 usable RSGs in M31 and 966 among 3,129 in M33, yielding 33.4% ± 0.9% and 30.9% ± 0.8%. For RSGs with $\log L/L_{\odot} > 4.0$, the fractions are 31.6% ± 1.9% and 34.7% ± 1.8%. These observed fractions agree with BPASS predictions once binaries with low-luminosity main-sequence companions that would not yet be observable are removed from the model outputs.
Load-bearing premise
The method assumes red supergiants have negligible intrinsic ultraviolet emission, so that any UV excess must come from a hot companion; if RSG chromospheres or an underestimated model UV flux produce the excess, the binary fractions are overestimated.
Editorial extensions
If this is right
- About one in three red supergiants in M31 and M33 has a detectable hot companion, reshaping expectations for supernova progenitors that come from binary channels.
- HST-resolved samples contain substantially more RSGs than ground-based surveys (19% more in M31, 148% more in M33), implying previous RSG population counts in nearby spirals are incomplete.
- The observed binary fractions match BPASS predictions when low-luminosity companions are excluded, supporting current binary evolution models for post-main-sequence massive stars.
- The derived RSG physical parameters ($T_{\rm eff}$, $R$, and $L$) provide a sizable catalog for future studies of stellar evolution in M31 and M33.
- The lack of a metallicity trend in binary fractions across M31, M33, the LMC, and the SMC suggests the binary fraction is roughly independent of galaxy metallicity.
Reading between the lines
- The UV-excess method only detects companions hot enough to produce F275W or F336W flux; binaries with cool, low-mass companions are likely missed, so the true RSG binary fraction may be higher than the measured 31-33%.
- If the agreement with BPASS holds, the same method could be applied to other nearby galaxies with HST UV coverage to map the binary fraction as a function of environment without requiring spectroscopy.
- The M33 sample covers only the inner region, so the reported fraction may not represent the whole galaxy; combining with outer-region data could test whether the inner/outer gradient suggested by spectroscopic work persists.
Editorial analysis
A structured set of objections, weighed in public.
Referee Report
Summary. The paper presents new RSG samples in M31 and M33 constructed from HST PHAT/PHATTER photometry, derives Teff, radius, and luminosity for each star by fitting L97 single-star SEDs to optical and NIR bands, and identifies binary candidates by requiring a 3-sigma UV excess in F275W/F336W relative to the single-star model prediction. The reported binary fractions are 33.4% +/- 0.9% (828/2481) for M31 and 30.9% +/- 0.8% (966/3129) for M33, with 31.6% +/- 1.9% and 34.7% +/- 1.8% for the log L/L_sun > 4.0 subsamples. The paper also estimates total RSG populations of about 6,563 (M31) and 7,572 (M33), roughly 19% and 148% larger than ground-based counts by Ren et al. (2021), and claims good agreement with BPASS binary evolution predictions.
Significance. If the binary fractions are correct, this is a valuable empirical result: it is one of the largest homogeneous samples of RSG binaries in external galaxies, and the HST-based photometry provides a substantial improvement in resolution and completeness over ground-based surveys. The paper has clear strengths: strict photometric quality cuts, a multi-step foreground removal that combines color-color diagrams with Gaia astrometry, cross-checks against the Ren et al. (2021) catalog and Neugent (2021) spectroscopic classifications, machine-readable output tables, and a systematic extinction test in Section 4.4. The central measurement, however, currently rests on a UV-excess criterion whose false-positive rate is unquantified and whose relation to the total binary fraction is not established; the BPASS comparison is also partly constructed by the adopted selection filters. These issues are load-bearing for the headline numbers, so the paper requires revision before the claims are fully supported.
major comments (5)
- [Section 3.2, Eq. (10)] The model error term F_err_mod only includes the variation of log g from 0 to 0.5 (or 0.6 for Teff < 3500 K), while [M/H] is fixed a priori (+0.3 for M31, +0.1 for M33) and the Teff error is said to be smaller than the 50 K grid spacing without propagating systematic uncertainties from extinction and reddening. Because F275W and F336W lie on the steep Wien tail of the RSG spectrum, a plausible +/-0.2 dex change in [M/H] can alter the predicted UV flux by an amount comparable to or larger than the 3-sigma threshold in Eq. (9). The paper should either extend Eq. (10) to cover these systematics or validate Eq. (9) on a control sample of spectroscopically confirmed single RSGs, for instance the Neugent (2021) catalog; without one of these, the false-positive rate of the binary identification is unmeasured and the headline fractions may be biased.
- [Sections 3.2, 5, and abstract] Paper I (Dai et al. 2025) explicitly reported lower limits on the RSG binary fraction in the LMC and SMC using the same UV-excess method, because the method detects only binaries with hot, UV-luminous companions. The present paper drops the 'lower limit' qualifier and presents the values as 'the binary fraction.' Unless the authors demonstrate that the UV-excess selection is complete for all binary configurations that contribute to the RSG population, the numbers in the abstract should be restated as lower limits or as 'binary fractions of RSGs with detectable hot companions,' and the comparison with BPASS should be framed accordingly.
- [Section 4.5] The BPASS 'prediction' is filtered by the observed Teff range (Eqs. 12-13) and then restricted to companions with L >= 60.7 L_sun (a B9V star), which is a hand-chosen threshold. This selection makes the claimed 'good agreement' with the observed 31.6%/34.7% fractions partly a consequence of the filter rather than an independent test. Please justify the luminosity threshold, report the fraction of BPASS binaries that pass it, and show how the predicted fraction changes when the threshold is varied by, say, +/-0.5 dex in luminosity.
- [Section 4.4] The M31 binary fraction changes from 32.7% to 36.9% across the three extinction scenarios, a spread of about 4 percentage points, which is larger than the quoted statistical uncertainty of +/-0.9%. This systematic should be propagated into the final uncertainty or at least discussed in the abstract; as written, the +/-0.9% implies a precision that the method does not achieve.
- [Section 4.2] The total RSG population estimates (6,563 in M31, 7,572 in M33) are derived by scaling the HST sample using the Ren et al. (2021) coverage fractions of 39.8% and 43.5%. Those fractions were computed from the ground-based RSG sample; because the HST sample is substantially deeper (148% more RSGs in M33), the spatial distribution of the newly resolved faint RSGs may not follow the same pattern, which would bias the total estimates. Please recompute the coverage fractions using the HST sample or test the sensitivity of the totals to the adopted fraction.
minor comments (5)
- [Abstract] There is a missing conjunction or period between 'M31' and '3,294 RSGs' in the sentence describing the sample sizes.
- [Section 4.3] The sample sizes are inconsistent: the text states 584 RSGs in M31 and 735 in M33, but the fractions are computed with denominators 585 and 733, respectively. Please correct the numbers.
- [Figure 9] The caption says the comparison is 'in M31,' but the text and the surrounding analysis describe both M31 and M33; the caption should refer to both panels.
- [Eq. (5)] The reduced chi-square definition uses weights w(lambda_j) that depend on both the model and the observed flux; this is not the standard definition of chi-square and its statistical interpretation should be clarified.
- [Eqs. (1)-(3)] The RSG branch boundaries are described as visually determined; a sensitivity test (for example, shifting the boundaries by 0.05 mag) would help establish how robust the RSG sample is to the chosen borders.
Circularity Check
Binary fractions come from HST photometry and single-star SED fits, not from the BPASS model; the only mild concern is that the BPASS comparison is conditioned on the observed Teff range and an observability cut, but no fitted parameter is renamed as a prediction.
full rationale
The central measurement is self-contained: the RSG samples are selected from HST photometry, and the binary fractions are obtained by fitting L97 single-star SEDs to the F814W/F110W/F160W (plus F475W when needed) fluxes and counting objects whose F275W/F336W fluxes exceed the model by more than 3 sigma (Eq. 9). The model error in Eq. (10) is an astrophysical assumption about log g, not a circular reduction. The BPASS model is used only in Section 4.5 as an external comparison, not in the binary classification. The comparison is mildly conditioned: the BPASS subsample is restricted to the observed Teff ranges (Eqs. 12-13) and to companions with L/Lsun >= 60.7, described as the observable threshold, so the 'prediction' is not a fully blind a priori test. However, this does not make the observed binary fractions equivalent to the BPASS input by construction; the fractions are measured from HST data and would stand independently even if the BPASS comparison were removed. The self-citation to Paper I (Dai et al. 2025) for the SED-fitting method is not load-bearing because the essential equations are restated here. I therefore find no significant circularity; the score of 1 reflects the mild conditioning of the BPASS comparison rather than a definitional or fitted-input circularity.
Assumptions & free parameters
free parameters (4)
- [M/H] adopted in SED fitting =
0.3 dex (M31), 0.1 dex (M33)
- log g adopted for RSG models =
0 (0.28 for Teff < 3500 K)
- BPASS companion luminosity threshold =
L = 60.7 Lsun (B9V)
- BPASS Teff selection window =
3350-4050 K (M31); 3450-4100 K (M33)
assumptions (7)
- domain assumption RSGs emit very weakly in the UV band
- domain assumption L97 synthetic spectra and 50 K interpolation give reliable UV fluxes for RSG models with log g = 0 and fixed [M/H]
- ad hoc to paper The visual CMD boundaries (Eqs. 1-3 and Fig. 5) isolate a pure, complete RSG branch
- domain assumption TRGB (F160W = 18.271 M31, 18.572 M33) is the lower luminosity boundary of RSGs
- domain assumption SFD98-based extinction and the Wang & Chen (2019) law are appropriate; M31 internal extinction is negligible in the fiducial fit
- ad hoc to paper BPASS model selection (Eqs. 11-13) matches the observationally detectable binary population
- ad hoc to paper The Ren et al. (2021) coverage fractions (39.8% for M31, 43.5% for M33) correctly scale the HST sample to the whole galaxy
Cite this review
Pith. "Pith review of The Samples and Binary Fractions of Red Supergiant in M31 and M33 by the HST Observations." pith.science (2026). https://pith.science/paper/7IZZCDQC
@misc{pith2026250524559,
  author       = {Pith},
  title        = {Pith review of: The Samples and Binary Fractions of Red Supergiant in M31 and M33 by the HST Observations},
  year         = {2026},
  howpublished = {\url{https://pith.science/paper/7IZZCDQC}},
  note         = {Machine review of arXiv:2505.24559}
}
abstract
The binarity of red supergiants (RSGs) influences their evolution and the fate of supernovae. We investigate the binary fraction of RSGs in the Andromeda Galaxy (M31) and Triangulum Galaxy (M33) using photometry from the Hubble Space Telescope (HST), which offers high spatial resolution to resolve more RSGs. A preliminary step involves identifying a reliable and complete RSG sample using the F110W $-$ F160W versus F160W diagram, yielding 2,612 RSGs from the Panchromatic Hubble Andromeda Treasury (PHAT) survey of M31 3,294 RSGs from the Panchromatic Hubble Andromeda Treasury: Triangulum Extended Region (PHATTER) survey of M33. These samples suggest total RSG populations in M31 and M33 of 6,563 and 7,572, respectively. These estimates significantly exceed previous ones from the ground-based observations, an increase attributed to the superior spatial resolution of the HST. The stellar parameters of these RSGs, including effective temperature ($T_{\mathrm{eff}}$), radius ($R$), and luminosity ($L$), are derived by fitting their spectral energy distribution (SED) across optical and near-infrared bands. Binary candidates are identified by detecting ultraviolet (UV) excesses in their SEDs compared to the single-star RSG model prediction. The binary fraction is determined to be 33.4% $\pm$ 0.9% for M31 and 30.9% $\pm$ 0.8% for M33. For more luminous RSGs with log $L/L_{\odot} > 4.0$, the binary fraction decreases to 31.6% $\pm$ 1.9% in M31 and increases to 34.7% $\pm$ 1.8% in M33, respectively. These results are in good agreement with predictions from the BPASS binary evolution model.
Figures


Figures from the paper (11 more)




Forward citations
Cited by 1 Pith paper
-
Stellar evolution through the Red Supergiant phase
A comprehensive review of red supergiant stellar evolution, emphasizing mass loss as the critical open problem, with no new results.
Reference graph
Works this paper leans on
-
[1]
, " * write output.state after.block = add.period write newline
ENTRY address archivePrefix author booktitle chapter doi edition editor eprint howpublished institution journal key month number organization pages publisher school series title misctitle type volume year version url label extra.label sort.label short.list INTEGERS output.state before.all mid.sentence after.sentence after.block FUNCTION init.state.consts ...
-
[2]
write newline
" write newline "" before.all 'output.state := FUNCTION format.url url empty "" new.block "" url * "" * if FUNCTION format.eprint eprint empty "" archivePrefix empty "" archivePrefix "arXiv" = new.block " " eprint * " " * new.block " " eprint * " " * if if if FUNCTION format.doi doi empty "" " " doi * " " * if FUNCTION format.pid doi empty eprint empty ur...
-
[3]
/6: ( 9
thebibliography [1] 20pt to REFERENCES 6pt =0pt -12pt 10pt plus 3pt =0pt =0pt =1pt plus 1pt =0pt =0pt -12pt =13pt plus 1pt =20pt =13pt plus 1pt \@M =10000 =-1.0em =0pt =0pt 0pt =0pt =1.0em @enumiv\@empty 10000 10000 `\.\@m \@noitemerr \@latex@warning Empty `thebibliography' environment \@ifnextchar \@reference \@latexerr Missing key on reference command E...
2021
-
[4]
Astropy Collaboration , Price-Whelan , A. M., Lim , P. L., et al. 2022, , 935, 167, 10.3847/1538-4357/ac7c74
-
[5]
Bianchi , L., Efremova , B., Hodge , P., Massey , P., & Olsen , K. A. G. 2012, , 143, 74, 10.1088/0004-6256/143/3/74
-
[6]
2025, , 539, 1220, 10.1093/mnras/staf560
Dai , M., Wang , S., & Jiang , B. 2025, , 539, 1220, 10.1093/mnras/staf560
-
[7]
Dorda , R., & Patrick , L. R. 2021, , 502, 4890, 10.1093/mnras/stab303
-
[8]
Dunstall , P. R., Dufton , P. L., Sana , H., et al. 2015, , 580, A93, 10.1051/0004-6361/201526192
Show all 56 references
-
[9]
J., Xiao , L., Stanway , E
Eldridge , J. J., Xiao , L., Stanway , E. R., Rodrigues , N., & Guo , N. Y. 2018, , 35, e049, 10.1017/pasa.2018.47
2018 doi
-
[10]
2005, , 117, 1411, 10.1086/497385
Fabricant , D., Fata , R., Roll , J., et al. 2005, , 117, 1411, 10.1086/497385
2005 doi
-
[11]
Gies , D. R. 2008, in Astronomical Society of the Pacific Conference Series, Vol. 387, Massive Star Formation: Observations Confront Theory, ed. H. Beuther , H. Linz , & T. Henning , 93
2008
-
[12]
2018, , 156, 278, 10.3847/1538-3881/aaeacb
G \'o rski , M., Pietrzy \'n ski , G., Gieren , W., et al. 2018, , 156, 278, 10.3847/1538-3881/aaeacb
2018 doi
-
[13]
H., Meynet , G., Georgy , C., & Ekstr \"o m , S
Groh , J. H., Meynet , G., Georgy , C., & Ekstr \"o m , S. 2013, , 558, A131, 10.1051/0004-6361/201321906
2013 doi
-
[14]
Hunter, J. D. 2007, Computing in Science & Engineering, 9, 90, 10.1109/MCSE.2007.55
2007 doi
-
[15]
1997, , 125, 229, 10.1051/aas:1997373
Lejeune , T., Cuisinier , F., & Buser , R. 1997, , 125, 229, 10.1051/aas:1997373
1997 doi
-
[16]
Levesque , E. M. 2017, Astrophysics of Red Supergiants , 10.1088/978-0-7503-1329-2
2017 doi
-
[17]
2023, , 613, 460, 10.1038/s41586-022-05488-1
Li , J., Liu , C., Zhang , Z.-Y., et al. 2023, , 613, 460, 10.1038/s41586-022-05488-1
2023 doi
-
[18]
2024, , 167, 123, 10.3847/1538-3881/ad23e8
Li , Y., Jiang , B., & Ren , Y. 2024, , 167, 123, 10.3847/1538-3881/ad23e8
2024 doi
-
[19]
2025 a , arXiv e-prints, arXiv:2504.18779
---. 2025 a , arXiv e-prints, arXiv:2504.18779. 2504.18779
2025 arXiv
-
[20]
2025 b , , 979, 208, 10.3847/1538-4357/ada1d4
Li , Z.-w., Yang , M., Jiang , B., & Ren , Y. 2025 b , , 979, 208, 10.3847/1538-4357/ada1d4
2025 doi
-
[21]
M., Mampaso , A., Corradi , R
Magrini , L., V \' lchez , J. M., Mampaso , A., Corradi , R. L. M., & Leisy , P. 2007, , 470, 865, 10.1051/0004-6361:20077445
2007 doi
-
[22]
Massey , P., & Evans , K. A. 2016, , 826, 224, 10.3847/0004-637X/826/2/224
2016 doi
-
[23]
R., Levesque , E
Massey , P., Silva , D. R., Levesque , E. M., et al. 2009, , 703, 420, 10.1088/0004-637X/703/1/420
2009 doi
-
[24]
McConnachie , A. W. 2012, , 144, 4, 10.1088/0004-6256/144/1/4
2012 doi
-
[25]
W., Irwin , M
McConnachie , A. W., Irwin , M. J., Ferguson , A. M. N., et al. 2005, , 356, 979, 10.1111/j.1365-2966.2004.08514.x
2005
-
[26]
Neugent , K. F. 2021, , 908, 87, 10.3847/1538-4357/abd47b
2021 doi
-
[27]
F., Levesque , E
Neugent , K. F., Levesque , E. M., & Massey , P. 2018, , 156, 225, 10.3847/1538-3881/aae4e0
2018 doi
-
[28]
F., Levesque , E
Neugent , K. F., Levesque , E. M., Massey , P., Morrell , N. I., & Drout , M. R. 2020, , 900, 118, 10.3847/1538-4357/ababaa
2020 doi
-
[29]
R., Thilker , D., Lennon , D
Patrick , L. R., Thilker , D., Lennon , D. J., et al. 2022, , 513, 5847, 10.1093/mnras/stac1139
2022 doi
-
[30]
R., Lennon , D
Patrick , L. R., Lennon , D. J., Britavskiy , N., et al. 2019, , 624, A129, 10.1051/0004-6361/201834951
2019 doi
-
[31]
R., Lennon , D
Patrick , L. R., Lennon , D. J., Evans , C. J., et al. 2020, , 635, A29, 10.1051/0004-6361/201936741
2020 doi
-
[32]
J., & Mamajek , E
Pecaut , M. J., & Mamajek , E. E. 2013, , 208, 9, 10.1088/0067-0049/208/1/9
2013 doi
-
[33]
2011, Journal of Machine Learning Research, 12, 2825
Pedregosa, F., Varoquaux, G., Gramfort, A., et al. 2011, Journal of Machine Learning Research, 12, 2825
2011
-
[34]
2021, , 907, 18, 10.3847/1538-4357/abcda5
Ren , Y., Jiang , B., Yang , M., et al. 2021, , 907, 18, 10.3847/1538-4357/abcda5
2021 doi
-
[35]
E., de Koter , A., et al
Sana , H., de Mink , S. E., de Koter , A., et al. 2012, Science, 337, 444, 10.1126/science.1223344
2012 doi
-
[36]
E., et al
Sana , H., de Koter , A., de Mink , S. E., et al. 2013, , 550, A107, 10.1051/0004-6361/201219621
2013 doi
-
[37]
F., & Finkbeiner , D
Schlafly , E. F., & Finkbeiner , D. P. 2011, , 737, 103, 10.1088/0004-637X/737/2/103
2011 doi
-
[38]
J., Finkbeiner , D
Schlegel , D. J., Finkbeiner , D. P., & Davis , M. 1998, , 500, 525, 10.1086/305772
1998 doi
- [39]
-
[40]
2022, , 665, A148, 10.1051/0004-6361/202244245
Shenar , T., Sana , H., Mahy , L., et al. 2022, , 665, A148, 10.1051/0004-6361/202244245
2022 doi
-
[41]
R., & Eldridge , J
Stanway , E. R., & Eldridge , J. J. 2018, , 479, 75, 10.1093/mnras/sty1353
2018 doi
-
[42]
Taylor , M. B. 2005, in Astronomical Society of the Pacific Conference Series, Vol. 347, Astronomical Data Analysis Software and Systems XIV, ed. P. Shopbell , M. Britton , & R. Ebert , 29
2005
-
[43]
2019, , 877, 116, 10.3847/1538-4357/ab1c61
Wang , S., & Chen , X. 2019, , 877, 116, 10.3847/1538-4357/ab1c61
2019 doi
- [44]
-
[45]
2021, , 912, 112, 10.3847/1538-4357/abed4b
Wang , T., Jiang , B., Ren , Y., Yang , M., & Li , J. 2021, , 912, 112, 10.3847/1538-4357/abed4b
2021 doi
-
[46]
2010, in P roceedings of the 9th P ython in S cience C onference, ed
W es M c K inney. 2010, in P roceedings of the 9th P ython in S cience C onference, ed. S t\'efan van der W alt & J arrod M illman, 56 -- 61, 10.25080/Majora-92bf1922-00a
2010 doi
-
[47]
F., Lang , D., Dalcanton , J
Williams , B. F., Lang , D., Dalcanton , J. J., et al. 2014, , 215, 9, 10.1088/0067-0049/215/1/9
2014 doi
-
[48]
F., Durbin , M
Williams , B. F., Durbin , M. J., Dalcanton , J. J., et al. 2021, , 253, 53, 10.3847/1538-4365/abdf4e
2021 doi
-
[49]
F., Durbin , M., Lang , D., et al
Williams , B. F., Durbin , M., Lang , D., et al. 2023, , 268, 48, 10.3847/1538-4365/acea61
2023 doi
- [50]
-
[51]
Z., Jiang , B.-W., et al
Yang , M., Bonanos , A. Z., Jiang , B.-W., et al. 2019, , 629, A91, 10.1051/0004-6361/201935916
2019 doi
-
[52]
2020, , 639, A116, 10.1051/0004-6361/201937168
---. 2020, , 639, A116, 10.1051/0004-6361/201937168
2020 doi
-
[53]
Z., Jiang , B., et al
Yang , M., Bonanos , A. Z., Jiang , B., et al. 2021 a , , 646, A141, 10.1051/0004-6361/202039475
2021 doi
-
[54]
2021 b , , 647, A167, 10.1051/0004-6361/202039596
---. 2021 b , , 647, A167, 10.1051/0004-6361/202039596
2021 doi
-
[55]
E., Izzard , R
Zapartas , E., de Mink , S. E., Izzard , R. G., et al. 2017, , 601, A29, 10.1051/0004-6361/201629685
2017 doi
-
[56]
2024, , 969, 81, 10.3847/1538-4357/ad46fe
Zhang , Z., Ren , Y., Jiang , B., Soszy \'n ski , I., & Jayasinghe , T. 2024, , 969, 81, 10.3847/1538-4357/ad46fe
2024 doi
Reviewed August 7, 2026 · model on record in the stance chip above.
Discussion (0). Sign in to comment.