REVIEW 4 major objections 7 minor 75 references
Perception-oriented Bidirectional Attention Network for Image Super-resolution Quality Assessment
T0 review · 4 major / 7 minor · reviewed 2026-08-04 · deepseek-v4-flash
Pith's one-line read A full-reference super-resolution quality metric built on bidirectional attention beats previous methods on three benchmark databases.
desk verdict A well-designed SR-IQA network whose SOTA claim is undercut by test-set-selected hyperparameters and missing significance testing; send it to review, but ask for a cleaner protocol. read the letter →
The pith
A machine-rendered reading of the paper's core claim, the machinery that carries it, and where it could break.
The reading
What carries the argument
The load-bearing mechanism is the Bidirectional Attention (Bi-Atten) operation, computed as softmax(Q K^T / sqrt(D)) V in two directions with the keys exchanged between HR and SR branches. It uses Q&V from the same branch and K from the other branch, consciously avoiding the K&V homology used by standard cross-attention and avoiding pooling operations that would erase fine distortion cues. The keys first pass through Grouped Multi-scale Deformable Convolution (GMDC): channels are split into groups, each processed by deformable kernels of different sizes so sampling points adapt to artifact geometry, and a point-wise convolution restores cross-channel interaction. The resulting attention feat
What would settle it
Collect per-patch MOS values (or a patch-level ranking study) on QADS and CVIU and test whether PBAN's patch predictions match them. Because the paper assigns each patch the whole-image MOS, if patch predictions do not correlate with patch-level human judgments—especially in images with spatially localized artifacts—the proposed local distortion-perception story is not what drives the reported image-level scores.
Extended reading notes
Core claim
PBAN's central claim is that a full-reference SR quality metric should align the SR and reference feature spaces in both directions, because SR distortion is created from the reference (generation) and judged against the reference (evaluation). The key operation, Bidirectional Attention (Bi-Atten), departs from standard cross-attention: each branch keeps its own query and value but uses the other branch's key, so the HR branch highlights what the SR image introduced and the SR branch measures how far it has drifted from the reference. Before computing attention, Grouped Multi-scale Deformable Convolution (GMDC) splits channels into groups with kernels of different sizes, letting sampling poi
Load-bearing premise
Every 32x32 patch of an SR image is trained with the MOS of the whole image, and the image score is the average of patch predictions; if quality varies sharply inside an image, this label assignment may teach the network image-level biases rather than local artifact perception.
Editorial extensions
If this is right
- FR metrics geared to degradative distortion—PSNR, SSIM, LPIPS—underperform SR-specific deep metrics in the reported comparisons, so SR algorithm rankings should not rely on them alone.
- A deep SR FR-IQA network can be built at 2.222M parameters and still beat much larger NR-IQA models, meaning high accuracy does not require heavyweight backbones.
- The two-way attention design is validated: one-way key transmission helps, but bidirectional transmission is consistently better on QADS and CVIU.
- Grouped multi-scale deformable convolution stabilizes deformable convolution: standard DCN with a single kernel size can hurt performance, whereas the [3,7] grouped variant does not.
- Cross-dataset generalization is higher than comparison methods but still drops from 0.890 (CVIU to QADS) to 0.730 (QADS to CVIU), indicating database size affects transfer.
Reading between the lines
- Editorial extension: the bidirectional key swap should be tested on other pairwise image tasks—deblurring, deraining, compression artifact reduction—where one image is a degraded version of the other; if the mechanism is truly about generation versus evaluation of distortion, it should transfer.
- Editorial extension: the framing implies Bi-Atten's attention maps locate artifacts, but the paper does not evaluate localization; comparing those maps with artifact segmentation or eye-tracking data would directly test the perceptual story.
- Editorial extension: because the benchmark databases are dominated by interpolation and dictionary-based SR, the metric's behavior on modern GAN- and diffusion-based SR, which produce hallucinated textures, remains open; a targeted study with those algorithms would show whether PBAN's sub-pixel weighting keeps its advantage.
Editorial analysis
A structured set of objections, weighed in public.
Referee Report
Summary. The manuscript proposes PBAN, a full-reference image quality assessment network for super-resolved images. The architecture consists of an image encoder, a Perception-oriented Bidirectional Attention (PBA) module, and a quality prediction module. The PBA module contains three components: Bidirectional Attention (Bi-Atten), Grouped Multi-scale Deformable Convolution (GMDC), and Sub-information Excitation Convolution (SubEC). The method is trained and tested on QADS, CVIU, and Waterloo, with per-database 80/20 splits and patch-level MOS supervision. The central claim is that PBAN outperforms state-of-the-art quality assessment methods; Table I reports SRCC/KRCC/PLCC of 0.986/0.923/0.987 on QADS, 0.978/0.872/0.981 on CVIU, and 0.965/0.848/0.979 on Waterloo, the best in every row among the compared FR, NR, and SR-IQA methods. The paper also reports ablations of each component, efficiency comparisons, cross-dataset generalization, and an NR variant (PBAN-NR).
Significance. If the reported results are taken at face value, PBAN is a lightweight (2.222M parameters) SOTA SR FR-IQA metric with convincing margins on three databases, and the cross-dataset and NR results suggest the proposed blocks transfer beyond the main setting. The paper's strengths are the breadth of ablations (component validity, attention interaction modes, group counts, upsampling factors, pointwise convolution, channel shuffle, and alternative upsampling methods), the inclusion of efficiency metrics, and the cross-dataset/NR generalization tests. However, the headline SOTA claim is currently supported only by point estimates from a protocol that selects hyperparameters on the same test sets whose final numbers appear in Table I, and a relevant competitor (PFIQA) is omitted from the main comparison. These issues need to be addressed before the claim can be accepted.
major comments (4)
- [Section V-G.1; Tables VII, IX, XII, and I] The choice of GMDC kernel set [3,7] is explicitly described as "empirically selected for its ability to consistently maximize performance" on the CVIU database, and the group count (2) and upsampling factor S=2 are chosen from Tables IX and XII on the CVIU/Waterloo test sets. The same test sets then appear in Table I as the final claimed performance. This constitutes test-set selection: the reported margins are optimistically biased and the SOTA claim is not established by these numbers. Please switch to a nested protocol (e.g., select hyperparameters on a validation split held out from training, then evaluate once on the test set) or report the selection as part of the model and characterize the expected bias.
- [Section V-A.2; Tables I-XII] No standard deviations or significance tests are reported anywhere. The 5-fold cross-validation described in Section V-A.2 is on the training set, while the test set is evaluated once per database. For a SOTA claim whose closest competitor margin can be as small as 0.004 SRCC (PBAN vs PFIQA on QADS, Table III), run-to-run and split-to-split variation cannot be excluded. Please report mean and standard deviation over multiple random seeds/splits and significance tests against the closest competitors, or clearly justify why a single split is sufficient.
- [Table I vs Table III] PFIQA [69] is included in the efficiency comparison (Table III) with SRCC 0.982 and PLCC 0.983 on QADS, but it is absent from Table I. Since PFIQA is a recent SR-IQA method and its QADS result is close to PBAN's 0.986/0.987, the main comparison table should include it (with KRCC/RMSE if available) or state an explicit inclusion/exclusion criterion. The current presentation makes the SOTA claim look stronger than the full evidence supports.
- [Section V-A.2; Eq. (13)] Each 32x32 patch is supervised with the MOS of the entire SR image, and the final image prediction is the average of patch predictions. This assumes that quality is approximately uniform within an image. If SR artifacts are spatially localized, the model may learn image-level biases rather than localized distortion perception, which would undermine the mechanistic interpretation in Section IV and the reported averaged scores. Please provide a per-patch analysis or a sensitivity experiment with non-uniform/weighted aggregation, or explicitly discuss this limitation in the text.
minor comments (7)
- [Eqs. (1) and (6)] The notation D = Var(Q K^T) is unclear: variance over which dimension? In attention, the scaling factor is normally the dimension of the key vector; please clarify whether D is a scalar or a matrix and define it explicitly.
- [Eq. (11)] The variable O_HR is reused on both sides of the assignment (O_HR = Dropout(ReLU(L(Dropout(O_HR))))). Rename the intermediate feature maps to avoid confusion.
- [Table I] Several entries are marked "—". Please state whether these metrics were not computed or simply not reported, and consider recomputing them for completeness.
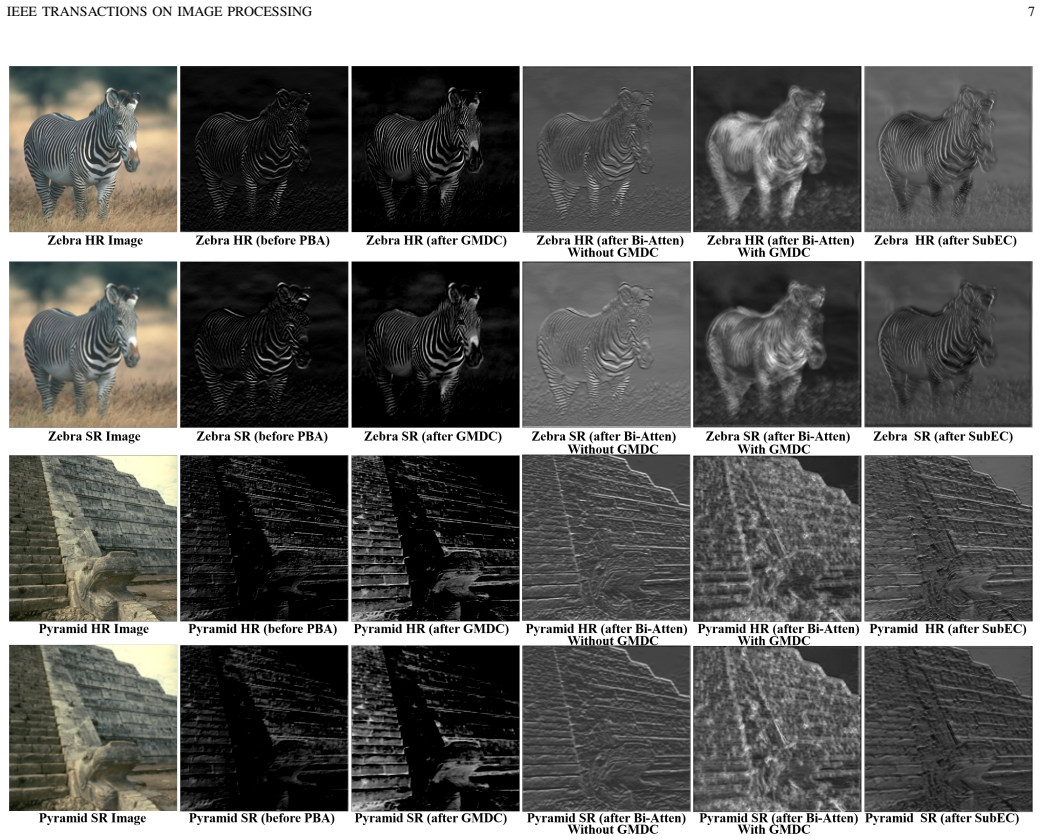
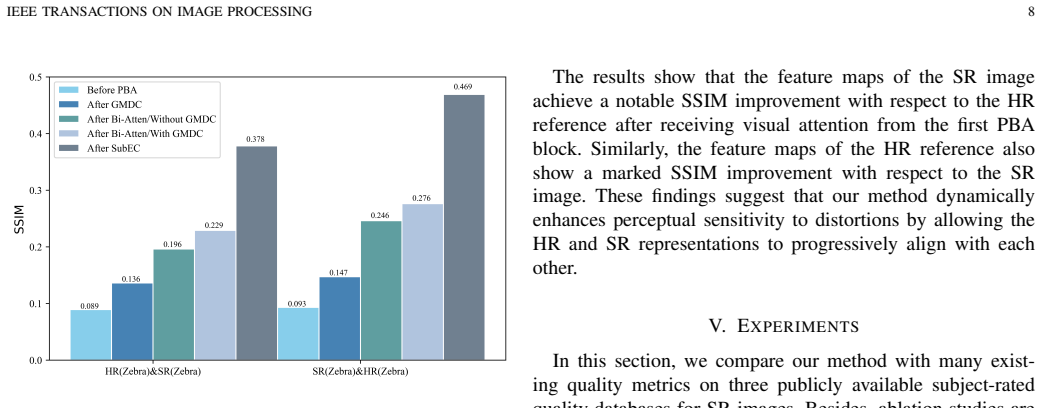
- [Fig. 5] The caption says "SSIM of 'X1&X2'" but it is not explained how SSIM is computed on feature maps (channel-wise? averaged over channels?). Please define the comparison procedure.
- [Section V-G.1] The phrase "empirically selected for its ability to consistently maximize performance" reads as an admission of test-set selection. Rephrase to describe a principled validation-based selection procedure.
- [General] The GitHub link states the code will be made public. At review time no code appears to be available; please ensure the repository is public and contains training/evaluation scripts if reproducibility is claimed.
- [Section III-B.2] The "sub-information" concept (distortion hidden between pixels and between channels) is introduced as an assumption. It would be helpful to state more explicitly that this is a heuristic design choice rather than an established property of SR artifacts.
Circularity Check
SOTA claim is partly manufactured by test-set hyperparameter selection: the reported PBAN configuration (GMDC [3,7], SubEC S=2) was chosen on the same CVIU/Waterloo test sets whose Table I numbers are then presented as predictions.
-
fitted input called prediction
[Section V-G.1 (GMDC ablation, Table VII) + Table I]
"Note that there is no universally optimal combination; therefore, [3,7] was empirically selected for its ability to consistently maximize performance while maintaining a reasonable computational overhead."
The GMDC kernel combination is 'empirically selected' on the CVIU database, and Table VII shows the [3,7]+SubEC row reaching SRCC 0.978 / KRCC 0.872 / PLCC 0.981 / RMSE 0.397 on CVIU. Table I then reports exactly these same numbers as PBAN's test performance on CVIU. Because the selection criterion is test performance on the same split that is later called a prediction, the reported SOTA result is partly a fitted quantity rather than an independent evaluation.
-
fitted input called prediction
[Section V-H.3 (SubEC upsampling factor, Table XII) + Table I]
"Therefore, S is not determined by the distribution of SR scales in the database, but rather chosen for its balanced effectiveness and efficiency in feature processing."
The upsampling factor S is 'empirically chosen' by running Table XII ablations on CVIU and Waterloo, and the chosen S=2 corresponds to the exact CVIU/Waterloo test rows in Table I (0.978/0.981 and 0.965/0.979). Thus the final model configuration is selected on the same test sets whose performance is subsequently advertised as a prediction, so the comparison is not a clean held-out evaluation.
full rationale
PBAN is not circular in the self-definitional sense: the network is trained with MSE on MOS labels (Eq. 13), and the architecture components (Bi-Atten, GMDC, SubEC) are new combinations of known operations evaluated on public databases with cross-dataset tests (Table XIV) and common IQA tests (Table XV). Those give some independent evidence. However, the central claim 'outperforms state-of-the-art' rests on Table I, and the model configuration feeding that table was selected using the same test sets: the paper states that GMDC '[3,7] was empirically selected for its ability to consistently maximize performance' (V-G.1), and the resulting Table VII row is numerically identical to the CVIU row in Table I; similarly, SubEC's S=2 was 'chosen for its balanced effectiveness and efficiency' from Table XII on CVIU/Waterloo, the same datasets as Table I. This is a fitted-input-called-prediction pattern: test labels entered model selection, so the reported margins over SOTA are partly an artifact of selection rather than a blind prediction. No self-citation chain or uniqueness theorem is load-bearing; the self-citations to DeepSRQ/SFSN/SRIF are used as baselines/protocol, not as justification of the result. The absence of significance tests and the omission of PFIQA from Table I are correctness concerns, not circularity.
Assumptions & free parameters
free parameters (5)
- GMDC kernel size set =
[3,7]
- Number of GMDC groups =
2
- SubEC group number in Sub-Channel Weight branch =
2
- SubEC upsampling factor S =
2
- Number of stacked PBA blocks =
not stated (likely 4)
assumptions (3)
- domain assumption MOS values in QADS, CVIU, and Waterloo accurately reflect perceptual quality.
- domain assumption A 32x32 non-overlapping patch can be labeled with the full-image MOS, and averaging patch predictions yields a valid image score.
- domain assumption The 80/20 random split and the chosen test sets give an unbiased estimate of the stated SOTA claim.
invented entities (1)
-
Sub-information: distortion hidden between pixels and between channels
Cite this review
Pith. "Pith review of Perception-oriented Bidirectional Attention Network for Image Super-resolution Quality Assessment." pith.science (2026). https://pith.science/paper/7SMVTTI2
@misc{pith2026250906442,
  author       = {Pith},
  title        = {Pith review of: Perception-oriented Bidirectional Attention Network for Image Super-resolution Quality Assessment},
  year         = {2026},
  howpublished = {\url{https://pith.science/paper/7SMVTTI2}},
  note         = {Machine review of arXiv:2509.06442}
}
read the original abstract
Many super-resolution (SR) algorithms have been proposed to increase image resolution. However, full-reference (FR) image quality assessment (IQA) metrics for comparing and evaluating different SR algorithms are limited. In this work, we propose the Perception-oriented Bidirectional Attention Network (PBAN) for image SR FR-IQA, which is composed of three modules: an image encoder module, a perception-oriented bidirectional attention (PBA) module, and a quality prediction module. First, we encode the input images for feature representations. Inspired by the characteristics of the human visual system, we then construct the perception-oriented PBA module. Specifically, different from existing attention-based SR IQA methods, we conceive a Bidirectional Attention to bidirectionally construct visual attention to distortion, which is consistent with the generation and evaluation processes of SR images. To further guide the quality assessment towards the perception of distorted information, we propose Grouped Multi-scale Deformable Convolution, enabling the proposed method to adaptively perceive distortion. Moreover, we design Sub-information Excitation Convolution to direct visual perception to both sub-pixel and sub-channel attention. Finally, the quality prediction module is exploited to integrate quality-aware features and regress quality scores. Extensive experiments demonstrate that our proposed PBAN outperforms state-of-the-art quality assessment methods.
Figures


Figures from the paper (3 more)

Reference graph
Works this paper leans on
-
[69]
Perception- and Fidelity-Aware Reduced-Reference Super-Resolution Im- age Quality Assessment,
X. Lin, X. Liu, H. Yang, X. He, and H. Chen, “Perception- and Fidelity-Aware Reduced-Reference Super-Resolution Im- age Quality Assessment,”IEEE Transactions on Broadcasting, vol. 71, no. 1, pp. 323–333, 2025
work page 2025
-
[1]
Efficient Real-world Image Super-Resolution Via Adaptive Directional Gradient Convolution,
L. Peng, Y . Cao, R. Pei, W. Li, J. Guo, X. Fu, Y . Wang, and Z.-J. Zha, “Efficient Real-world Image Super-Resolution Via Adaptive Directional Gradient Convolution,”arXiv preprint arXiv:2405.07023, 2024
arXiv 2024
-
[2]
Emulating Self-attention with Con- volution for Efficient Image Super-Resolution,
D. Lee, S. Yun, and Y . Ro, “Emulating Self-attention with Con- volution for Efficient Image Super-Resolution,”arXiv preprint arXiv:2503.06671, 2025
arXiv 2025
-
[3]
RankSRGAN: Generative Adversarial Networks With Ranker for Image Super- Resolution,
W. Zhang, Y . Liu, C. Dong, and Y . Qiao, “RankSRGAN: Generative Adversarial Networks With Ranker for Image Super- Resolution,” inProceedings of the IEEE/CVF International Conference on Computer Vision, 2019, pp. 3096–3105
work page 2019
-
[4]
SeD: Semantic-Aware Discriminator for Image Super-Resolution,
B. Li, X. Li, H. Zhu, Y . Jin, R. Feng, Z. Zhang, and Z. Chen, “SeD: Semantic-Aware Discriminator for Image Super-Resolution,” inProceedings of the IEEE/CVF Conference on Computer Vision and Pattern Recognition, 2024, pp. 25 784– 25 795
work page 2024
-
[5]
CAMixerSR: Only Details Need More “Attention
Y . Wang, Y . Liu, S. Zhao, J. Li, and L. Zhang, “CAMixerSR: Only Details Need More “Attention”,” inProceedings of the IEEE/CVF Conference on Computer Vision and Pattern Recog- nition, 2024, pp. 25 837–25 846
work page 2024
-
[6]
K. Park, J. W. Soh, and N. I. Cho, “Efficient Attention-Sharing Information Distillation Transformer for Lightweight Single Im- age Super-Resolution,”arXiv preprint arXiv:2501.15774, 2025
work page Pith review arXiv 2025
-
[7]
Image Processing GNN: Breaking Rigidity in Super-Resolution,
Y . Tian, H. Chen, C. Xu, and Y . Wang, “Image Processing GNN: Breaking Rigidity in Super-Resolution,” inProceedings of the IEEE/CVF Conference on Computer Vision and Pattern Recognition, 2024, pp. 24 108–24 117
work page 2024
Show all 75 references
-
[8]
Channel-Wise and Spatial Feature Modulation Network for Single Image Super- Resolution,
Y . Hu, J. Li, Y . Huang, and X. Gao, “Channel-Wise and Spatial Feature Modulation Network for Single Image Super- Resolution,”IEEE Transactions on Circuits and Systems for Video Technology, vol. 30, no. 11, pp. 3911–3927, 2020
2020
-
[9]
Diffu- sion Prior Interpolation for Flexibility Real-World Face Super- Resolution,
J. Yang, T. Dai, Y . Zhu, N. Li, J. Li, and S.-T. Xia, “Diffu- sion Prior Interpolation for Flexibility Real-World Face Super- Resolution,” inProceedings of the AAAI Conference on Artifi- cial Intelligence, vol. 39, no. 9, 2025, pp. 9211–9219
2025
-
[10]
DifIISR: A Diffusion Model with Gradient Guidance for Infrared Image Super-Resolution,
X. Li, Z. Wang, Y . Zou, Z. Chen, J. Ma, Z. Jiang, L. Ma, and J. Liu, “DifIISR: A Diffusion Model with Gradient Guidance for Infrared Image Super-Resolution,” inProceedings of the IEEE/CVF Computer Vision and Pattern Recognition Confer- ence, 2025, pp. 7534–7544. IEEE TRANSACT...
2025
-
[11]
Dy- namic Attention-Guided Diffusion for Image Super-Resolution,
B. B. Moser, S. Frolov, F. Raue, S. Palacio, and A. Dengel, “Dy- namic Attention-Guided Diffusion for Image Super-Resolution,” in2025 IEEE/CVF Winter Conference on Applications of Com- puter Vision (WACV), 2025, pp. 451–460
2025
-
[12]
SeeSR: Towards Semantics-Aware Real-World Image Super- Resolution,
R. Wu, T. Yang, L. Sun, Z. Zhang, S. Li, and L. Zhang, “SeeSR: Towards Semantics-Aware Real-World Image Super- Resolution,” inProceedings of the IEEE/CVF Computer Vision and Pattern Recognition Conference, 2024, pp. 25 456–25 467
2024
-
[13]
Scaling Up to Excellence: Practicing Model Scaling for Photo-Realistic Image Restoration In the Wild,
F. Yu, J. Gu, Z. Li, J. Hu, X. Kong, X. Wang, J. He, Y . Qiao, and C. Dong, “Scaling Up to Excellence: Practicing Model Scaling for Photo-Realistic Image Restoration In the Wild,” in Proceedings of the IEEE/CVF Conference on Computer Vision and Pattern Recognition, 2024, pp. 2...
2024
-
[14]
Image quality assessment: from error visibility to structural similarity,
Z. Wang, A. Bovik, H. Sheikh, and E. Simoncelli, “Image quality assessment: from error visibility to structural similarity,” IEEE Transactions on Image Processing, vol. 13, no. 4, pp. 600–612, 2004
2004
-
[15]
Complex Wavelet Structural Similarity: A New Image Similarity Index,
M. P. Sampat, Z. Wang, S. Gupta, A. C. Bovik, and M. K. Markey, “Complex Wavelet Structural Similarity: A New Image Similarity Index,”IEEE Transactions on Image Processing, vol. 18, no. 11, pp. 2385–2401, 2009
2009
-
[16]
Multiscale struc- tural similarity for image quality assessment,
Z. Wang, E. P. Simoncelli, and A. C. Bovik, “Multiscale struc- tural similarity for image quality assessment,” inThe Thrity- Seventh Asilomar Conference on Signals, Systems & Computers, 2003, vol. 2. IEEE, 2003, pp. 1398–1402
2003
-
[17]
Deep Neural Networks for No-Reference and Full-Reference Image Quality Assessment,
S. Bosse, D. Maniry, K.-R. M ¨uller, T. Wiegand, and W. Samek, “Deep Neural Networks for No-Reference and Full-Reference Image Quality Assessment,”IEEE Transactions on Image Pro- cessing, vol. 27, no. 1, pp. 206–219, 2018
2018
-
[18]
Blind Image Quality Assessment Using a Deep Bilinear Convolutional Neural Network,
W. Zhang, K. Ma, J. Yan, D. Deng, and Z. Wang, “Blind Image Quality Assessment Using a Deep Bilinear Convolutional Neural Network,”IEEE Transactions on Circuits and Systems for Video Technology, vol. 30, no. 1, pp. 36–47, 2020
2020
-
[19]
Rethinking and Conceptualizing Just Noticeable Difference Estimation by Residual Learning,
Q. Jiang, F. Liu, Z. Wang, S. Wang, and W. Lin, “Rethinking and Conceptualizing Just Noticeable Difference Estimation by Residual Learning,”IEEE Transactions on Circuits and Systems for Video Technology, vol. 34, no. 10, pp. 9515–9527, 2024
2024
-
[20]
MetaIQA: Deep Meta-Learning for No-Reference Image Quality Assessment,
H. Zhu, L. Li, J. Wu, W. Dong, and G. Shi, “MetaIQA: Deep Meta-Learning for No-Reference Image Quality Assessment,” in Proceedings of the IEEE/CVF Conference on Computer Vision and Pattern Recognition, 2020, pp. 14 143–14 152
2020
-
[21]
Deep Underwater Image Quality Assessment With Explicit Degradation Awareness Embedding,
Q. Jiang, Y . Gu, Z. Wu, C. Li, H. Xiong, F. Shao, and Z. Wang, “Deep Underwater Image Quality Assessment With Explicit Degradation Awareness Embedding,”IEEE Transactions on Image Processing, vol. 34, pp. 1297–1310, 2025
2025
-
[22]
Blindly Assess Image Quality in the Wild Guided by a Self- Adaptive Hyper Network,
S. Su, Q. Yan, Y . Zhu, C. Zhang, X. Ge, J. Sun, and Y . Zhang, “Blindly Assess Image Quality in the Wild Guided by a Self- Adaptive Hyper Network,” inProceedings of the IEEE/CVF Conference on Computer Vision and Pattern Recognition, 2020, pp. 3667–3676
2020
-
[23]
LIQA: Lifelong Blind Image Quality Assessment,
J. Liu, W. Zhou, X. Li, J. Xu, and Z. Chen, “LIQA: Lifelong Blind Image Quality Assessment,”IEEE Transactions on Mul- timedia, vol. 25, pp. 5358–5373, 2023
2023
-
[24]
Image Quality Assessment for Perceptual Image Restora- tion: A New Dataset, Benchmark and Metric,
J. Gu, H. Cai, H. Chen, X. Ye, J. Ren, and C. Dong, “Image Quality Assessment for Perceptual Image Restora- tion: A New Dataset, Benchmark and Metric,”arXiv preprint arXiv:2011.15002, 2020
2011 arXiv
-
[25]
A No-Reference Deep Learning Quality Assessment Method for Super-Resolution Images Based on Frequency Maps,
Z. Zhang, W. Sun, X. Min, W. Zhu, T. Wang, W. Lu, and G. Zhai, “A No-Reference Deep Learning Quality Assessment Method for Super-Resolution Images Based on Frequency Maps,” in2022 IEEE International Symposium on Circuits and Systems (ISCAS), 2022, pp. 3170–3174
2022
-
[26]
Visual Quality Assess- ment for Super-Resolved Images: Database and Method,
F. Zhou, R. Yao, B. Liu, and G. Qiu, “Visual Quality Assess- ment for Super-Resolved Images: Database and Method,”IEEE Transactions on Image Processing, vol. 28, no. 7, pp. 3528– 3541, 2019
2019
-
[27]
Image Super-Resolution Quality Assessment: Structural Fidelity Versus Statistical Nat- uralness,
W. Zhou, Z. Wang, and Z. Chen, “Image Super-Resolution Quality Assessment: Structural Fidelity Versus Statistical Nat- uralness,” in2021 13th International conference on quality of multimedia experience (QoMEX). IEEE, 2021, pp. 61–64
2021
-
[28]
Quality Assessment of Image Super- Resolution: Balancing Deterministic and Statistical Fidelity@,
W. Zhou and Z. Wang, “Quality Assessment of Image Super- Resolution: Balancing Deterministic and Statistical Fidelity@,” inProceedings of the 30th ACM International Conference on Multimedia, 2022, pp. 934–942
2022
-
[29]
Blind quality assessment for image superresolution using deep two-stream convolutional networks,
W. Zhou, Q. Jiang, Y . Wang, Z. Chen, and W. Li, “Blind quality assessment for image superresolution using deep two-stream convolutional networks,”Information Sciences, vol. 528, pp. 205–218, 2020
2020
-
[30]
A No-Reference Deep Learning Quality Assessment Method for Super-Resolution Images Based on Frequency Maps,
Z. Zhang, W. Sun, X. Min, W. Zhu, T. Wang, W. Lu, and G. Zhai, “A No-Reference Deep Learning Quality Assessment Method for Super-Resolution Images Based on Frequency Maps,” inIEEE International Symposium on Circuits and Systems (ISCAS), 2022, pp. 3170–3174
2022
-
[31]
Learning- Based Quality Assessment for Image Super-Resolution,
T. Zhao, Y . Lin, Y . Xu, W. Chen, and Z. Wang, “Learning- Based Quality Assessment for Image Super-Resolution,”IEEE Transactions on Multimedia, vol. 24, pp. 3570–3581, 2021
2021
-
[32]
Boost- ing No-Reference Super-Resolution Image Quality Assessment with Knowledge Distillation and Extension,
H. Zhang, S. Su, Y . Zhu, J. Sun, and Y . Zhang, “Boost- ing No-Reference Super-Resolution Image Quality Assessment with Knowledge Distillation and Extension,” inIEEE Interna- tional Conference on Acoustics, Speech and Signal Processing (ICASSP), 2023, pp. 1–5
2023
-
[33]
Joint channel-spatial attention network for super-resolution image quality assessment,
T. Zhang, K. Zhang, C. Xiao, Z. Xiong, and J. Lu, “Joint channel-spatial attention network for super-resolution image quality assessment,”Applied Intelligence, vol. 52, no. 15, pp. 17 118–17 132, 2022
2022
-
[34]
TADSRNet: A triple-attention dual-scale residual network for super-resolution image quality assessment,
X. Quan, K. Zhang, H. Li, D. Fan, Y . Hu, and J. Chen, “TADSRNet: A triple-attention dual-scale residual network for super-resolution image quality assessment,”Applied Intelli- gence, vol. 53, no. 22, pp. 26 708–26 724, 2023
2023
-
[35]
Deformable Convolutional Networks,
J. Dai, H. Qi, Y . Xiong, Y . Li, G. Zhang, H. Hu, and Y . Wei, “Deformable Convolutional Networks,” inProceedings of the IEEE/CVF International Conference on Computer Vision, 2017, pp. 764–773
2017
-
[36]
Deformable ConvNets V2: More Deformable, Better Results,
X. Zhu, H. Hu, S. Lin, and J. Dai, “Deformable ConvNets V2: More Deformable, Better Results,” inProceedings of the IEEE/CVF Conference on Computer Vision and Pattern Recog- nition, 2019, pp. 9308–9316
2019
-
[37]
Human perception of spatial fre- quency varies with stimulus orientation and location in the visual field,
W. Kirsch and W. Kunde, “Human perception of spatial fre- quency varies with stimulus orientation and location in the visual field,”Scientific Reports, vol. 13, no. 1, p. 17656, 2023
2023
-
[38]
Region-Adaptive Deformable Network for Image Quality As- sessment,
S. Shi, Q. Bai, M. Cao, W. Xia, J. Wang, Y . Chen, and Y . Yang, “Region-Adaptive Deformable Network for Image Quality As- sessment,” inProceedings of the IEEE/CVF Conference on Computer Vision and Pattern Recognition, 2021, pp. 324–333
2021
-
[39]
Dual-quality map based no reference image quality assessment using deformable convolution,
Z. Shi, Z. Wang, F. Kong, R. Li, and T. Luo, “Dual-quality map based no reference image quality assessment using deformable convolution,”Digital Signal Processing, vol. 123, p. 103398, 2022
2022
-
[40]
View from the Top: Hierarchies and Reverse Hierarchies in the Visual System,
S. Hochstein and M. Ahissar, “View from the Top: Hierarchies and Reverse Hierarchies in the Visual System,”Neuron, vol. 36, no. 5, pp. 791–804, 2002
2002
-
[41]
Real-Time Single Image and Video Super-Resolution Using an Efficient Sub-Pixel Convolutional Neural Network,
W. Shi, J. Caballero, F. Huszar, J. Totz, A. P. Aitken, R. Bishop, D. Rueckert, and Z. Wang, “Real-Time Single Image and Video Super-Resolution Using an Efficient Sub-Pixel Convolutional Neural Network,” inProceedings of the IEEE/CVF Conference on Computer Vision and Pattern R...
2016
-
[42]
Quaternion Structural Sim- ilarity: A New Quality Index for Color Images,
A. Kolaman and O. Yadid-Pecht, “Quaternion Structural Sim- ilarity: A New Quality Index for Color Images,”IEEE Trans- actions on Image Processing, vol. 21, no. 4, pp. 1526–1536, 2012
2012
-
[43]
Gradient Magnitude Similarity Deviation: A Highly Efficient Perceptual Image Quality Index,
W. Xue, L. Zhang, X. Mou, and A. C. Bovik, “Gradient Magnitude Similarity Deviation: A Highly Efficient Perceptual Image Quality Index,”IEEE Transactions on Image Processing, vol. 23, no. 2, pp. 684–695, 2014
2014
-
[44]
Encoding Distortions for Multi-task Full-Reference Image Quality Assessment,
C. Huang, T. Jiang, and M. Jiang, “Encoding Distortions for Multi-task Full-Reference Image Quality Assessment,” in 2019 IEEE International Conference on Multimedia and Expo 16 (ICME). IEEE, 2019, pp. 1864–1869
2019
-
[45]
SPSIM: A Superpixel-Based Similarity Index for Full-Reference Image Quality Assessment,
W. Sun, Q. Liao, J.-H. Xue, and F. Zhou, “SPSIM: A Superpixel-Based Similarity Index for Full-Reference Image Quality Assessment,”IEEE Transactions on Image Processing, vol. 27, no. 9, pp. 4232–4244, 2018
2018
-
[46]
The Unreasonable Effectiveness of Deep Features as a Per- ceptual Metric,
R. Zhang, P. Isola, A. A. Efros, E. Shechtman, and O. Wang, “The Unreasonable Effectiveness of Deep Features as a Per- ceptual Metric,” inProceedings of the IEEE Conference on Computer Vision and Pattern Recognition, June 2018
2018
-
[47]
A Full-Reference Quality Assessment Metric for Fine-Grained Compressed Images,
Z. Zhang, W. Sun, X. Min, T. Wang, W. Lu, and G. Zhai, “A Full-Reference Quality Assessment Metric for Fine-Grained Compressed Images,” inInternational Conference on Visual Communications and Image Processing, 2021, pp. 1–4
2021
-
[48]
MFAN: A Multi-Projection Fusion Atten- tion Network for No-Reference and Full-Reference Panoramic Image Quality Assessment,
H. Li and X. Zhang, “MFAN: A Multi-Projection Fusion Atten- tion Network for No-Reference and Full-Reference Panoramic Image Quality Assessment,”IEEE Signal Processing Letters, vol. 30, pp. 1207–1211, 2023
2023
-
[49]
Full-Reference Image Quality Assessment: Addressing Content Misalignment Issue by Comparing Order Statistics of Deep Features,
X. Liao, X. Wei, M. Zhou, and S. Kwong, “Full-Reference Image Quality Assessment: Addressing Content Misalignment Issue by Comparing Order Statistics of Deep Features,”IEEE Transactions on Broadcasting, vol. 70, no. 1, pp. 305–315, 2024
2024
-
[50]
Graph- Represented Distribution Similarity Index for Full-Reference Image Quality Assessment,
W. Shen, M. Zhou, J. Luo, Z. Li, and S. Kwong, “Graph- Represented Distribution Similarity Index for Full-Reference Image Quality Assessment,”IEEE Transactions on Image Pro- cessing, vol. 33, pp. 3075–3089, 2024
2024
-
[51]
Debiased Mapping for Full-Reference Image Quality Assess- ment,
B. Chen, H. Zhu, L. Zhu, S. Wang, J. Pan, and S. Wang, “Debiased Mapping for Full-Reference Image Quality Assess- ment,”IEEE Transactions on Multimedia, vol. 27, pp. 2638– 2649, 2025
2025
-
[52]
Single Image Super-Resolution Quality Assessment: A Real- World Dataset, Subjective Studies, and an Objective Metric,
Q. Jiang, Z. Liu, K. Gu, F. Shao, X. Zhang, H. Liu, and W. Lin, “Single Image Super-Resolution Quality Assessment: A Real- World Dataset, Subjective Studies, and an Objective Metric,” IEEE Transactions on Image Processing, vol. 31, pp. 2279– 2294, 2022
2022
-
[53]
C 2MT: A Credible and Class-Aware Multi-Task Transformer for SR-IQA,
H. Li, K. Zhang, Z. Niu, and H. Shi, “C 2MT: A Credible and Class-Aware Multi-Task Transformer for SR-IQA,”IEEE Signal Processing Letters, vol. 29, pp. 2662–2666, 2022
2022
-
[54]
Multi-Frame Super-Resolution With Raw Images Via Modified Deformable Convolution,
G. Li, L. Qiu, H. Zhang, F. Xie, and Z. Jiang, “Multi-Frame Super-Resolution With Raw Images Via Modified Deformable Convolution,” in2022 IEEE International Conference on Acous- tics, Speech and Signal Processing (ICASSP). IEEE, 2022, pp. 2155–2159
2022
-
[55]
EDVR: Video Restoration With Enhanced Deformable Convolutional Networks,
X. Wang, K. C. Chan, K. Yu, C. Dong, and C. C. Loy, “EDVR: Video Restoration With Enhanced Deformable Convolutional Networks,” inProceedings of the IEEE/CVF Conference on Computer Vision and Pattern Recognition, 2019, pp. 1954– 1963
2019
-
[56]
Super-Resolution Reconstruction Algorithm for Infrared Image with Double Regular Items Based on Sub-Pixel Convolution,
L. Yu, X. Zhang, and Y . Chu, “Super-Resolution Reconstruction Algorithm for Infrared Image with Double Regular Items Based on Sub-Pixel Convolution,”Applied Sciences, vol. 10, no. 3, 2020
2020
-
[57]
A sub- pixel convolution-based improved bidirectional feature pyramid network for pansharpening,
J. Qu, J. Yin, Y . Jiang, W. Huang, and Q. Chen, “A sub- pixel convolution-based improved bidirectional feature pyramid network for pansharpening,”Remote Sensing Letters, vol. 14, no. 1, pp. 91–101, 2023
2023
-
[58]
CrossViT: Cross- Attention Multi-Scale Vision Transformer for Image Classifica- tion,
C.-F. R. Chen, Q. Fan, and R. Panda, “CrossViT: Cross- Attention Multi-Scale Vision Transformer for Image Classifica- tion,” inProceedings of the IEEE/CVF International Conference on Computer Vision, 2021, pp. 347–356
2021
-
[59]
Aggregated Residual Transformations for Deep Neural Networks,
S. Xie, R. Girshick, P. Doll ´ar, Z. Tu, and K. He, “Aggregated Residual Transformations for Deep Neural Networks,” inPro- ceedings of the IEEE/CVF Conference on Computer Vision and Pattern Recognition, 2017, pp. 5987–5995
2017
-
[60]
ShuffleNet: An Extremely Efficient Convolutional Neural Network for Mobile Devices,
X. Zhang, X. Zhou, M. Lin, and J. Sun, “ShuffleNet: An Extremely Efficient Convolutional Neural Network for Mobile Devices,” inProceedings of the IEEE/CVF Conference on Computer Vision and Pattern Recognition, 2018, pp. 6848– 6856
2018
-
[61]
Deep Residual Learn- ing for Image Recognition,
K. He, X. Zhang, S. Ren, and J. Sun, “Deep Residual Learn- ing for Image Recognition,” inProceedings of the IEEE/CVF Conference on Computer Vision and Pattern Recognition, 2016
2016
-
[62]
Learning a no-reference quality metric for single-image super-resolution,
C. Ma, C.-Y . Yang, X. Yang, and M.-H. Yang, “Learning a no-reference quality metric for single-image super-resolution,” Computer Vision and Image Understanding, vol. 158, pp. 1–16, 2017
2017
-
[63]
Objective Quality Assessment of Interpolated Natural Images,
H. Yeganeh, M. Rostami, and Z. Wang, “Objective Quality Assessment of Interpolated Natural Images,”IEEE Transactions on Image Processing, vol. 24, no. 11, pp. 4651–4663, 2015
2015
-
[64]
The Unreasonable Effectiveness of Deep Features as a Percep- tual Metric,
R. Zhang, P. Isola, A. A. Efros, E. Shechtman, and O. Wang, “The Unreasonable Effectiveness of Deep Features as a Percep- tual Metric,” inProceedings of the IEEE/CVF Conference on Computer Vision and Pattern Recognition, 2018, pp. 586–595
2018
-
[65]
Making a “Completely Blind
A. Mittal, R. Soundararajan, and A. C. Bovik, “Making a “Completely Blind” Image Quality Analyzer,”IEEE Signal Processing Letters, vol. 20, no. 3, pp. 209–212, 2013
2013
-
[66]
A highly efficient method for blind image quality assessment,
Q. Wu, Z. Wang, and H. Li, “A highly efficient method for blind image quality assessment,” in2015 IEEE International Conference on Image Processing (ICIP), 2015, pp. 339–343
2015
-
[67]
Exploring CLIP for Assessing the Look and Feel of Images,
J. Wang, K. C. Chan, and C. C. Loy, “Exploring CLIP for Assessing the Look and Feel of Images,” inProceedings of the AAAI Conference on Artificial Intelligence, vol. 37, no. 2, 2023, pp. 2555–2563
2023
-
[68]
TOPIQ: A Top-Down Approach From Semantics to Distortions for Image Quality Assessment,
C. Chen, J. Mo, J. Hou, H. Wu, L. Liao, W. Sun, Q. Yan, and W. Lin, “TOPIQ: A Top-Down Approach From Semantics to Distortions for Image Quality Assessment,”IEEE Transactions on Image Processing, vol. 33, pp. 2404–2418, 2024
2024
-
[70]
LDConv: Linear deformable convolution for improving convolutional neural networks,
X. Zhang, Y . Song, T. Song, D. Yang, Y . Ye, J. Zhou, and L. Zhang, “LDConv: Linear deformable convolution for improving convolutional neural networks,”Image and Vision Computing, vol. 149, p. 105190, 2024
2024
-
[71]
Convolutional Neural Networks for No-Reference Image Quality Assessment,
L. Kang, P. Ye, Y . Li, and D. Doermann, “Convolutional Neural Networks for No-Reference Image Quality Assessment,” in Proceedings of the IEEE/CVF Conference on Computer Vision and Pattern Recognition, 2014, pp. 1733–1740
2014
-
[72]
MUSIQ: Multi-Scale Image Quality Transformer,
J. Ke, Q. Wang, Y . Wang, P. Milanfar, and F. Yang, “MUSIQ: Multi-Scale Image Quality Transformer,” inIEEE Proceedings of the IEEE/CVF International Conference on Computer Vision, 2021, pp. 5148–5157
2021
-
[73]
No-Reference Image Quality Assessment via Transformers, Relative Ranking, and Self-Consistency,
S. A. Golestaneh, S. Dadsetan, and K. M. Kitani, “No-Reference Image Quality Assessment via Transformers, Relative Ranking, and Self-Consistency,” inIEEE/CVF Winter Conference on Applications of Computer Vision (WACV), 2022, pp. 3989–3999
2022
-
[74]
LIVE In the Wild Image Quality Challenge Database,
D. Ghadiyaram and A. C. Bovik, “LIVE In the Wild Image Quality Challenge Database,”Online: http://live. ece. utexas. edu/research/ChallengeDB/index. html[Mar, 2017], 2015
2017
-
[75]
KonIQ-10k: An Ecologically Valid Database for Deep Learning of Blind Image Quality Assessment,
V . Hosu, H. Lin, T. Sziranyi, and D. Saupe, “KonIQ-10k: An Ecologically Valid Database for Deep Learning of Blind Image Quality Assessment,”IEEE Transactions on Image Processing, vol. 29, pp. 4041–4056, 2020
2020
Reviewed August 4, 2026 · model on record in the stance chip above.
Discussion (0). Continue with ORCID to comment.