REVIEW 4 major objections 3 minor 87 references
Full radio SED fitting lowers inferred galaxy luminosities by ~3x and shifts the radio luminosity function ~1 dex at high z, explaining the persistent radio excess in cosmic star formation rates.
Reviewed by Pith at T0; open to challenge. T0 means a machine referee read the full paper against a public rubric. the ladder, T0–T4 →
T0 review · deepseek-v4-flash
2026-08-02 06:40 UTC pith:7UIF75MV
load-bearing objection A useful SKA science-case chapter: the review is solid and the mock forecast is new, but the headline numbers are inherited from T-RECS and need to be presented as illustrative, not as measurements. the 4 major comments →
Tracing cosmic star formation history through radio continuum spectral energy distribution and non-thermal emission
The pith
A machine-rendered reading of the paper's core claim, the machinery that carries it, and where it could break.
Core claim
The central claim is that the widespread single-power-law k-correction (alpha=0.70) overestimates rest-frame 1.4 GHz luminosities of distant star-forming galaxies because real radio SEDs flatten at low frequencies and curve over 150 MHz–20 GHz. Fitting the full SED with SKA AA4 data lowers the median L_1.4 from 5.16e22 to 1.57e22 W/Hz, reduces scatter from 0.70 to 0.54 dex, and moves the inferred evolving RLF by up to about a dex at high redshift. The paper connects this directly to the MeerKAT DEEP2 SFRD excess over UV–IR estimates, and shows the Ultra-deep Tier (0.05 uJy/beam at 1.4 GHz) will reach SFRs of ~1 Msun/yr at z~5 and ~10 Msun/yr at z~8, constraining the faint end of the RLF to z
What carries the argument
The load-bearing tool is broadband radio SED fitting for k-corrections: three assumptions are compared—fixed spectral index alpha=0.70 (single-band), a two-point index between SKA-Mid Bands 1 and 2, and a Bayesian fit to the full 150 MHz–20 GHz SED. The full-SED fit captures low-frequency flattening (free-free absorption) and spectral curvature (cosmic-ray electron ageing and inverse-Compton losses), which lowers inferred L_1.4 and shrinks scatter. Mock samples come from the T-RECS sfgsdeep catalogue; RLFs are derived with binned (Page–Carrera) and unbinned maximum-likelihood fits under the LADE evolution model g(z)=(1+z)^{p1+p2 ln(1+z)}, f(z)=(1+z)^{k1+k2 z}, selected by AIC/BIC.
Load-bearing premise
The forecast inherits its central result from the T-RECS mock catalogue: if real high-redshift star-forming galaxies do not show the low-frequency flattening and spectral curvature that T-RECS builds in, the factor-of-three luminosity drop and dex-level RLF shift would not occur; the paper itself labels these forecasts illustrative and notes the mock lacks flux uncertainties and cannot separate radio-quiet AGN.
What would settle it
Re-observe the same MeerKAT DEEP2 galaxies with SKA AA4 multi-band coverage, fit each source's full 150 MHz–20 GHz SED, and recompute rest-frame 1.4 GHz luminosities and the cosmic SFRD; if the full-SED SFRD no longer exceeds UV–IR estimates, the fixed-power-law bias hypothesis survives—if the excess persists, the explanation fails. A cheaper version: apply the same k-correction comparison to existing MIGHTEE-COSMOS SEDs and check whether the measured spectral-index distribution (median alpha Band1–2 ≈ 0.76 ± 0.08 in the mock) matches the real data.
If this is right
- Rest-frame 1.4 GHz luminosities derived with a full SED fit drop by a factor of ~3 in the median, and the scatter across the sample shrinks from 0.70 to 0.54 dex.
- The inferred radio luminosity function shifts by up to ~1 dex at z~3–5, meaning fixed-alpha k-corrections bias source counts and evolution—not just normalisation.
- The MeerKAT DEEP2 excess of radio-based cosmic SFRD over UV–IR estimates has a direct, non-exotic explanation: the fixed alpha=0.70 assumption overestimated rest-frame luminosities.
- Ultra-deep SKA AA4 tiers detect SFGs with SFRs down to ~1 Msun/yr at z~5 and ~10 Msun/yr at z~8, placing the faint end of the RLF within reach.
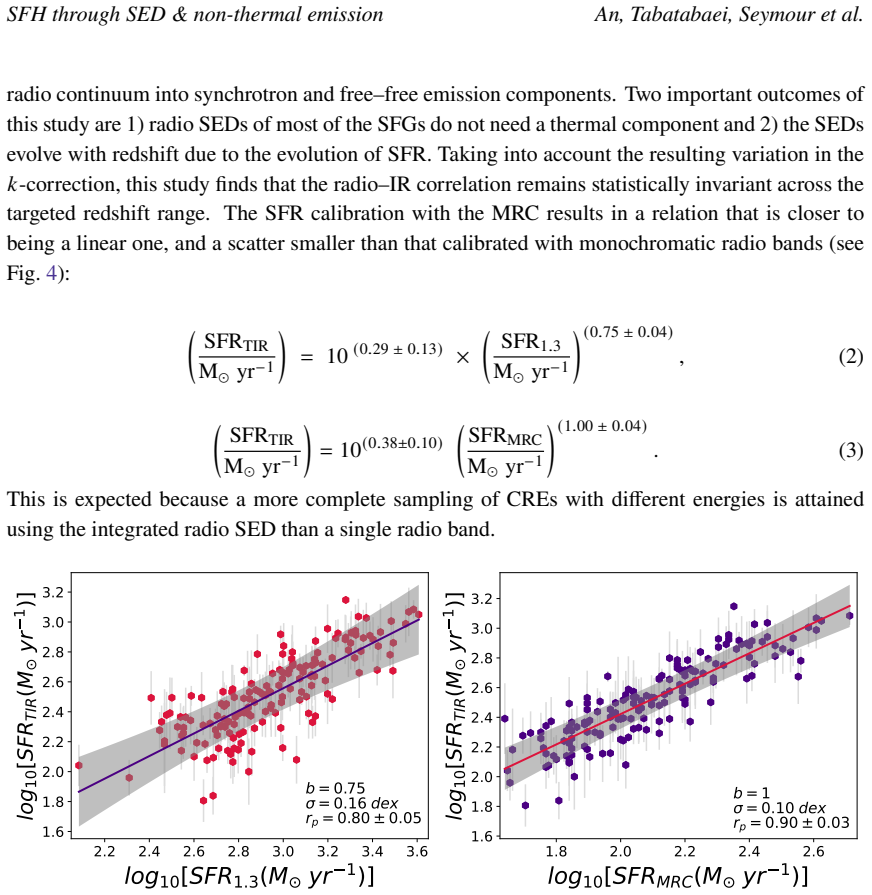
- Integrated mid-radio (1–10 GHz) luminosities correlate almost linearly with total-infrared SFR (slope 1.00±0.04) with smaller scatter than monochromatic radio bands, making MRC the preferred tracer once an LF framework for integrated luminosities is built.
Where Pith is reading between the lines
- If the factor-of-three reduction holds for real galaxies, previously published radio SFRDs that assumed a single power law may need systematic downward revision, narrowing the gap with UV–IR without invoking extra obscured star formation.
- The same bias should affect radio-quiet AGN demographics: sources in the T-RECS mock that are actually RQ AGN are treated as SFGs, so a joint SED plus multi-wavelength AGN classifier would test whether part of the 'excess' originates in AGN contamination rather than spectral shape.
- A direct testable extension: apply full-SED k-corrections to existing MIGHTEE-COSMOS data (1.5<z<3.5) and check whether the reported redshift-dependent flattening of alpha_nt matches the T-RECS SED shapes well enough to reproduce the 3x luminosity drop.
- A luminosity function built specifically for integrated MRC luminosities—flagged by the paper as missing—could replace monochromatic 1.4 GHz LFs as the standard for cosmic SFH, since MRC–SFR is closer to linear and less scattered.
Editorial analysis
A structured set of objections, weighed in public.
Referee Report
Summary. This SKA AA4 science chapter reviews radio continuum emission as a star-formation tracer and its use in measuring the cosmic star formation history. Sections 2–4 synthesize recent observational evidence that radio SEDs of star-forming galaxies are curved and evolve with redshift, discuss empirical SFR calibrations, and summarize current radio luminosity function (RLF) measurements. The new element is in Section 5, where mock samples constructed from the T-RECS catalogue are used to forecast SKA AA4 performance. The paper claims that broad-frequency SED fitting reduces the median rest-frame 1.4 GHz luminosity estimate from 5.16×10^22 W Hz^-1 (fixed α=0.70) to 1.57×10^22 W Hz^-1 (full 150 MHz–20 GHz fit), lowers the scatter from 0.70 to 0.54 dex, shifts the high-redshift RLF by up to ~1 dex, and thus 'provides a plausible explanation' for the MeerKAT DEEP2 SFRD excess reported by Matthews et al. (2024). It also forecasts deep SKA AA4 constraints on the RLF out to z~5.
Significance. The review portions of the chapter are valuable: they bring together independent multi-frequency observations (LOFAR, uGMRT, MeerKAT, VLA) showing spectral curvature and redshift-dependent spectral indices, and they make a strong case that fixed-slope k-corrections introduce systematic biases in radio SFRD measurements. The authors also deserve credit for explicitly acknowledging several limitations of their mock forecasts in §5.1.2 and §5.3, including the absence of flux uncertainties, contamination by radio-quiet AGN, and the absence of a stable luminosity-function framework for integrated mid-radio luminosities. If the quantitative forecast were robust, it would strengthen the rationale for SKA AA4's broad-band design and would help reconcile radio- and UV/IR-based cosmic SFRD estimates. However, because the headline numbers are inherited from the SED model built into the T-RECS mock catalogue rather than calibrated against independent data, the quantitative reach of the forecast is currently more limited than the presentation suggests.
major comments (4)
- [§5.1.3–5.1.4] The central quantitative result—median L_1.4 dropping from 5.16×10^22 to 1.57×10^22 W Hz^-1, scatter 0.70→0.54 dex, and RLF offsets up to ~1 dex—is effectively inherited from the T-RECS mock catalogue. T-RECS was constructed with curved radio SEDs, including the low-frequency flattening that the full SED fit recovers. The direction of the suppression is independently supported by observed spectral curvature (An et al. 2021, 2024; Tabatabaei et al. 2025), but the factor-of-three median shift and the ~1 dex RLF shift are not calibrated against observed SED-shape distributions. The word 'illustrative' appears in §5.1.2, yet the abstract and §5.1.3 present these numbers as SKA AA4's expected performance. Please add robustness tests varying the T-RECS SED prescription (e.g., turnover frequency, spectral-index distribution, redshift evolution) and/or calibrate the SED-shape distribution to the
- [§5.1.2–5.1.3] The mock catalogue has no measurement uncertainties, but the analysis applies a Bayesian SED fit to the tabulated flux densities and quotes scatter values as if they were forecast uncertainties. With noise-free fluxes, the 'Bayesian' fit reduces to a deterministic inversion of the catalogue's SED model, and the quoted scatter reflects the spread of input SED shapes, not the measurement scatter SKA AA4 will deliver. To support the claim that broad-band SED fitting reduces scatter from 0.70 to 0.54 dex as an observational forecast, the authors should inject realistic per-band noise (including calibration and confusion) and then evaluate the recovered luminosities and their uncertainties.
- [§5.1.2, §5.3] The T-RECS sfgsdeepcatalogue includes radio-quiet AGN, but the analysis treats all sources as SFGs because the catalogue lacks the information needed to separate them. The paper notes this caveat, but it does not propagate the effect into the RLF and SFRD forecasts. Since the high-redshift samples are exactly where AGN contamination is hardest to identify (see Fig. 10), the contamination could be a load-bearing systematic for the claimed z~5 RLF constraints. Please quantify the fraction of RQ AGN in the selected mock samples and demonstrate that the conclusions survive either by removing these sources using the full T-RECS information or by applying a statistical correction.
- [§5.3 (final bullet)] The chapter explicitly states that LF parameterisations used for monochromatic radio luminosities do not yield stable results when applied to integrated MRC luminosities. This is an important limitation, because Eq. (3) identifies MRC as the preferred SFR tracer, yet the cosmic SFH forecasts in §5.2 are based on monochromatic L_1.4 RLFs. The chain from broad-band SED fitting to improved cosmic SFH is therefore incomplete: the better SFR tracer (MRC) is not used in the final SFH forecast. Please either develop a stable MRC-LF framework (even in a simplified form) or state explicitly that the SFH forecasts remain tied to L_1.4 and that an MRC-based SFH framework is required to capitalise on the SED-fitting advantage.
minor comments (3)
- [§5.1.2 / Table 2] The survey parameters are referenced to 'Table 2 and Figure 6 of Prandoni et al. (2026)' but are not reproduced. Since the forecast results depend directly on these assumed depths and areas, including the key numbers in this chapter would improve readability and reproducibility.
- [§2, Eq. (1)] The symbols S(0), SFR(0), and D(0) are not all defined in the text immediately surrounding Eq. (1). A short definition of D(0) as the luminosity distance of the z≈0 analogue would help.
- [Figure 8 caption] The legend entries 'log(L1.4) with α = 0.7 3σ' and 'log(L1.4) with αLow−Mid 3σ' are ambiguous; it would be clearer to state explicitly that the shaded bands represent 3σ confidence intervals of the maximum-likelihood fits.
Circularity Check
No significant circularity: the SKA AA4 forecasts are explicitly mock-based and illustrative, not empirical derivations, and the empirical anchors (low-frequency flattening, MRC-SFR calibration) are independent observational results.
full rationale
The quantitative claims in §5.1.3–§5.1.4 (median L_1.4 dropping from 5.16e22 to 1.57e22 W/Hz and ~1 dex RLF shifts) are obtained by applying k-correction methods to the T-RECS mock catalogue. This is a simulation-based forecast, not a first-principles derivation about the sky. The paper explicitly states that 'the mock-catalogue-based forecasts presented in this section should be interpreted as illustrative predictions... rather than as precise predictions of the final SKA AA4 constraints' (§5.1.2). No fitted parameter is renamed as a prediction: the fixed-α vs SED-fit comparison is a controlled experiment on mock data, designed to show how much the choice of spectral model matters. The direction of the effect is anchored to independent observational evidence for low-frequency flattening (An et al. 2021, 2024), and the MRC-SFR calibration rests on the externally falsifiable MIGHTEE-COSMOS analysis (Tabatabaei et al. 2025). Overlap of some co-authors with those cited papers is normal scientific self-citation and does not make the cited observational results circular. The acknowledged limitation that T-RECS may not represent the true high-z SED distribution is a model-dependence caveat, not circularity. No equation in the paper reduces to its own inputs; therefore the circularity score is 0.
Axiom & Free-Parameter Ledger
free parameters (4)
- Fixed spectral index alpha=0.70 =
0.70
- LADE evolution parameters p1, p2, k1, k2 =
not quoted
- Local RLF parameters (Phi*, L*, beta, sigma) =
not quoted
- MRC-SFR calibration (Eq. 3) =
normalization 10^(0.38±0.10), slope 1.00±0.04
axioms (5)
- domain assumption Flat LCDM cosmology with H0=67.27 km/s/Mpc, Omega_m=0.32, Omega_Lambda=0.68 (Planck 2016)
- domain assumption Radio SEDs of SFGs are composed of synchrotron and free-free emission, with curvature from free-free absorption and spectral ageing
- domain assumption T-RECS mock catalogue faithfully represents the radio source population (SED shapes, counts, redshift evolution)
- domain assumption LADE model (Eq. 5) with luminosity evolution f(z) and density evolution g(z) describes the RLF over 0<z<5
- domain assumption SKA AA4 survey parameters from Prandoni et al. (2026) are achievable (sensitivities, areas, confusion limits)
read the original abstract
As a tracer of massive star formation unaffected by dust, the radio continuum emission provides a unique window into the formation of the first stars and galaxies in the Universe. Recent observations show that the integrated rest-frame mid-radio (~1-10 GHz) luminosity of galaxies serves as one of the most robust tracers of the star formation rate (SFR). These studies further demonstrate that the synchrotron spectral index and the shape of the radio spectral energy distribution (SED) evolves with redshift as a consequence of the cosmic evolution of star formation activity. These findings underscore the importance of deep multi-band radio continuum observations in calibrating the SFR of early galaxies and understanding the astrophysical processes governing their assembly and evolution over cosmic time. This chapter presents recent progress in radio SFR calibrations for star-forming galaxies (SFGs) and reviews radio-continuum studies of the cosmic star formation history (SFH). We highlight the transformative potential of SKA AA4, whose broad frequency coverage and high sensitivity will enable well-constrained radio SEDs for SFGs across a wide redshift range.
Figures




Reference graph
Works this paper leans on
-
[5]
doi: 10.1088/0004-637X/803/2/51. R. Beck.A&ARv, 24:4, Dec
-
[6]
doi: 10.1007/s00159-015-0084-4. P. S. Behroozi, R. H. Wechsler, and C. Conroy.ApJ, 770(1):57, June
-
[10]
doi: 10.1051/0004-6361/202141286. R. Bouwens et al.ApJ, 902(2):112, Oct
-
[12]
doi: 10.1088/0004-637X/803/1/34. D. Calzetti et al.ApJ, 714(2):1256–1279, May
-
[16]
doi: 10.1111/j.1365-2966.2010.16534.x. R. K. Cochrane et al.MNRAS, 523(4):6082–6102, Aug
arXiv 2010
-
[17]
doi: 10.1093/mnras/stad1602. J. J. Condon.ARA&A, 30:575–611, Jan
-
[19]
doi: 10.1093/mnras/stae1215. G. De Zotti et al.A&A, 689:A272, Sept
-
[20]
doi: 10.1051/0004-6361/202449313. J. Delhaize et al.A&A, 602:A4, June
-
[22]
doi: 10.1051/0004-6361/201629367. I. Delvecchio et al.A&A, 647:A123, Mar
-
[23]
doi: 10.1051/0004-6361/202039647. S. Dey et al.ApJ, 938(2):152, Oct
-
[26]
doi: 10.1093/mnras/stw3088. A. Enia et al.ApJ, 927(2):204, Mar
-
[27]
doi: 10.3847/1538-4357/ac51ca. M. Fernández-Torreiro et al.MNRAS, 527(4):11945–11961, Feb
-
[28]
doi: 10.1093/mnras/ stad3145. T. J. Galvin et al.MNRAS, 474:779–799, Feb
-
[29]
doi: 10.1093/mnras/stx2613. F. Gao, T. Wang, and Y. Wang.A&A, 694:A261, Feb
-
[31]
doi: 10.1093/mnras/stac1393. S. M. L. Greis et al.MNRAS, 470(1):489–499, Sept
-
[32]
doi: 10.1093/mnras/stx1252. J. A. Grundy et al.PASA, 42:e002, Jan
-
[33]
doi: 10.1017/pasa.2024.119. C. Gruppioni et al.MNRAS, 432(1):23–52, June
-
[35]
25 SFH through SED & non-thermal emission An, Tabatabaei, Seymour et al
doi: 10.1093/mnras/stae2528. 25 SFH through SED & non-thermal emission An, Tabatabaei, Seymour et al. M. J. Hardcastle et al.MNRAS, 462(2):1910–1936, Oct
-
[37]
doi: 10.1093/mnras/stab3202. V. Heesen et al.AJ, 147(5):103, May
-
[38]
doi: 10.1088/0004-6256/147/5/103. V. Heesen et al.arXiv e-prints, art. arXiv:2208.11068, Aug
-
[41]
doi: 10.3847/1538-4357/aba044. F.-Y. Liu et al.MNRAS, 545(2):staf1961, Jan
-
[43]
doi: 10.1051/0004-6361/201424937. C. Mancuso et al.ApJ, 810(1):72, Sept
-
[44]
doi: 10.1088/0004-637X/810/1/72. J. Marvil, F. Owen, and J. Eilek.AJ, 149(1):32, Jan
-
[45]
doi: 10.1088/0004-6256/149/1/32. A. M. Matthews, J. J. Condon, W. D. Cotton, and T. Mauch.ApJ, 914(2):126, June
-
[46]
doi: 10.3847/1538-4357/abfaf6. A. M. Matthews et al.ApJ, 966(2):194, May
-
[47]
F.Mazoochi,R.Karimi,M.H.ZhoolidehHaghighi,andF.S.Tabatabaei.MNRAS,548(4):stag627, June
doi: 10.3847/1538-4357/ad3912. F.Mazoochi,R.Karimi,M.H.ZhoolidehHaghighi,andF.S.Tabatabaei.MNRAS,548(4):stag627, June
-
[48]
doi: 10.1093/mnras/stag627. D. C. Molnár et al.MNRAS, 504(1):118–145, June
-
[49]
doi: 10.1093/mnras/stab746. E. J. Murphy.ApJ, 706(1):482–496, Nov
-
[51]
doi: 10.1088/0004-637X/737/2/67. E. J. Murphy et al.ApJ, 839(1):35, Apr
-
[52]
doi: 10.3847/1538-4357/aa62fd. M. R. Nasirzadeh et al.A&A, 691:A199, Nov
-
[53]
doi: 10.1051/0004-6361/202451110. M. Novak et al.A&A, 602:A5, June
-
[54]
doi: 10.1051/0004-6361/201629436. E. F. Ocran et al.MNRAS, 491(4):5911–5924, Feb
-
[55]
M.J.PageandF.J.Carrera.MNRAS,311(2):433–440,Jan.2000
doi: 10.1093/mnras/stz3401. M.J.PageandF.J.Carrera.MNRAS,311(2):433–440,Jan.2000. doi: 10.1046/j.1365-8711.2000. 03105.x. F. Panessa et al.Nature Astronomy, 3:387–396, Apr
arXiv 2000
-
[56]
Planck Collaboration et al.A&A, 594:A13, Sept
doi: 10.1038/s41550-019-0765-4. Planck Collaboration et al.A&A, 594:A13, Sept
-
[57]
26 SFH through SED & non-thermal emission An, Tabatabaei, Seymour et al
doi: 10.1051/0004-6361/201525830. 26 SFH through SED & non-thermal emission An, Tabatabaei, Seymour et al. I. Prandoni et al. InAdvancing Astrophysics with the SKA – II (AASKAII)
-
[58]
doi: 10.1093/mnras/stv3020. B. Robertson et al.ApJ, 970(1):31, July
-
[59]
doi: 10.3847/1538-4357/ad463d. J. Sabater et al.A&A, 622:A17, Feb
-
[60]
doi: 10.1051/0004-6361/201833883. W. Saunders et al.MNRAS, 242:318–337, Jan
-
[61]
A.M.M.Scaifeetal.MNRAS,406(1):L45–L49,July2010
doi: 10.1093/mnras/242.3.318. A.M.M.Scaifeetal.MNRAS,406(1):L45–L49,July2010. doi: 10.1111/j.1745-3933.2010.00878. x. M. Schmidt.ApJ, 151:393, Feb
arXiv 2010
-
[63]
doi: 10.3847/2041-8213/ab3c63. N. Seymour et al.ApJ, 998(2):306, Feb
-
[64]
doi: 10.3847/1538-4357/ae3a7d. W. Silima et al.MNRAS, 544(1):799–814, Nov
-
[65]
doi: 10.1093/mnras/staf1698. F. Sun et al.ApJ, 980(1):12, Feb
-
[66]
doi: 10.3847/1538-4357/ad9d0e. F. Sweijen et al.A&A, 658:A3, Feb
-
[67]
doi: 10.1051/0004-6361/202039871. F. Tabatabaei et al.ApJ, 989(1):44, Aug
-
[68]
doi: 10.3847/1538-4357/ade233. F. S. Tabatabaei and E. M. Berkhuijsen.A&A, 517:A77, July
-
[69]
doi: 10.1051/0004-6361/ 200913593. F. S. Tabatabaei et al.A&A, 475(1):133–143, Nov
-
[71]
doi: 10.1051/0004-6361/201220249. F. S. Tabatabaei et al.ApJ, 836(2):185, Feb
-
[72]
doi: 10.3847/1538-4357/836/2/185. F. S. Tabatabaei et al.MNRAS, 517(2):2990–3007, Dec
-
[73]
doi: 10.1093/mnras/stac2514. M. Talia et al.ApJ, 909(1):23, Mar
-
[74]
doi: 10.3847/1538-4357/abd6e3. N. J. Thykkathu et al.MNRAS, 548(3):stag616, May
-
[75]
doi: 10.1093/mnras/stag616. K. Tisanić et al.A&A, 621:A139, Jan
-
[76]
doi: 10.1051/0004-6361/201834002. D. van der Vlugt et al.ApJ, 941(1):10, Dec
-
[77]
doi: 10.3847/1538-4357/ac99db. S. Verley, E. Corbelli, C. Giovanardi, and L. K. Hunt.A&A, 493(2):453–466, Jan
-
[78]
doi: 10.1051/0004-6361:200810566. T. Wang et al.ApJ, 816(2):84, Jan
-
[79]
doi: 10.3847/0004-637X/816/2/84. T. Wang et al.Nature, 572(7768):211–214, Aug
-
[80]
doi: 10.1038/s41586-019-1452-4. T. Wang et al.ApJL, 988(1):L35, July
-
[81]
27 SFH through SED & non-thermal emission An, Tabatabaei, Seymour et al
doi: 10.3847/2041-8213/adebe7. 27 SFH through SED & non-thermal emission An, Tabatabaei, Seymour et al. W. Wang, Z. Yuan, H. Yu, and J. Mao.A&A, 683:A174, Mar. 2024a. doi: 10.1051/0004-6361/ 202347746. W. Wang et al.ApJ, 997(2):176, Feb
-
[82]
doi: 10.3847/1538-4357/ae2474. Y. Wang et al.A&A, 685:A79, May 2024b. doi: 10.1051/0004-6361/202347787. I. H. Whittam et al.MNRAS, 543(1):507–517, Oct
-
[83]
doi: 10.1093/mnras/staf1505. T. Yang et al.ApJL, 1000(2):L42, Apr
-
[84]
doi: 10.3847/2041-8213/ae4803. I. Yoon et al. InAdvancing Astrophysics with the SKA – II (AASKAII)
-
[85]
doi: 10.3847/1538-4365/ab855b. Z. Yuan et al.ApJSS, 260(1):10, May
-
[86]
doi: 10.3847/1538-4365/ac596a. J. A. Zavala et al.ApJ, 909(2):165, Mar
-
[87]
doi: 10.3847/1538-4357/abdb27. 28
-
[1968]
doi: 10.1086/149446. B. Sebastian and O. Bait.ApJL, 882(2):L19, Sept
-
[1990]
doi: 10.1093/mnras/245.1.101. M. S. Clemens, A. Scaife, O. Vega, and A. Bressan.MNRAS, 405(2):887–897, June
-
[1992]
doi: 10.1146/annurev.aa.30.090192.003043. R. H. W. Cook et al.MNRAS, 531(1):708–727, June
-
[2003]
doi: 10.1086/367829. M. L. Bernet et al.Nature, 454(7202):302–304, July
-
[2006]
doi: 10.1086/506610. A. Karim et al.ApJ, 730(2):61, Apr
-
[2007]
doi: 10.1051/0004-6361:20078174. F. S. Tabatabaei et al.A&A, 552:A19, Apr
-
[2008]
doi: 10.1038/nature07105. A. Bonaldi et al.MNRAS, 482(1):2–19, Jan
-
[2009]
doi: 10.1088/0004-637X/706/1/482. E. J. Murphy et al.ApJ, 737(2):67, Aug
-
[2010]
doi: 10.1088/0004-637X/714/2/1256. C. M. Casey, D. Narayanan, and A. Cooray.Phys. Rep., 541(2):45–161, Aug
-
[2011]
doi: 10.1088/0004-637X/730/2/61. R. C. Kennicutt and N. J. Evans.ARA&A, 50:531–608, Sept
-
[2013]
doi: 10.1093/mnras/stt308. C. L. Hale et al.MNRAS, 536(3):2187–2211, Jan
-
[2014]
doi: 10.1016/ j.physrep.2014.02.009. X. Chi and A. W. Wolfendale.MNRAS, 245:101, July
2014
-
[2015]
doi: 10.22323/1.215.0071. H. S. B. Algera et al. InAdvancing Astrophysics with the SKA – II (AASKAII)
-
[2016]
doi: 10.1093/mnras/stw1763. H. Hassani et al.MNRAS, 510(1):11–31, Feb
-
[2017]
doi: 10.1051/0004-6361/201629430. I. Delvecchio et al.A&A, 602:A3, June
-
[2018]
doi: 10.1093/mnras/stx2728. J. S. Dunlop et al.MNRAS, 466(1):861–883, Apr
-
[2019]
24 SFH through SED & non-thermal emission An, Tabatabaei, Seymour et al
doi: 10.1093/mnras/sty2603. 24 SFH through SED & non-thermal emission An, Tabatabaei, Seymour et al. M. Bonato et al.A&A, 656:A48, Dec
discussion (0)
Sign in with ORCID, Apple, or X to comment. Anyone can read and Pith papers without signing in.