REVIEW 4 major objections 6 minor 36 references
Adaptive demand-driven control lets PCM storage cut district-heating peaks without creating new ones, but payback stays long.
Reviewed by Pith at T0; open to challenge. T0 means a machine referee read the full paper against a public rubric. the ladder, T0–T4 →
T0 review · grok-4.5
2026-07-31 12:23 UTC pith:7UX53BRB
load-bearing objection Solid campus-scale sim showing headroom/overload PCM control beats schedule RBC on peak shape; numbers rest on an unvalidated model and a same-day peak threshold. the 4 major comments →
Adaptive Demand-Driven Energy Management of PCM-Integrated District Heating Systems: Operational Flexibility and Techno-Economic Assessment
The pith
A machine-rendered reading of the paper's core claim, the machinery that carries it, and where it could break.
Core claim
Under a dynamic campus district-heating model, adaptive demand-driven (ADD) control of a PCM tank—charging only when network headroom exists and discharging only when load exceeds a daily threshold—smooths city-network heat extraction and delivers roughly 5.3 percent peak reduction in a winter comparison (up to 11.3 percent annualized) without secondary charging peaks or loss of indoor comfort, outperforming fixed-schedule rule-based control; a melting point near 80 °C and conductivity above 2 W/(m·K) further improve results, yet simple payback remains about 25 years.
What carries the argument
Adaptive demand-driven (ADD) PCM control: daily peak threshold plus headroom-limited charging and overload-limited discharging (with candidate time windows retained only as soft bounds), coupled to an effective-heat-capacity shell-and-tube PCM model inside a full campus DH–heat-pump–building simulation.
Load-bearing premise
The unvalidated end-to-end dynamic simulation is assumed accurate enough that its peak-reduction and payback numbers would hold on the real campus plant.
What would settle it
Instrument the real campus main substation and a pilot PCM tank under both schedule-based and ADD logic for one winter and check whether measured city-network peak (average of three highest) falls by roughly 5–11 percent without new off-peak spikes or comfort loss.
If this is right
- Fixed time-of-day charging of PCM storage can raise, rather than lower, the billed peak and should not be treated as a default control layer.
- PCM selection for DH should prioritize melting temperature match (~70–80 °C) and conductivity ≳2 W/(m·K) over simply maximizing latent heat.
- Under present demand-charge structures the storage investment alone is unlikely to pay back inside a typical project life without material-cost cuts or stronger flexibility tariffs.
- Headroom- and overload-aware logic can be layered on existing weather-compensated DH controls without requiring full model-predictive infrastructure.
Where Pith is reading between the lines
- If dynamic network tariffs begin to reward continuous load flattening rather than only the three highest monthly peaks, the same ADD–PCM package would become far more bankable than the 25-year figure suggests.
- The same headroom/overload logic could be ported to other low-temperature TES media or to multi-building clusters once local mass-flow and return-temperature measurements exist.
- Because latent-heat capacity showed only marginal system-level gains once conductivity and melt temperature were adequate, future material R&D for DH may yield higher returns from heat-transfer enhancement than from enthalpy alone.
Editorial analysis
A structured set of objections, weighed in public.
Referee Report
Summary. This paper develops a dynamic Python simulation of a campus-scale two-stage district heating (DH) network in Trondheim with heat-pump recovery of data-centre waste heat and a shell-and-tube PCM storage tank. It compares a baseline weather-compensated system, a schedule-based rule-based PCM controller (RBC), and a proposed adaptive demand-driven (ADD) controller that charges only under network headroom and discharges only under overload relative to a daily peak threshold. Performance is assessed via peak DH extraction (average of the three highest peaks), operating cost under energy-plus-demand tariffs, indoor comfort, and HP COP, with sensitivity on PCM phase-change temperature, latent heat, and thermal conductivity, plus a CAPEX/payback analysis. The central claim is that ADD smooths city-network heat extraction, avoids RBC charging peaks, and delivers about 5.3% peak reduction in a 31-day winter window and up to 11.3% annualized peak reduction with ~1.4% operating-cost savings, at a simple payback of 25.3 years; recommended PCM settings are Tm ≈ 80 °C and k ≳ 2 W/(m·K).
Significance. If the quantitative peak-shaving and cost results transfer beyond the unvalidated plant model, the work is a useful systems-level contribution: it couples PCM thermophysics with a practical (non-MPC) control layer and shows that control design can dominate storage hardware for demand-charge reduction. The explicit baseline/RBC/ADD comparison under shared weather and comfort checks, the temperature-distribution diagnostics that explain Tm and k trends, and the frank 25.3-year payback are strengths. The ADD logic (headroom-limited charge, overload-limited discharge) is a clear, implementable idea for DH operators. Significance is currently limited by the lack of integrated model validation and by an oracle daily threshold that uses same-day maximum demand, so the headline 5.3%/11.3% figures should be treated as model-internal until those issues are addressed.
major comments (4)
- [§2.3, Eqs. 3–22; §4.1; Table 5] The end-to-end plant (effective-heat-capacity PCM PDE Eqs. 5–6, semi-empirical HP map Eq. 3/Fig. 3, lumped RC building/radiators Eqs. 11–17, energy balances Eqs. 18–22) has no integrated experimental or operational validation against the Trondheim campus. Only component-level literature is cited. Because the central claims (5.3% winter peak cut in Fig. 9; 11.3% annualized in Table 5; 25.3-year SPP) are entirely simulation deltas in Q_DH and cost, the manuscript needs either (i) validation of key trajectories (substation heat rates, HP COP, storage inlet/outlet temperatures) against campus data or a published benchmark, or (ii) a structured uncertainty/bias analysis showing how peak and payback move under plausible model error. Without this, transferability of the quantitative results remains unestablished.
- [§3.3, Eqs. 23–28; Table 3] The ADD daily threshold is Q_th,d = (1−α_sh) Q_daily,max,d with α_sh = 15% (Eq. 23, Table 3). Q_daily,max,d is the same day’s reference maximum and is therefore not available to a causal online controller. Headroom charging (Eqs. 24, 27) and overload discharge (Eqs. 25, 28) can look artificially well-timed under this oracle. Please replace or stress-test with a causal threshold (e.g., previous-day peak, rolling percentile, or day-ahead forecast with error) and report how the 5.3%/11.3% peak reductions and secondary-peak avoidance change. If the oracle is retained only as an upper bound, state that explicitly and demote the online-performance claim.
- [§4.1.2 Fig. 9; §4.3 Table 5; Eqs. 21–22, 29–36] Peak reduction is reported as ~5.3% for the 31-day winter comparison (Fig. 9, abstract) but 11.3% annualized (Table 5), with annual peak loads 98.3 → 87.2 MW. The annualization method is not described (scaling of the 31-day window? full-year weather? different peak definition?). Clarify the procedure, reconcile the two figures, and state which metric supports the techno-economic cash flows (S_ann, SPP 25.3 years). Inconsistent peak metrics undermine the load-bearing economic claim.
- [§2.2 Eqs. 1–2; §3.3 Table 3; §4.2] Storage sizing uses a target excess energy above a threshold (Eqs. 1–2) with utilization factor η_u, while ADD is tuned with α_sh = 15% and 2 MW charge/discharge caps (Table 3), yet realized winter peak reduction is only 5.3%. Please report achieved shifted energy versus E_target, average state-of-charge / latent-heat utilization under ADD, and whether under-performance is due to thermal conductivity, temperature mismatch, or the headroom logic. Without utilization metrics, the sensitivity conclusions on Tm and k (Figs. 10–15) are harder to interpret at system level.
minor comments (6)
- [Nomenclature; §3.4; Fig. 16] Nomenclature lists DPP (discounted payback period) but the main text and Table 5 emphasize SPP; Fig. 16 uses DPP. Define DPP explicitly alongside SPP and state the discount rate(s) used in Fig. 16.
- [Fig. 8] Fig. 8 encoding appears corrupted in the manuscript source (unicode private-use sequences), which harms readability of the key load-profile comparison. Ensure a clean vector figure in revision.
- [Abstract; §5] Abstract says “up to 5.3% peak-load reduction” while conclusions lead with 11.3% annualized; align abstract, §4, and §5 on which figure is primary.
- [Table 1; §2.3.3] Table 1 lists building heated volume 1,054,600 m³ and very large envelope capacitance; briefly justify that these represent the full campus aggregate rather than a single building, since §2.3.3 says “a representative building is considered as the campus heating demand.”
- [§2.3.1 Eq. 3] HP fit (Eq. 3) coefficients a–g are not tabulated; providing them (or a data/code supplement) would aid reproducibility.
- [Abstract; References] Minor language/typos: “Latent heat thermalenergy storage”, “peak load reduction” vs “peak-load”, and arXiv dates in references (e.g., 2026) should be checked for consistency before publication.
Circularity Check
No circularity: peak-shave and cost claims are open-loop simulation outputs against explicit baselines, not algebraically forced by fitted targets or self-citation.
full rationale
The paper’s load-bearing claims (ADD vs baseline/RBC peak reduction, operating-cost deltas, payback) are obtained by running a dynamic plant model and comparing simulated city-DH heat-rate trajectories under three control laws. Peak metrics are defined post hoc from the three highest simulated peaks (Eqs. 21–22) and costs from external tariffs (Eq. 29); neither quantity is fitted to match a target outcome. The control parameter α_sh = 15% only sets the daily headroom/overload threshold (Eq. 23); realized reductions (≈5.3% winter, 11.3% annualized) differ from that setpoint, so the headline percentages are not the threshold by construction. The semi-empirical HP map (Eq. 3) is fitted to prior operational data and used as a fixed plant input, not as a renamed prediction of peak shave. PCM sizing (Eqs. 1–2) and property sensitivities are design/parameter studies, not circular predictions. Citations support component models and cost factors; none import a uniqueness theorem or ansatz that forces the central ADD result. Model-validation risk is real but is a correctness/transfer issue, not circularity of the derivation chain.
Axiom & Free-Parameter Ledger
free parameters (7)
- Peak-load reduction target α_sh =
0.15
- Maximum charging/discharging power =
2 MW
- HP performance-map coefficients a–g =
not reported numerically
- Effective storage utilization factor η_u
- PCM volume fraction f_PCM =
55%
- CAPEX factors f_tank, f_BOP, f_inst, f_main and c_PCM =
c_PCM=1.0 €/kg; f_tank=30%; f_BOP=15%; f_inst=20%; f_main=2%
- Peak definition window (top-3 average) =
mean of three highest peaks
axioms (5)
- domain assumption Effective heat-capacity method adequately represents PCM melting/solidification and tank heat rates for system-level control comparison.
- domain assumption Lumped RC building + segmented radiator model reproduces campus heat demand and comfort under weather-compensated control.
- domain assumption City DH energy and peak-demand tariffs are 0.060 EUR/kWh and 3.25 EUR/kW·month and dominate operating-cost differences.
- ad hoc to paper Candidate charge window 20:00–05:00 and discharge window 05:00–20:00 are appropriate operational constraints for ADD.
- standard math Standard continuum energy balances and PI weather-compensated plant control hold for the two-stage campus network.
invented entities (1)
-
Adaptive demand-driven (ADD) PCM control policy
no independent evidence
read the original abstract
Latent heat thermal energy storage (LHTES) using phase change materials (PCMs) is a promising solution to shifting heat supply and reducing peak demand in district heating (DH). However, the combined impacts of PCM thermophysical properties and practical control strategies on DH system-level operational and economic performance remain insufficiently understood. To bridge the research gap, this study investigates a PCM-integrated DH system with heat pump assisted waste heat recovery under an adaptive demand-driven (ADD) control strategy to enhance operational flexibility. A dynamic simulation model was developed and the system performance was evaluated against a baseline case and a rule-based control (RBC) approach based on peak-load reduction, operational cost, heat pump performance, and indoor thermal comfort. Furthermore, sensitivity analyses were conducted to examine the influence of PCM thermophysical properties on system performance. The results showed that the RBC can shift peak demand but tends to generate secondary peaks during charging periods. In contrast, the ADD strategy effectively smoothed the heat demand profile and achieved up to 5.3% peak-load reduction while maintaining thermal comfort. Sensitivity analysis revealed that a phase-change temperature of 80$^\circ$C and thermal conductivity above 2 W/(m$\cdot$K) achieved a higher peak-load reduction and improved economic performance. Despite the enhanced peak-shaving capability achieved by the proposed control strategy, the system exhibited a payback period of 25.3 years, indicating that further cost reductions and supportive market incentives are required. Nevertheless, the proposed approach provides significant potential for enhancing DH flexibility and supporting the transition toward future low-carbon energy systems.
Figures


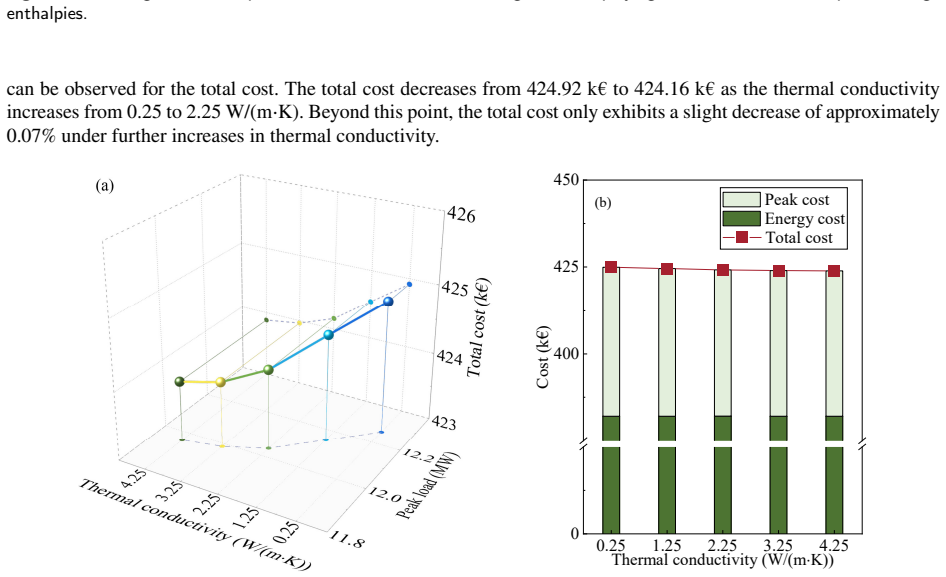


Reference graph
Works this paper leans on
- [1]
- [2]
-
[3]
Y. Ding, T. O. Timoudas, Q. Wang, S. Chen, H. Brattebø, N. Nord, A study on data-driven hybrid heating load prediction methods in low- temperature district heating: An example for nursing homes in nordic countries, Energy Conversion and Management 269 (2022) 116163. doi:10.1016/j.enconman.2022.116163
arXiv 2022
-
[4]
URLhttps://www.ssb.no/en/energi-og-industri/energi/statistikk/fjernvarme-og-fjernkjoling
Statistics Norway (SSB), District heating and district cooling, updated 12 May 2026, accessed 18 Jun 2026 (2026). URLhttps://www.ssb.no/en/energi-og-industri/energi/statistikk/fjernvarme-og-fjernkjoling
2026
-
[5]
E.Guelpa,G.Barbero,A.Sciacovelli,V.Verda,Peak-shavingindistrictheatingsystemsthroughoptimalmanagementofthethermalrequest of buildings, Energy 137 (2017) 706–714.doi:10.1016/j.energy.2017.04.083
-
[6]
J. Hou, H. Li, N. Nord, G. Huang, Model predictive control for a university heat prosumer with data centre waste heat and thermal energy storage, Energy 267 (2023) 126579.doi:10.1016/j.energy.2022.126579. Jin et al.:Preprint submitted to ElsevierPage 23 of 25
arXiv 2023
- [7]
- [8]
-
[9]
W.Delgado-Díaz,W.Villasmil,M.Troxler,R.Hijwegen,R.Hendry,U.Schilt,P.Roos,R.Ravotti,A.Stamatiou,S.Haussener,J.Worlitschek, Optimization of hybrid sensible-latent seasonal heat storage systems, Applied Energy 399 (2025) 126235.doi:10.1016/j.apenergy. 2025.126235
arXiv 2025
-
[10]
U. Trabert, F. Pag, J. Orozaliev, U. Jordan, K. Vajen, Peak shaving at system level with a large district heating substation using deep learning forecasting models, Energy 301 (2024) 131690.doi:10.1016/j.energy.2024.131690
arXiv 2024
-
[11]
H. Wan, Y. Gong, C. Dang, S. Wang, G. Huang, Power control of latent heat thermal energy storage units using a model-based predictive strategy, Applied Energy 382 (2025) 125220.doi:10.1016/j.apenergy.2024.125220
arXiv 2025
-
[12]
S.Agrebi,B.Tashtoush,A.Guizani,Performanceanalysisofhelicalcoilheatexchangersforlatentheatthermalstorageinsolarapplications, Energy Conversion and Management 343 (2025) 120205.doi:10.1016/j.enconman.2025.120205
arXiv 2025
-
[13]
O. Kazaz, E. Abu-Nada, Latent heat-assisted thermal management of a metal hydride hydrogen storage reactor using novel shape-stabilized composite phase change material slurry, Energy Conversion and Management 350 (2026) 121000.doi:10.1016/j.enconman.2025. 121000
-
[14]
M.Kollmar,A.Bürger,M.Bohlayer,A.Altmann-Dieses,M.Braun,M.Diehl,Adetailedsimulationmodelforfifthgenerationdistrictheating andcoolingnetworkswithseasonallatentstorageevaluatedonfielddata,AppliedEnergy401(2025)126757.doi:10.1016/j.apenergy. 2025.126757
arXiv 2025
- [15]
-
[16]
F.Calise,F.Cappiello,L.Cimmino,F.Cuomo,M.Vicidomini,A5thgenerationdistrictheatingcoolingnetworkintegratedwithaphasechange material thermal energy storage: A dynamic thermoeconomic analysis, Applied Energy 389 (2025) 125688.doi:10.1016/j.apenergy. 2025.125688
arXiv 2025
-
[17]
M. A. Pans, V. Popov, D. O’Connor, A methodology for integrating renewable energy and thermal energy storage technologies into fourth- generation district heating networks, Renewable Energy 220 (2023) 119847.doi:10.1016/j.renene.2023.119847
arXiv 2023
-
[18]
A. Thomson, G. Claudio, The technical and economic feasibility of utilising phase change materials for thermal storage in district heating networks, Energy Procedia 159 (2019) 442–447.doi:10.1016/j.egypro.2018.12.042
-
[19]
J.Karwacki,P.Leputa,R.Kwidzinski,M.Lackowski,Effectiveenthalpyoforganicphasechangematerialappliedinathermalenergystorage cooperating with a district heating system, Renewable Energy 243 (2025) 122519.doi:10.1016/j.renene.2025.122519
arXiv 2025
-
[20]
D. Lee, H. J. Jeong, H. Y. Ji, S. Y. Park, D.-Y. Chung, C. Kang, K. M. Kim, D. Park, Peak load shifting control on hot water supplied from district heating using latent heat storage system in apartment complex, Case Studies in Thermal Engineering 34 (2022) 101993. doi:10.1016/j.csite.2022.101993
arXiv 2022
-
[21]
G.Rinaldi,A.Lazaro,M.Delgado,J.M.Marin,V.Verda,Useofalow-costphasechangematerialemulsioninde-centralizedthermalenergy storage for district heating network enlargement, Energy 306 (2024) 132517.doi:10.1016/j.energy.2024.132517
arXiv 2024
-
[22]
E. Mura, C. Bay, E. Schito, P. Conti, D. Testi, M. Raugi, Comparative analysis of model predictive control and mpc-informed rule-based control for thermal storage operation in ultra-low temperature 4th generation district heating networks, Energy Conversion and Management 356 (2026) 121241.doi:10.1016/j.enconman.2026.121241
arXiv 2026
-
[23]
D. Jayathunga, H. Karunathilake, M. Narayana, S. Witharana, Phase change material (pcm) candidates for latent heat thermal energy storage (lhtes) in concentrated solar power (csp) based thermal applications – a review, Renewable and Sustainable Energy Reviews 189 (2024) 113904.doi:10.1016/j.rser.2023.113904
arXiv 2024
-
[24]
URLhttps://joint-research-centre.ec.europa.eu/photovoltaic-geographical-information-system-pvgis_en
European Commission, Joint Research Centre, Photovoltaic geographical information system (pvgis), accessed: 2026-06-20 (2026). URLhttps://joint-research-centre.ec.europa.eu/photovoltaic-geographical-information-system-pvgis_en
2026
-
[25]
N. Nord, M. Shakerin, T. Tereshchenko, V. Verda, R. Borchiellini, Data informed physical models for district heating grids with distributed heat sources to understand thermal and hydraulic aspects, Energy 222 (2021) 119965.doi:10.1016/j.energy.2021.119965
arXiv 2021
-
[26]
Y. Tang, Q. Li, X. Zuo, H. Yang, Finite element analysis of composites for latent heat storage technology: A comprehensive review, Applied Energy 409 (2026) 127466.doi:10.1016/j.apenergy.2026.127466
arXiv 2026
-
[27]
H.Du,X.Zhou,N.Nord,Y.Carden,P.Cui,Z.Ma,Anewframeworkforevaluatingandenhancingtheperformanceofdistrictheatingsystems integratedwithdatacentresusingshort-termthermalenergystorage,Energy319(2025)134934.doi:10.1016/j.energy.2025.134934
arXiv 2025
-
[28]
Z.Xu,X.Sheng,J.Chen,Y.Chen,J.He,X.Luo,Y.Liang,Industrial-gradehydratedsalt-basedpcmthermalenergystoragedevice:Thermal and economic performances, Applied Thermal Engineering 262 (2025) 125233.doi:10.1016/j.applthermaleng.2024.125233
arXiv 2025
-
[29]
K. Mekrisuh, P. M. V. Subbarao, Annual performance and techno-economic assessment of pcm-based thermal management in photovoltaic systems, Journal of Energy Storage 138 (2025) 118520.doi:10.1016/j.est.2025.118520
arXiv 2025
-
[30]
R. D. Selvakumar, A. H. Mohammad, S. Dai, Y. Ding, A. K. Alkaabi, Economic feasibility analysis of lhtes integration with a nuclear power plant, Applied Energy 392 (2025) 126026.doi:10.1016/j.apenergy.2025.126026
arXiv 2025
-
[31]
X. Jin, F. Wu, T. Xu, G. Huang, H. Wu, X. Zhou, D. Wang, Y. Liu, A. C. Lai, Experimental investigation of the novel melting point modified phase-change material for heat pump latent heat thermal energy storage application, Energy 216 (2021) 119191.doi:10.1016/j.energy. 2020.119191
arXiv 2021
-
[32]
F. Wu, S. Cao, C. Qi, C. Sun, X. Wu, Design and evaluation of a pcm heat accumulator applied in heating substations to accommodate supply-demand mismatch in district heating system, Journal of Energy Storage 91 (2024) 111973.doi:10.1016/j.est.2024.111973
arXiv 2024
-
[33]
Jin et al.:Preprint submitted to ElsevierPage 24 of 25
P.Yan,Z.Ding,W.Wu,Coststrategy-integratedgeometryselectionofphasechangematerialmacro-capsuleforlatentthermalenergystorage, Applied Energy 402 (2025) 126883.doi:10.1016/j.apenergy.2025.126883. Jin et al.:Preprint submitted to ElsevierPage 24 of 25
arXiv 2025
-
[34]
R.Jayabal,B.Nagappan,S.P.Jena,A.Tiwari,V.K.Raju,A.Kushwah,G.Gulothungan,A.Smerat,K.Priya,Hybridsolar-pcmenergystorage systems: Design optimization, thermal management, performance benchmarking, and techno-economic perspectives, Results in Engineering 30 (2026) 111193.doi:10.1016/j.rineng.2026.111193
arXiv 2026
-
[35]
H. Wu, X. Hao, Economic optimization of heat transfer enhancement techniques in pcm-based solar–hydrogen storage systems, Journal of Energy Storage 171 (2026) 122494.doi:10.1016/j.est.2026.122494
arXiv 2026
-
[36]
P. Llorach-Massana, J. Peña, J. Rieradevall, J. I. Montero, Analysis of the technical, environmental and economic potential of phase change materials (pcm) for root zone heating in mediterranean greenhouses, Renewable Energy 103 (2017) 570–581.doi:10.1016/j.renene. 2016.11.040. Jin et al.:Preprint submitted to ElsevierPage 25 of 25
doi:10.1016/j.renene 2017
discussion (0)
Sign in with ORCID, Apple, or X to comment. Anyone can read and Pith papers without signing in.