REVIEW 3 major objections 4 minor 57 references
Robust and Explainable Detector of Time Series Anomaly via Augmenting Multiclass Pseudo-Anomalies
T0 review · 3 major / 4 minor · reviewed 2026-08-07 · deepseek-v4-flash
Pith's one-line read RedLamp claims that multiclass pseudo-anomaly classification with backward-corrected soft labels makes unsupervised time series anomaly detection more accurate and more resistant to contaminated training data than normality-based or…
desk verdict RedLamp is a genuine methodological contribution with a broad, well-ablated benchmark, but its headline robustness claim only tests in-family contamination and needs re-framing or a supplementary experiment. read the letter →
The pith
A machine-rendered reading of the paper's core claim, the machinery that carries it, and where it could break.
The reading
What carries the argument
The engine is the augmented training set: one Normal class plus 11 pseudo-anomaly classes (Spike, Flip, Speedup, Noise, Cutoff, Average, Scale, Wander, Contextual, Upsidedown, Mixture), each generated by applying a randomized transform to a training window and labeled with a one-hot vector and an anomaly mask that records where the transform was inserted. Backward correction, borrowed from label-noise learning, turns each one-hot label into a soft label that keeps most probability on its own class but reserves probability $\alpha$ for misclassification as normal and $\beta$ for confusion among anomaly classes. The anomaly mask makes the decoder train only on unmodified regions, so reconstruction error reflects abnormal content rather than the inserted augmentation. The final anomaly score is the average of the reconstruction error and an adjusted anomaly-class score, where frequent anomaly adjustment (FAA) discounts any class predicted more often than a threshold across the test set as a pseudo-normal class.
What would settle it
Contaminate UCR's training set at 5% with an anomaly shape that no one of the eleven augmentations produces (for example, a contiguous block of missing values or a slow sinusoidal baseline drift) and measure the VUS-PR drop; if it approaches CutAddPaste's 15.5% rather than RedLamp's 1.8%, the diversity-gap premise is refuted.
Extended reading notes
Core claim
On the paper's own terms, the discovery is that the diversity gap of augmentation-based anomaly detection is best narrowed not by tuning one augmentation per dataset but by generating many pseudo-anomaly types and supervising the model to separate them into multiple classes, while deliberately softening the supervision. The paper calls this the multiclass anomaly assumption and presents it as the first such formulation for time series anomaly detection. The model shares one embedding between a decoder that reconstructs only anomaly-free regions (guided by an anomaly mask) and a classifier that predicts backward-corrected soft labels, so contamination and false anomalies are treated as label noise instead of trusted supervision. At test time the anomaly score averages min-max normalized reconstruction error and an adjusted anomaly-class score that zeroes out frequently predicted pseudo-normal classes. RedLamp reports the best average VUS-PR (0.430) among the thirteen compared methods, with UCR VUS-PR of 0.492 versus 0.441 for CutAddPaste, and a 1.8% performance drop at 5% contamination versus 15.5% for CutAddPaste.
Load-bearing premise
The load-bearing premise is that the eleven hand-designed augmentations collectively cover the space of anomalies a deployment is likely to see, so filling the augmentation-defined gap also closes the gap to real anomalies; the 5% contamination experiment in the paper tests contamination from those same eleven augmentation types and therefore does not exercise this premise.
Editorial extensions
If this is right
- Augmentation-based time series anomaly detection should be formulated as multiclass classification with explicit label-noise modeling rather than binary boundary learning; RedLamp's sensitivity experiment shows performance rises as the number of augmentation classes grows from one to eleven.
- On average across UCR, AIOps, SMD, SMAP, and MSL, the reported VUS-PR is 0.430 versus 0.355 for the best baseline, so the multiclass boundary adds a measurable margin on precision-recall-style evaluation.
- At 5% training contamination on UCR, RedLamp's VUS-PR drops 1.8% versus 15.5% for CutAddPaste, which the paper attributes to backward-corrected soft labels absorbing the contaminated samples.
- The ablation study shows that removing the anomaly mask, backward correction, reconstruction loss, classification loss, or frequent anomaly adjustment each degrades VUS-PR, so the combined mechanism is doing the work.
- Because test anomalies cluster near specific augmentation classes in the embedding, the model can name the type of anomaly it detects, a property binary boundary methods lack.
Reading between the lines
- Beyond the paper, the diversity-gap premise predicts that robustness to contamination will shrink when contaminated anomalies are outside the eleven augmentation families; the paper's contamination experiment only mixes in those same eleven types.
- Beyond the paper, the frequent anomaly adjustment (FAA) is computed over the full test set, so an online or streaming deployment would need a sequential estimate of class frequency; the paper does not address that setting.
- Beyond the paper, the multiclass embedding offers a testable extension the paper leaves implicit: a domain operator could inspect which augmentation class a flagged window falls nearest to and use that as a candidate root-cause hypothesis, and this could be evaluated against human-judged anomaly types.
Editorial analysis
A structured set of objections, weighed in public.
Referee Report
Summary. RedLamp is an unsupervised time series anomaly detection method that augments training windows with one normal class and 11 hand-designed pseudo-anomaly classes (spike, flip, speedup, noise, cutoff, average, scale, wander, contextual, upsidedown, mixture). A CNN encoder-decoder with an MLP classifier is trained with masked reconstruction loss and cross-entropy loss, using backward-corrected soft labels to tolerate contaminated and false anomalies. Test windows are scored by combining reconstruction error with a frequent-anomaly-adjusted anomaly-class score. The paper reports experiments on five datasets against 12 baselines, with average VUS-PR of 0.430 versus 0.355 for the best baseline, an ablation study, a sensitivity analysis, a contamination robustness study, and t-SNE-based explainability visualizations.
Significance. The multiclass pseudo-anomaly formulation is a reasonable and potentially useful extension of binary pseudo-anomaly methods such as CutAddPaste, and the combination of masked reconstruction with soft-label multiclass classification is well motivated. The empirical study is unusually thorough: five datasets, 12 baselines, range-based metrics, ablations of each proposed component, hyperparameter sensitivity, and released code. The univariate statistical significance result (Fig. 7) supports the average effectiveness claim. However, the headline robustness claim is not supported by the experiment as designed, because Section 4.5 contaminates the training set with exactly the same 11 augmentation types that generate RedLamp's pseudo-anomaly classes. The diversity-gap premise, which is load-bearing for the claim that robustness transfers to real contamination, is therefore not tested.
major comments (3)
- [Section 4.5] The contamination robustness protocol does not test the diversity-gap premise. The contaminated dataset is created by 'randomly mixing 11 types of anomaly instances into the training set,' and those 11 types are exactly the anomaly augmentations used to generate RedLamp's pseudo-anomaly classes in Section 3.3. A contaminated sample is therefore an in-distribution instance of a class the model was already trained to separate, and the backward-correction soft labels in Eq. (1) are calibrated for precisely this label-noise process. The reported 1.8% VUS-PR drop at 5% contamination is an internal-consistency check of the training objective, not evidence that RedLamp is robust to real anomalies outside the augmentation family. Appendix E (Fig. 8) shows that the usefulness of each augmentation is dataset-dependent, so coverage of unseen anomaly space cannot be assumed. I recommend adding contamination from held-out anomaly types, for example holding out one augmentation during training and contaminating with that held-out type, or injecting real anomalies from held-out datasets, and reporting the performance drop under that out-of-family contamination.
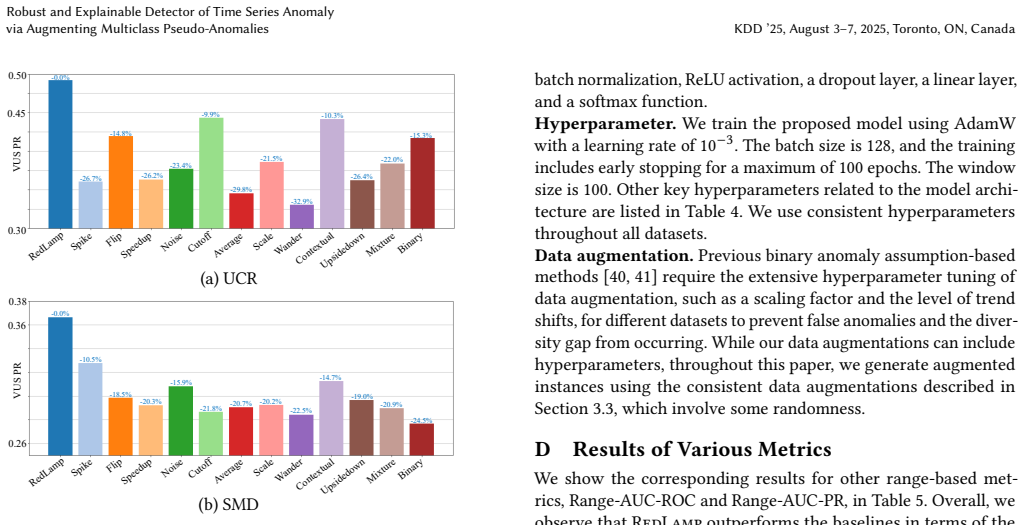
- [Section 4.4, Fig. 4] The multiclass-versus-binary comparison is confounded by the total number of pseudo-anomaly samples. In the multiclass arm, the number of classes k is varied from 1 to 11 while each class is generated at a 1:1 ratio to the training set, so the total pseudo-anomaly count grows linearly with k. In the binary arm, all 11 augmentations are pooled and the anomaly-to-normal ratio is varied independently. The observation that performance improves as k increases may therefore reflect a larger augmentation budget rather than diversity of classes, and the statement that Binary outperforms Multiclass at its optimal ratio is difficult to interpret because the comparison points differ in both class structure and total augmented-instance count. A controlled experiment that fixes the total number of augmented instances while varying only the number of classes would isolate the diversity effect.
- [Section 3.6.2, Eq. (6)] The frequent-anomaly adjustment uses a single threshold δ=0.05 on the average predicted probability of each anomaly class over the entire test set. If the test set contains a nontrivial fraction of true anomalies of one type, the class average can exceed 0.05 and Eq. (6) will zero out that class's contribution, directly suppressing the anomaly signal that the model was trained to produce. Table 2 shows that SMD's test anomaly ratio is 4.21%, close to δ, and Fig. 6(c) shows test anomalies distributed across several classes. The paper does not report sensitivity to δ (Appendix F varies α, β, and γ but not δ), and the w/o FAA ablation shows that FAA affects performance on SMD. The authors should analyze or at least discuss the failure mode where a true anomaly class is frequent enough to be zeroed by Eq. (6).
minor comments (4)
- [Abstract and Section 4.2] The reported '17%' or '17.4%' improvement in VUS-PR is not the standard relative improvement. From Table 3, RedLamp's average VUS-PR is 0.430 and CutAddPaste's is 0.355, so the relative improvement is 21.1%, while 17.4% equals (0.430−0.355)/0.430. Please correct the percentage or state the formula explicitly.
- [Section 4.2 and Fig. 7] The text emphasizes that RedLamp significantly outperforms baselines, but Fig. 7 shows statistical significance only in the univariate setting. The paper should explicitly state that the multivariate comparison is not significant at the same level, and temper the wording accordingly.
- [Algorithm 1] The notation 'Uni' is not defined; it appears to denote uniform random selection or sampling. Please define it in the caption or text, and correct the typo 'np.linsapce' in Section 3.3.2.
- [Section 4.4] The sentence 'At this optimal ratio, Binary outperforms Multiclass, benefiting from the diversity of anomalies' is confusing: the comparison point where Binary outperforms Multiclass has the same number of anomaly types, so the phrase 'diversity of anomalies' is not the right explanation. Please rephrase to describe the effect of anomaly quantity versus class structure.
Circularity Check
No significant circularity: the anomaly score and losses are explicit design choices, and the headline claims rest on external benchmark comparisons rather than self-referential derivation.
full rationale
RedLamp's pipeline is explicitly constructive rather than derived: Section 3.3 defines 11 augmentations together with one-hot labels and anomaly masks; Eqs. (2)-(4) define the training losses; Eqs. (5)-(8) define the anomaly score from the trained model's reconstruction and class predictions. None of these equations is defined in terms of the evaluation target, and no parameter is fitted to the reported test benchmarks: the hyperparameters alpha, beta, gamma, and delta are fixed across datasets (Table 4), and the efficacy claims in Q1 are comparisons against held-out anomalies in UCR, AIOps, SMD, SMAP, and MSL. The authors do not justify the method by citing their own prior work, and the augmentation family is attributed to an external framework [12]. The only self-referential element is experimental rather than derivational: Section 4.5 contaminates UCR training sets with '11 types of anomaly instances' that are the same augmentation types used to create RedLamp's pseudo-anomaly classes, so the reported 1.8% drop at 5% contamination supports internal consistency more than robustness to out-of-family anomaly contamination. That is a limitation on external validity, not a circular derivation, and it does not undermine the independent benchmark results. Score 0.
Assumptions & free parameters
free parameters (5)
- alpha =
0.1
- beta =
0.01
- gamma =
0.1
- delta =
0.05
- window size L =
100
assumptions (4)
- domain assumption The 11 hand-designed data augmentations fill the diversity gap; real anomalies resemble at least one augmentation type.
- domain assumption A uniform label-transition model (alpha, beta) captures contamination and false-anomaly noise.
- domain assumption Test time series are mostly normal, so anomaly classes predicted frequently are pseudo-normal.
- standard math A CNN encoder-decoder with MLP classifier (SREA-based) can learn the multiclass boundary and reconstruction jointly.
Cite this review
Pith. "Pith review of Robust and Explainable Detector of Time Series Anomaly via Augmenting Multiclass Pseudo-Anomalies." pith.science (2026). https://pith.science/paper/A3JELQTS
@misc{pith2026250520765,
  author       = {Pith},
  title        = {Pith review of: Robust and Explainable Detector of Time Series Anomaly via Augmenting Multiclass Pseudo-Anomalies},
  year         = {2026},
  howpublished = {\url{https://pith.science/paper/A3JELQTS}},
  note         = {Machine review of arXiv:2505.20765}
}
read the original abstract
Unsupervised anomaly detection in time series has been a pivotal research area for decades. Current mainstream approaches focus on learning normality, on the assumption that all or most of the samples in the training set are normal. However, anomalies in the training set (i.e., anomaly contamination) can be misleading. Recent studies employ data augmentation to generate pseudo-anomalies and learn the boundary separating the training samples from the augmented samples. Although this approach mitigates anomaly contamination if augmented samples mimic unseen real anomalies, it suffers from several limitations. (1) Covering a wide range of time series anomalies is challenging. (2) It disregards augmented samples that resemble normal samples (i.e., false anomalies). (3) It places too much trust in the labels of training and augmented samples. In response, we propose RedLamp, which employs diverse data augmentations to generate multiclass pseudo-anomalies and learns the multiclass boundary. Such multiclass pseudo-anomalies cover a wide variety of time series anomalies. We conduct multiclass classification using soft labels, which prevents the model from being overconfident and ensures its robustness against contaminated/false anomalies. The learned latent space is inherently explainable as it is trained to separate pseudo-anomalies into multiclasses. Extensive experiments demonstrate the effectiveness of RedLamp in anomaly detection and its robustness against anomaly contamination.
Figures


Figures from the paper (4 more)



Reference graph
Works this paper leans on
-
[1]
Ahmed Abdulaal, Zhuanghua Liu, and Tomer Lancewicki. 2021. Practical ap- proach to asynchronous multivariate time series anomaly detection and localiza- tion. In KDD. 2485–2494
work page 2021
-
[2]
Julien Audibert, Pietro Michiardi, Frédéric Guyard, Sébastien Marti, and Maria A Zuluaga. 2020. Usad: Unsupervised anomaly detection on multivariate time series. In KDD. 3395–3404
work page 2020
-
[3]
Md Abul Bashar and Richi Nayak. 2020. TAnoGAN: Time series anomaly de- tection with generative adversarial networks. In 2020 IEEE Symposium Series on Computational Intelligence (SSCI). IEEE, 1778–1785
work page 2020
-
[4]
Ane Blázquez-García, Angel Conde, Usue Mori, and Jose A Lozano. 2021. A review on outlier/anomaly detection in time series data. ACM computing surveys (CSUR) 54, 3 (2021), 1–33
2021
-
[5]
Mohammad Braei and Sebastian Wagner. 2020. Anomaly detection in univariate time-series: A survey on the state-of-the-art. arXiv preprint arXiv:2004.00433 (2020)
arXiv 2020
-
[6]
Carmona, François-Xavier Aubet, Valentin Flunkert, and Jan Gasthaus
Chris U. Carmona, François-Xavier Aubet, Valentin Flunkert, and Jan Gasthaus
-
[7]
Andrea Castellani, Sebastian Schmitt, and Barbara Hammer. 2021. Estimating the electrical power output of industrial devices with end-to-end time-series classification in the presence of label noise. In ECML. Springer, 469–484
work page 2021
-
[8]
Cristian I Challu, Peihong Jiang, Ying Nian Wu, and Laurent Callot. 2022. Deep generative model with hierarchical latent factors for time series anomaly detec- tion. In AISTATS. PMLR, 1643–1654
work page 2022
Show all 57 references
-
[9]
Yuhang Chen, Chaoyun Zhang, Minghua Ma, Yudong Liu, Ruomeng Ding, Bowen Li, Shilin He, Saravan Rajmohan, Qingwei Lin, and Dongmei Zhang. 2023. ImD- iffusion: Imputed Diffusion Models for Multivariate Time Series Anomaly Detec- tion. Proc. VLDB Endow. 17, 3 (2023), 359–372
2023
-
[10]
Ailin Deng and Bryan Hooi. 2021. Graph neural network-based anomaly detection in multivariate time series. In AAAI, Vol. 35. 4027–4035
2021
-
[11]
Terrance DeVries. 2017. Improved Regularization of Convolutional Neural Net- works with Cutout. arXiv preprint arXiv:1708.04552 (2017)
2017 arXiv
-
[13]
Mononito Goswami, Cristian Ignacio Challu, Laurent Callot, Lenon Minorics, and Andrey Kan. 2023. Unsupervised Model Selection for Time Series Anomaly Detection. In ICLR
2023
-
[14]
Siho Han and Simon S Woo. 2022. Learning sparse latent graph representations for anomaly detection in multivariate time series. In KDD. 2977–2986
2022
-
[15]
Dan Hendrycks, Mantas Mazeika, and Thomas Dietterich. 2019. Deep Anomaly Detection with Outlier Exposure. ICLR (2019)
2019
-
[16]
Kyle Hundman, Valentino Constantinou, Christopher Laporte, Ian Colwell, and Tom Soderstrom. 2018. Detecting spacecraft anomalies using lstms and nonpara- metric dynamic thresholding. In KDD. 387–395
2018
-
[17]
Hassan Ismail Fawaz, Germain Forestier, Jonathan Weber, Lhassane Idoumghar, and Pierre-Alain Muller. 2019. Deep learning for time series classification: a review. Data mining and knowledge discovery 33, 4 (2019), 917–963
2019
-
[18]
Brian Kenji Iwana and Seiichi Uchida. 2021. An empirical survey of data aug- mentation for time series classification with neural networks. Plos one 16, 7 (2021)
2021
-
[19]
Yungi Jeong, Eunseok Yang, Jung Hyun Ryu, Imseong Park, and Myungjoo Kang. 2023. Anomalybert: Self-supervised transformer for time series anomaly detection using data degradation scheme. arXiv preprint arXiv:2305.04468 (2023)
2023 arXiv
-
[20]
Siwon Kim, Kukjin Choi, Hyun-Soo Choi, Byunghan Lee, and Sungroh Yoon
-
[21]
Kwei-Herng Lai, Daochen Zha, Junjie Xu, Yue Zhao, Guanchu Wang, and Xia Hu. 2021. Revisiting Time Series Outlier Detection: Definitions and Benchmarks. In NeurIPS, Vol. 1
2021
-
[22]
In AAAI, Vol
Towards a rigorous evaluation of time-series anomaly detection. In AAAI, Vol. 36. 7194–7201
-
[23]
Zhihan Li, Youjian Zhao, Jiaqi Han, Ya Su, Rui Jiao, Xidao Wen, and Dan Pei. 2021. Multivariate time series anomaly detection and interpretation using hierarchical inter-metric and temporal embedding. In KDD. 3220–3230
2021
-
[24]
Chun-Liang Li, Kihyuk Sohn, Jinsung Yoon, and Tomas Pfister. 2021. Cutpaste: Self-supervised learning for anomaly detection and localization. In CVPR. 9664– 9674
2021
-
[25]
Qinghua Liu and John Paparrizos. 2024. The Elephant in the Room: Towards A Reliable Time-Series Anomaly Detection Benchmark. In NeurIPS
2024
-
[26]
Fei Tony Liu, Kai Ming Ting, and Zhi-Hua Zhou. 2008. Isolation Forest. In ICDM. 413–422
2008
-
[27]
Pankaj Malhotra, Anusha Ramakrishnan, Gaurangi Anand, Lovekesh Vig, Puneet Agarwal, and Gautam Shroff. 2016. LSTM-based encoder-decoder for multi-sensor anomaly detection. arXiv preprint arXiv:1607.00148 (2016)
2016 arXiv
-
[28]
Yangdi Lu, Zhiwei Xu, and Wenbo He. 2023. Rethinking Label Refurbishment: Model Robustness under Label Noise. AAAI 37, 12 (2023), 15000–15008
2023
-
[29]
Daehyung Park, Yuuna Hoshi, and Charles C Kemp. 2018. A multimodal anomaly detector for robot-assisted feeding using an lstm-based variational autoencoder. IEEE Robotics and Automation Letters 3, 3 (2018), 1544–1551
2018
-
[30]
Tsay, Aaron Elmore, and Michael J
John Paparrizos, Paul Boniol, Themis Palpanas, Ruey S. Tsay, Aaron Elmore, and Michael J. Franklin. 2022. Volume under the surface: a new accuracy evaluation measure for time-series anomaly detection. Proc. VLDB Endow. 15, 11 (jul 2022), 2774–2787
2022
-
[31]
Giorgio Patrini, Alessandro Rozza, Aditya Krishna Menon, Richard Nock, and Lizhen Qu. 2017. Making deep neural networks robust to label noise: A loss correction approach. In CVPR. 1944–1952
2017
-
[32]
Daehyung Park, Hokeun Kim, Yuuna Hoshi, Zackory Erickson, Ariel Kapusta, and Charles C Kemp. 2017. A multimodal execution monitor with anomaly classification for robot-assisted feeding. In 2017 IEEE/RSJ International Conference on Intelligent Robots and Systems (IROS) . IEEE, ...
2017
-
[33]
Sebastian Schmidl, Phillip Wenig, and Thorsten Papenbrock. 2022. Anomaly Detection in Time Series: A Comprehensive Evaluation. VLDB 15, 9 (2022), 1779–1797
2022
-
[34]
M Saquib Sarfraz, Mei-Yen Chen, Lukas Layer, Kunyu Peng, and Marios Koulakis
-
[35]
Ya Su, Youjian Zhao, Chenhao Niu, Rong Liu, Wei Sun, and Dan Pei. 2019. Robust anomaly detection for multivariate time series through stochastic recurrent neural network. In KDD. 2828–2837
2019
-
[36]
Swee Chuan Tan, Kai Ming Ting, and Tony Fei Liu. 2011. Fast anomaly detection for streaming data. In AAAI (IJCAI’11) . AAAI Press, 1511–1516
2011
-
[37]
Bernhard Schölkopf, Robert C Williamson, Alex Smola, John Shawe-Taylor, and John Platt. 1999. Support vector method for novelty detection. NeurIPS 12 (1999)
1999
-
[38]
Shreshth Tuli, Giuliano Casale, and Nicholas R Jennings. 2022. TranAD: Deep Transformer Networks for Anomaly Detection in Multivariate Time Series Data. Proceedings of VLDB 15, 6 (2022), 1201–1214
2022
-
[39]
Chengsen Wang, Zirui Zhuang, Qi Qi, Jingyu Wang, Xingyu Wang, Haifeng Sun, and Jianxin Liao. 2024. Drift doesn’t matter: dynamic decomposition with diffusion reconstruction for unstable multivariate time series anomaly detection. NeurIPS 36 (2024)
2024
-
[40]
Nesime Tatbul, Tae Jun Lee, Stan Zdonik, Mejbah Alam, and Justin Gottschlich
-
[41]
Rui Wang, Xudong Mou, Renyu Yang, Kai Gao, Pin Liu, Chongwei Liu, Tianyu Wo, and Xudong Liu. 2024. CutAddPaste: Time Series Anomaly Detection by Exploiting Abnormal Knowledge. In KDD. 3176–3187
2024
-
[42]
Qingsong Wen, Liang Sun, Fan Yang, Xiaomin Song, Jingkun Gao, Xue Wang, and Huan Xu. 2021. Time Series Data Augmentation for Deep Learning: A Survey. In IJCAI. 4653–4660. Survey Track
2021
-
[43]
Renjie Wu and Eamonn J Keogh. 2021. Current time series anomaly detection benchmarks are flawed and are creating the illusion of progress.IEEE transactions on knowledge and data engineering 35, 3 (2021), 2421–2429
2021
-
[44]
Rui Wang, Chongwei Liu, Xudong Mou, Kai Gao, Xiaohui Guo, Pin Liu, Tianyu Wo, and Xudong Liu. 2023. Deep contrastive one-class time series anomaly detection. In SDM. SIAM, 694–702
2023
-
[45]
Chunjing Xiao, Zehua Gou, Wenxin Tai, Kunpeng Zhang, and Fan Zhou
-
[46]
Hongzuo Xu, Yijie Wang, Songlei Jian, Qing Liao, Yongjun Wang, and Guansong Pang. 2024. Calibrated one-class classification for unsupervised time series anomaly detection. IEEE Transactions on Knowledge and Data Engineering (2024)
2024
-
[47]
Jiehui Xu, Haixu Wu, Jianmin Wang, and Mingsheng Long. 2022. Anomaly Transformer: Time Series Anomaly Detection with Association Discrepancy. In ICLR
2022
-
[48]
Shuang Wu, Jingyu Zhao, and Guangjian Tian. 2022. Understanding and Mitigat- ing Data Contamination in Deep Anomaly Detection: A Kernel-based Approach. KDD ’25, August 3–7, 2025, Toronto, ON, Canada Kohei Obata, Yasuko Matsubara, and Yasushi Sakurai In IJCAI. 2319–2325
2022
-
[49]
Jaemin Yoo, Tiancheng Zhao, and Leman Akoglu. 2023. Data Augmentation is a Hyperparameter: Cherry-picked Self-Supervision for Unsupervised Anomaly Detection is Creating the Illusion of Success. TMLR (2023)
2023
-
[50]
Jinsung Yoon, Kihyuk Sohn, Chun-Liang Li, Sercan O Arik, Chen-Yu Lee, and Tomas Pfister. 2022. Self-supervise, Refine, Repeat: Improving Unsupervised Anomaly Detection. TMLR (2022)
2022
-
[51]
Vitjan Zavrtanik, Matej Kristan, and Danijel Skocaj. 2021. DRAEM - A Discrimi- natively Trained Reconstruction Embedding for Surface Anomaly Detection. In ICCV. 8330–8339
2021
-
[52]
Bin Zhou, Shenghua Liu, Bryan Hooi, Xueqi Cheng, and Jing Ye. 2019. Beatgan: Anomalous rhythm detection using adversarially generated time series.. InIJCAI, Vol. 2019. 4433–4439. A Datasets We provide a detailed description of the datasets used in the exper- iments. UCR Anomal...
2019
-
[53]
Yiyuan Yang, Chaoli Zhang, Tian Zhou, Qingsong Wen, and Liang Sun. 2023. Dcdetector: Dual attention contrastive representation learning for time series anomaly detection. In KDD. 3033–3045
2023
-
[58]
Therefore, the num- ber of training samples is given bysequence length window step , and some of them overlap
For UCR, due to the high redundancy of repeating patterns, the window step was set within the range of{1, 10, 100} to ensure the number of training samples stays below 10000. Therefore, the num- ber of training samples is given bysequence length window step , and some of them ...
2025
-
[2018]
In NeurIPS
Precision and recall for time series. In NeurIPS. 1924–1934
1924
-
[2022]
Neural Contextual Anomaly Detection for Time Series. InIJCAI. 2843–2851
-
[2023]
Imputation-based time-series anomaly detection with conditional weight- incremental diffusion models. In KDD. 2742–2751
-
[2024]
Position: Quo Vadis, Unsupervised Time Series Anomaly Detection?. In ICML
Reviewed August 7, 2026 · model on record in the stance chip above.
Discussion (0). Continue with ORCID to comment.