REVIEW 3 major objections 5 minor 14 references
Predictive Query-based Pipeline for Graph Data
T0 review · 3 major / 5 minor · reviewed 2026-08-11 · deepseek-v4-flash
Pith's one-line read This paper claims that a query-driven pipeline for graph data, applied to a heart-disease dataset, shows FastRP embeddings at 50 and 100 dimensions separate healthy from sick patients better than Node2Vec or GraphSAGE embeddings.
desk verdict A well-intentioned postdoc report on a graph embedding pipeline, but the headline claim about FastRP rests on eyeballing t-SNE plots rather than any measured accuracy. read the letter →
The pith
A machine-rendered reading of the paper's core claim, the machinery that carries it, and where it could break.
The reading
What carries the argument
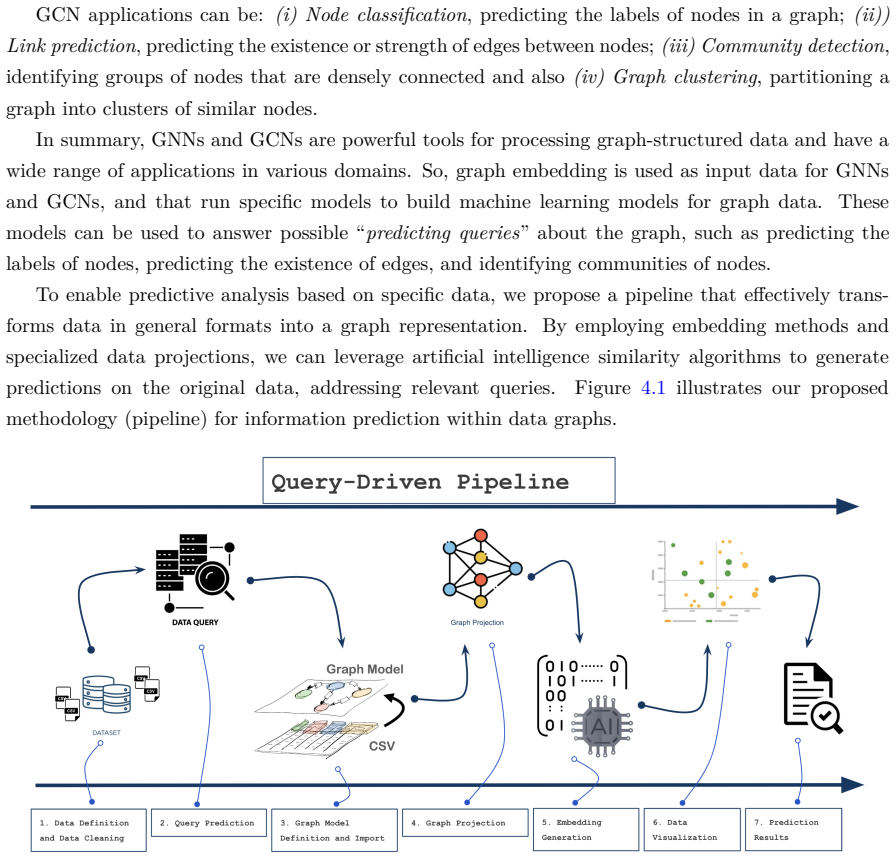
The central object is the predictive query-based pipeline itself: a sequence of seven steps (data definition and cleaning, query prediction, graph model definition and import, graph projection, embedding generation, data visualization, and prediction results). Within it, three projection types (full, strict, and strict-extended) and three embedding methods (Node2Vec, GraphSAGE, and FastRP) at dimensions 10, 50, and 100 create a configuration space; embeddings are stored as node properties in a graph database and compared through dimensionality reduction (t-SNE, Isomap, MDS, Spectral Embedding) and KNN similarity. The load-bearing mechanism is the strict-extended projection—a node with its directly connected edges plus at least one additional node or edge—which the paper reports produces the clearest separation of Person nodes when combined with FastRP.
What would settle it
For the same Heart Disease graph, compute a standard classification metric, such as 10-fold cross-validated F1 or accuracy of a k-nearest-neighbor or logistic-regression classifier, on the FastRP 50/100 embeddings against the Node2Vec and GraphSAGE embeddings. If FastRP 50/100 does not outperform the other embeddings (or a baseline using the raw patient attributes), the paper's central claim is refuted.
Extended reading notes
Core claim
The report's central claim is that, for the Heart Disease graph, the strict-extended graph projection combined with FastRP embeddings at 50 and 100 dimensions yields the most discriminative representation of Person nodes, grouping healthy and sick patients into visibly separate clusters. The paper further claims that projection type matters more than dimension in some settings, and that in a separate MovieLens rating-prediction example GraphSAGE embeddings give closer predictions than Node2Vec. The overarching discovery is a pipeline that makes these comparisons systematic and repeatable, spanning data cleaning, query definition, graph import, projection, embedding generation, visualization, and prediction results.
Load-bearing premise
The central claim rests on the assumption that separation visible in 2D t-SNE plots of the embeddings reflects genuinely better classification of healthy versus sick patients; the report does not measure predictive accuracy.
Editorial extensions
If this is right
- FastRP embeddings at 50 and 100 dimensions are more discriminative for inferring heart-disease status than the other embedding configurations tested.
- The strict-extended graph projection is the most promising of the three projection types for the Person-node classification task.
- GraphSAGE embeddings predicted movie ratings more accurately than Node2Vec embeddings in the MovieLens example, showing that the best embedding depends on the query.
- The pipeline can be applied to other datasets and query types, such as life-expectancy and mental-health prediction, without changing the core steps.
Reading between the lines
- The paper's comparison is visual only; computing classification accuracy or silhouette scores on the original embeddings would confirm or overturn the FastRP claim.
- The stated goal of a quality index for whether a query 'makes sense' on a graph is not implemented; turning that idea into a concrete index is the natural next step.
- The FastRP advantage may be an artifact of t-SNE's nonlinear projection; measuring separation in the original high-dimensional space (for example, with k-NN accuracy) would settle whether the embeddings themselves are more discriminative.
Editorial analysis
A structured set of objections, weighed in public.
Referee Report
Summary. The paper proposes a 'predictive query-based pipeline' for graph databases. It describes graph embedding generation with Node2Vec, GraphSAGE, and FastRP, the storage of embeddings as node properties in Neo4j, dimensionality-reduction visualization, and similarity queries. Two applications are presented: MovieLens rating prediction (Chapter 3) and Heart Disease classification (Chapter 4). The stated conclusions are that GraphSAGE embeddings give more accurate rating predictions than Node2Vec, and that FastRP embeddings at dimensions 50 and 100 are superior for distinguishing healthy and sick patients.
Significance. The pipeline idea is pragmatic, and the use of Cypher queries over stored embeddings is a practical starting point for practitioners. However, the empirical validation is entirely qualitative: the Heart Disease conclusion rests on visual inspection of t-SNE scatterplots, with no classifier or accuracy measure, and the MovieLens comparison uses 19 hand-picked examples without statistical analysis. The manuscript is transparent that it is a first step, but the central claims are not supported by the evidence presented. A quantitative evaluation and a formal definition of the pipeline steps would be needed for the paper to be publishable.
major comments (3)
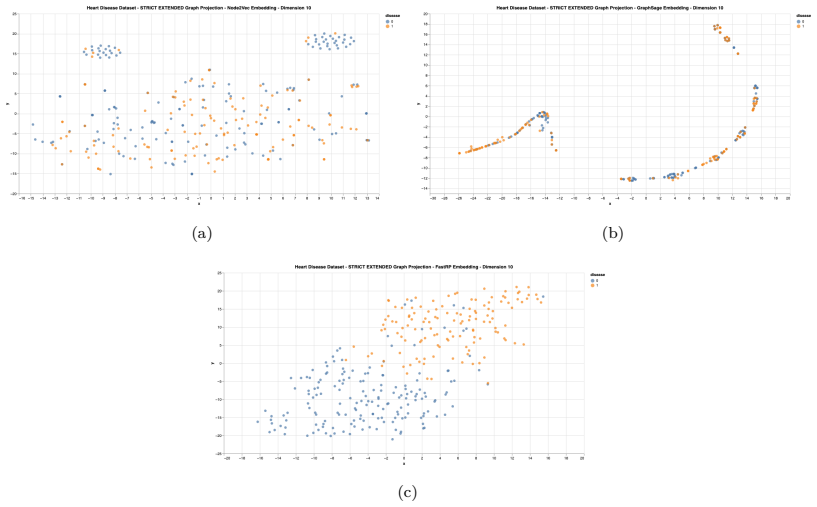
- [Sec. 4, Figs. 4.6–4.7] The claim that FastRP embeddings with 50 and 100 dimensions 'yielded superior results for inferring the health status of individuals' is unsupported. No classifier is trained or evaluated, there is no held-out test set, and no accuracy, F1, or AUC is reported. The evidence is solely visual separation in 2-D t-SNE projections, which are stochastic and can introduce artifacts. This is load-bearing because the pipeline's step 7 is 'Prediction Results,' yet no numeric prediction result appears for the Heart Disease dataset.
- [Sec. 4, Figs. 4.3–4.5] The visual comparisons are internally inconsistent. The text states that GraphSAGE embeddings are 'more discriminative' in Figure 4.4, that Node2Vec embeddings are 'more discriminative' in Figure 4.5, and then that FastRP embeddings are most representative in Figure 4.7. With no objective classification metric, these judgments are post hoc and cannot support the conclusion that any particular embedding method is best.
- [Ch. 3, Tables 3.1 and 3.2] The comparison of GraphSAGE versus Node2Vec for rating prediction is based on 19 (user, movie) pairs, with no error bars, no aggregate error measure such as MAE or RMSE, and no significance test. The text's conclusion that GraphSAGE is 'more accurate' rests on a count of absolute differences at least 1, which is not a validated evaluation protocol. This is insufficient evidence for the comparative claim.
minor comments (5)
- [Tables 3.1 and 3.2] The movie title 'The hawshank Redemption' should be 'The Shawshank Redemption'.
- [Sec. 4, para. after Fig. 4.3] The sentence 'As depicted in Figure 4.3, the GraphSAGE embeddings demonstrate superior discriminative results' refers to the 50-dimension strict-extended projection, but Figure 4.3 shows the 10-dimension full projection; the cross-reference is misleading.
- [Throughout] There are numerous grammatical errors and typos, including 'a interesting', 'a important', 'tunning', 'the is no information', 'Multidimention Scaling', and 'infer' used where 'infer' or 'derive' is intended; a careful editing pass is needed.
- [Sec. 4, data description] The reproducibility of the experiments would be improved by reporting the exact data split, embedding hyperparameters (walk length, number of walks, epochs, random seeds), and the version/date of the Kaggle dataset [Kol23].
- [Sec. 4.1] The statement 'This work is only a first step' is consistent with a technical report, but it conflicts with the strength of the earlier claim that the pipeline 'demonstrated' FastRP's superiority; the conclusions should be reworded to match the preliminary nature of the evidence.
Circularity Check
No circular derivation: the FastRP-superiority claim is visually asserted rather than derived from fitted inputs or self-citations.
full rationale
This report does not derive a result from equations, fitted parameters, or an imported uniqueness theorem, so the core circularity patterns do not apply. The central claim that FastRP embeddings with 50 and 100 dimensions are superior for distinguishing healthy and sick patients rests on visual inspection of Figures 4.6 and 4.7: the paper states that “the embeddings generated for the FastRP algorithm with 50 and 100 dimensions are more discriminative than the embeddings with 10 dimensions” and then concludes that FastRP “yielded superior results.” This is an evidentiary weakness — no classifier, accuracy metric, train/test split, or measured comparison is reported — but it is not circularity in the defined sense, because the conclusion is not equivalent by construction to an input, and no parameter was fitted and then renamed as a prediction. The pipeline's step 7 is named “Prediction Results,” but the absence of executed prediction results makes the claim unsupported, not self-referential. There are also no load-bearing self-citations: the cited embedding libraries and methods (GraphSAGE, Node2Vec, FastRP, GDS, t-SNE) are external algorithms, not prior conclusions of this author. The inconsistent visual judgments across Figures 4.4, 4.5, and 4.7 (GraphSAGE, Node2Vec, and FastRP each called best) further show that the report lacks an objective criterion, but again that is a correctness and validation problem rather than a circular derivation. Therefore no circular step can be exhibited with a specific reduction, and the appropriate finding is no significant circularity.
Assumptions & free parameters
free parameters (4)
- topK =
5
- randomSeed =
42
- deltaThreshold =
0.7
- embedding_dimensions =
10, 50, 100
assumptions (4)
- domain assumption Node2Vec, GraphSAGE, and FastRP embeddings preserve node similarity relevant to the prediction task
- domain assumption Visual inspection of 2D dimensionality-reduced projections (t-SNE, Isomap, MDS, Spectral) reliably indicates which embedding is more discriminative
- ad hoc to paper The hand-built graph schema for Heart Disease (Person, PersonState, HeartMeasures, etc.) captures the information needed for classification
- domain assumption Aggregating ratings of similar users via KNN on embeddings is a valid rating prediction method
Cite this review
Pith. "Pith review of Predictive Query-based Pipeline for Graph Data." pith.science (2026). https://pith.science/paper/A52G4RYB
@misc{pith2026241209940,
  author       = {Pith},
  title        = {Pith review of: Predictive Query-based Pipeline for Graph Data},
  year         = {2026},
  howpublished = {\url{https://pith.science/paper/A52G4RYB}},
  note         = {Machine review of arXiv:2412.09940}
}
read the original abstract
Graphs face challenges when dealing with massive datasets. They are essential tools for modeling interconnected data and often become computationally expensive. Graph embedding techniques, on the other hand, provide an efficient approach. By projecting complex graphs into a lower-dimensional space, these techniques simplify the analysis and processing of large-scale graphs. By transforming graphs into vectors, it simplifies the analysis and processing of large-scale datasets. Several approaches, such as GraphSAGE, Node2Vec, and FastRP, offer efficient methods for generating graph embeddings. By storing embeddings as node properties, it is possible to compare different embedding techniques and evaluate their effectiveness for specific tasks. This flexibilityallows for dynamic updates to embeddings and facilitates experimentation with different approaches. By analyzing these embeddings, one can extract valuable insights into the relationships between nodes and their similarities within the embedding space
Figures


Figures from the paper (9 more)





Reference graph
Works this paper leans on
-
[1]
Tucker, Vijay Vasudevan, Pete Warden, Martin Wicke, Yuan Yu, and Xiaoqiang Zheng
[ABC+16] Martín Abadi, Paul Barham, Jianmin Chen, Zhifeng Chen, Andy Davis, Jeffrey Dean, Matthieu Devin, Sanjay Ghemawat, Geoffrey Irving, Michael Isard, Manjunath Kudlur, Josh Levenberg, Rajat Monga, Sherry Moore, Derek Gordon Murray, Benoit Steiner, Paul A. Tucker, Vijay Vasudevan, Pete Warden, Martin Wicke, Yuan Yu, and Xiaoqiang Zheng. Tensorflow: A ...
work page 2016
-
[8]
Ac- cessed: 2024-01-15. 25 [PC08] Fernando Perez-Cruz. Kullback-leibler divergence estimation of continuous distributions. In 2008 IEEE International Symposium on Information Theory, pages 1666–1670,
work page 2024
-
[9]
[PGM+19] Adam Paszke, Sam Gross, Francisco Massa, Adam Lerer, James Bradbury, Gregory Chanan, Trevor Killeen, Zeming Lin, Natalia Gimelshein, Luca Antiga, Alban Desmai- son, Andreas Köpf, Edward Z. Yang, Zachary DeVito, Martin Raison, Alykhan Tejani, Sasank Chilamkurthy, Benoit Steiner, Lu Fang, Junjie Bai, and Soumith Chintala. Py- torch: An imperative s...
work page 2019
-
[10]
Accessed: 2024-01-15. [SK16] Gil Shamai and Ron Kimmel. Geodesic distance descriptors. CoRR, abs/1611.07360,
work page Pith review arXiv 2024
-
[12]
[WYZ+19] Minjie Wang, Lingfan Yu, Da Zheng, Quan Gan, Yu Gai, Zihao Ye, Mufei Li, Jinjing Zhou, Qi Huang, Chao Ma, Ziyue Huang, Qipeng Guo, Hao Zhang, Haibin Lin, Junbo Zhao, Jinyang Li, Alexander J. Smola, and Zheng Zhang. Deep graph library: Towards efficient and scalable deep learning on graphs.CoRR, abs/1909.01315,
arXiv 1909
-
[1964]
Deeper insights into graph convolutional net- works for semi-supervised learning
[LHW18] Qimai Li, Zhichao Han, and Xiao-Ming Wu. Deeper insights into graph convolutional net- works for semi-supervised learning. In Sheila A. McIlraith and Kilian Q. Weinberger, edi- tors, Proceedings of the Thirty-Second AAAI Conference on Artificial Intelligence, (AAAI- 18), the 30th innovative Applications of Artificial Intelligence (IAAI-18), and th...
work page 2018
-
[2003]
Fast and Accurate Network Embeddings via Very Sparse Random Projection
[CST+19] Haochen Chen, Syed Fahad Sultan, Yingtao Tian, Muhao Chen, and Steven Skiena. Fast and accurate network embeddings via very sparse random projection. CoRR, abs/1908.11512,
work page Pith review arXiv 1908
-
[2008]
Hamilton, Rex Ying, and Jure Leskovec
[HYL17a] William L. Hamilton, Rex Ying, and Jure Leskovec. Inductive representation learning on large graphs. CoRR, abs/1706.02216,
Show all 14 references
-
[2015]
VQA- GNN: reasoning with multimodal knowledge via graph neural networks for visual question answering
[WYR+23] Yanan Wang, Michihiro Yasunaga, Hongyu Ren, Shinya Wada, and Jure Leskovec. VQA- GNN: reasoning with multimodal knowledge via graph neural networks for visual question answering. In IEEE/CVF International Conference on Computer Vision, ICCV 2023, Paris, France, Octobe...
2023
-
[2017]
Hamilton, Zhitao Ying, and Jure Leskovec
[HYL17b] William L. Hamilton, Zhitao Ying, and Jure Leskovec. Inductive representation learning on large graphs. In Isabelle Guyon, Ulrike von Luxburg, Samy Bengio, Hanna M. Wallach, Rob Fergus, S. V. N. Vishwanathan, and Roman Garnett, editors,Advances in Neural Information P...
2017
-
[2018]
Cypher: An evolving query language for property graphs
[FGG+18] Nadime Francis, Alastair Green, Paolo Guagliardo, Leonid Libkin, Tobias Lindaaker, Vic- tor Marsault, Stefan Plantikow, Mats Rydberg, Petra Selmer, and Andrés Taylor. Cypher: An evolving query language for property graphs. In Gautam Das, Christopher M. Jer- maine, and...
2018
-
[2019]
Understanding graph embedding methods and their applications
26 [Xu20] Mengjia Xu. Understanding graph embedding methods and their applications. CoRR, abs/2012.08019,
2012 arXiv
-
[2020]
Vqgraph: Rethinking graph representation space for bridging gnns and mlps
[YTX+24] Ling Yang, Ye Tian, Minkai Xu, Zhongyi Liu, Shenda Hong, Wei Qu, Wentao Zhang, Bin Cui, Muhan Zhang, and Jure Leskovec. Vqgraph: Rethinking graph representation space for bridging gnns and mlps. InThe Twelfth International Conference on Learning Representations, ICLR ...
2024
-
[2023]
[Kra13] Oliver Kramer
Accessed: 2024-01-15. [Kra13] Oliver Kramer. K-Nearest Neighbors, pages 13–23. Springer Berlin Heidelberg, Berlin, Heidelberg,
2024
Reviewed August 11, 2026 · model on record in the stance chip above.
Discussion (0). Continue with ORCID to comment.