Through the WordStream Glass: Revisiting Quantitative Encoding for Qualitative Learning Analytics
Pith reviewed 2026-06-26 19:28 UTC · model grok-4.3
The pith
Qualitative education researchers disagree on whether frequency-based visualizations aid or obscure analysis of student responses.
A machine-rendered reading of the paper's core claim, the machinery that carries it, and where it could break.
Core claim
In the expert study, STEM education researchers using the Journal Data Dashboard and WordStream Maker to examine student responses from a data visualization course produced themes on tool experience and disciplinary context, but the central result was an epistemological dissensus in which some participants viewed frequency-based visualization as a productive entry point to qualitative analysis while others cautioned that it can obscure rare but critical responses.
What carries the argument
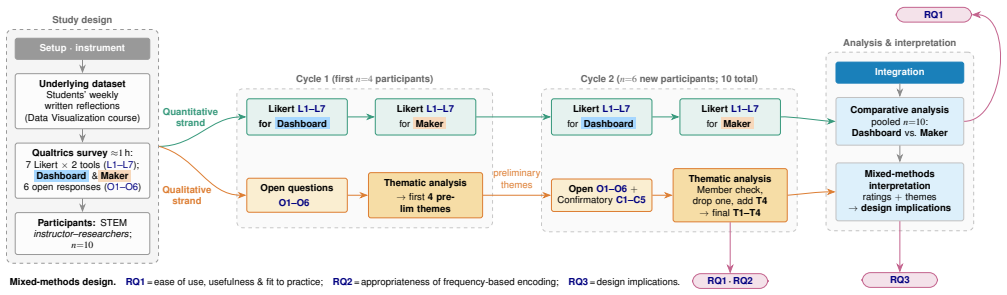
Mixed-methods expert study with two cycles of thematic analysis and confirmatory checking on input from ten STEM education researchers experienced in qualitative methods and classroom assessment.
If this is right
- Visualization platforms should be designed to support both quantitative trend detection and attention to infrequent responses.
- Tool builders need to accommodate differing epistemological stances among instructor-researchers who use learning analytics.
- Hybrid quantitative-qualitative features can make formative assessment analysis more useful across disciplinary contexts.
- Authoring tools for custom visualizations benefit from explicit safeguards against over-weighting frequent items.
- Future platforms can treat frequency views as optional entry points rather than default lenses.
Where Pith is reading between the lines
- The same tension between frequency summaries and rare cases could appear when similar tools are used in non-STEM disciplines.
- Testing the platforms with a wider set of instructors might reveal whether the observed split persists or varies by institution type.
- Design choices that surface both common and outlier responses could transfer to other domains that mix quantitative dashboards with qualitative review.
- Longer-term studies could check whether adopting such hybrid tools changes how instructors interpret and act on student feedback.
Load-bearing premise
Feedback from these ten experts captures the range of epistemological positions held by STEM education researchers more broadly.
What would settle it
A larger survey of STEM education researchers that finds the majority share one consistent stance on frequency visualizations instead of the reported split in views.
Figures
read the original abstract
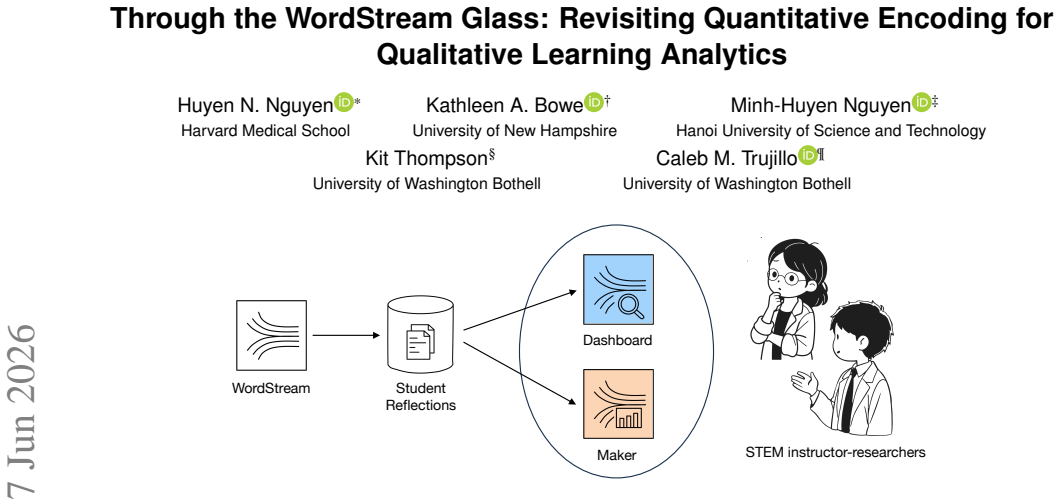
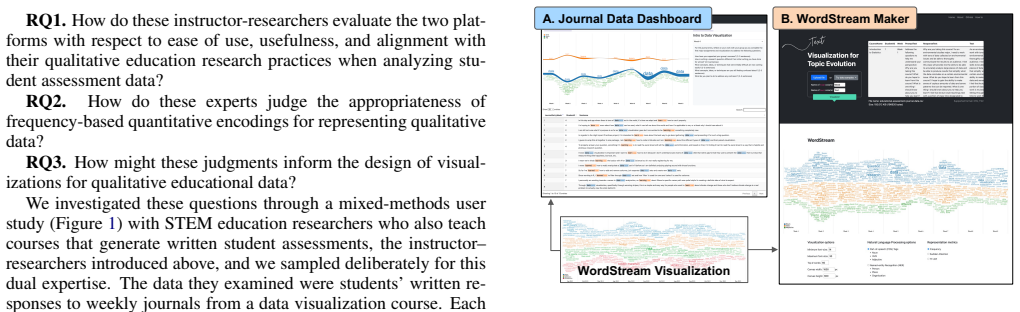
Data-driven learning analytics can surface trends across a student cohort over time, helping instructors improve the learning environment. WordStream, a visualization idiom for topic evolution, has been instantiated in two platforms toward this goal: the Journal Data Dashboard, for analyzing formative assessments, and WordStream Maker, for authoring custom visualizations. Where the prior work built these platforms for education (Vis4Ed), here we examine the reverse direction (Ed4Vis): what can qualitative education research tell us about building better visualization tools? We conducted a mixed-methods expert study (n=10) in which STEM education researchers with expertise in qualitative methods and classroom assessment used both platforms to analyze student journal responses from a data visualization course. Across two cycles of thematic analysis with confirmatory checking, we report themes spanning tool experience, disciplinary context of use, and, most importantly, a core epistemological dissensus. Some instructor-researchers regarded frequency-based visualization as a productive entry point to qualitative analysis; others cautioned it can obscure rare but critical responses. We synthesize these findings into design implications for future tools that better integrate quantitative technique with qualitative inquiry. All Supplementary Materials are available at https://osf.io/z2f8d.
Editorial analysis
A structured set of objections, weighed in public.
Referee Report
Summary. The paper reports a mixed-methods expert study (n=10 STEM education researchers) in which participants used the Journal Data Dashboard and WordStream Maker platforms to analyze student journal responses from a data visualization course. Through two cycles of thematic analysis with confirmatory checking, the authors surface themes on tool experience, disciplinary context, and a core epistemological dissensus: some experts viewed frequency-based visualizations as a productive entry point to qualitative analysis while others warned that such encodings can obscure rare but critical responses. These findings are synthesized into design implications for tools that better integrate quantitative techniques with qualitative inquiry.
Significance. If the reported dissensus is shown to be robust, the work would offer concrete, empirically grounded guidance for visualization designers working at the intersection of learning analytics and qualitative methods, highlighting the need to preserve visibility of low-frequency but high-significance responses. The Ed4Vis framing (education research informing visualization design) is a useful complement to the more common Vis4Ed direction, and the public OSF repository for supplementary materials is a positive step toward transparency in qualitative analysis.
major comments (2)
- [Abstract] Abstract: The central claim of a 'core epistemological dissensus' is derived from thematic analysis of n=10 participants. No information is supplied on recruitment criteria, institutional or disciplinary diversity of the sample, or indicators of thematic saturation. This omission directly weakens the step from observed themes to a field-level 'core' position.
- [Abstract] Abstract: The description of 'two cycles of thematic analysis with confirmatory checking' provides no protocol details, inter-rater reliability metrics, or account of how expert feedback was incorporated. These elements are load-bearing for the reliability of the dissensus finding that drives the design implications.
minor comments (1)
- [Abstract] The abstract states that all supplementary materials are available at https://osf.io/z2f8d; confirming that the repository contains the full interview protocol, codebook, and raw theme excerpts would strengthen the minor comment on transparency.
Simulated Author's Rebuttal
We thank the referee for their detailed and constructive review. The comments highlight important areas for improving transparency in the abstract, which we agree will strengthen the manuscript. We respond to each major comment below and will incorporate revisions accordingly.
read point-by-point responses
-
Referee: [Abstract] Abstract: The central claim of a 'core epistemological dissensus' is derived from thematic analysis of n=10 participants. No information is supplied on recruitment criteria, institutional or disciplinary diversity of the sample, or indicators of thematic saturation. This omission directly weakens the step from observed themes to a field-level 'core' position.
Authors: We agree the abstract would benefit from additional context on the sample to support the claim. The full Methods section describes recruitment of 10 STEM education researchers with expertise in qualitative methods and classroom assessment, drawn from relevant professional networks. We will revise the abstract to briefly note the participant expertise and clarify that the dissensus is characterized as 'core' within this expert sample rather than asserted as a universal field-level position. We will also reference the OSF repository for supplementary details on the analysis process, including how iterative cycles informed our assessment of thematic patterns. revision: yes
-
Referee: [Abstract] Abstract: The description of 'two cycles of thematic analysis with confirmatory checking' provides no protocol details, inter-rater reliability metrics, or account of how expert feedback was incorporated. These elements are load-bearing for the reliability of the dissensus finding that drives the design implications.
Authors: We acknowledge that the abstract lacks sufficient methodological detail. The full manuscript's Methods section outlines the two-cycle thematic analysis process with confirmatory checking via participant feedback. We will update the abstract to include a concise description of the approach (e.g., following established qualitative protocols with iterative consensus) and note that detailed protocols and supplementary materials are available in the OSF repository. As this is a small-scale qualitative expert study, traditional inter-rater reliability metrics were not the primary reliability mechanism; instead, we used reflexive consensus and member checking, which we will clarify to better support the findings. revision: yes
Circularity Check
No significant circularity; qualitative thematic analysis with no equations or fitted derivations
full rationale
The paper reports results from a mixed-methods expert study (n=10) using two cycles of thematic analysis on participant feedback about visualization platforms. No equations, parameters, predictions, or derivations appear in the abstract or described content. Claims about epistemological dissensus rest directly on coded themes from the sample rather than any quantity defined in terms of the study's own outputs or prior self-citations. The derivation chain is self-contained against external benchmarks (expert interviews and thematic coding), with no reductions by construction or self-referential loops. This matches the default expectation for non-circular qualitative work.
Axiom & Free-Parameter Ledger
axioms (1)
- domain assumption Thematic analysis conducted in two cycles with confirmatory checking produces stable and representative themes from a small expert sample.
Reference graph
Works this paper leans on
-
[1]
C. M. Abramson and D. Dohan. Beyond text: Using arrays to rep- resent and analyze ethnographic data.Sociological methodology, 45(1):272–319, 2015. 3
2015
-
[2]
Aigner, S
W. Aigner, S. Miksch, H. Schumann, and C. Tominski.Visualization of time-oriented data, vol. 4. Springer, 2011. 3
2011
-
[3]
H. A. H. Baca, F. d. Luz Palomino Valdivia, Y . P. Atencio, M. J. Ibarra, M. A. Cruz, and M. E. H. Baca. Covidstream: Interactive visualiza- tion of emotions evolution associated with covid-19. InAnnual Inter- national Conference on Information Management and Big Data, pp. 540–551. Springer, 2020. 3
2020
- [4]
-
[5]
Braun and V
V . Braun and V . Clarke. Using thematic analysis in psychology.Qual- itative research in psychology, 3(2):77–101, 2006. 4
2006
-
[6]
B ¨orner, A
K. B ¨orner, A. Bueckle, and M. Ginda. Data visualization literacy: Definitions, conceptual frameworks, exercises, and assessments.Pro- ceedings of the National Academy of Sciences, 116(6):1857–1864,
-
[7]
S. Cao, D. Guo, L. Cao, S. Li, J. Nie, A. K. Singh, and H. Lv. Visdmk: visual analysis of massive emotional danmaku in online videos.The Visual Computer, pp. 1–18, 2022. 3
2022
-
[8]
S. Chandrasegaran, S. K. Badam, L. Kisselburgh, K. Ramani, and N. Elmqvist. Integrating visual analytics support for grounded the- ory practice in qualitative text analysis.Computer Graphics Forum, 36(3):201–212, 2017. doi: 10.1111/cgf.13180 1, 3
-
[9]
Chen and L
L.-T. Chen and L. Liu. Methods to analyze likert-type data in ed- ucational technology research.Journal of Educational Technology Development and Exchange (JETDE), 13(2):3, 2021. 4, 8
2021
-
[10]
M. Correll. Ethical dimensions of visualization research. InPro- ceedings of the 2019 CHI conference on human factors in computing systems, pp. 1–13, 2019. 3, 8
2019
-
[11]
J. W. Creswell and V . L. P. Clark.Designing and conducting mixed methods research. Sage publications, 2017. 3
2017
-
[12]
W. Cui, S. Liu, L. Tan, C. Shi, Y . Song, Z. Gao, H. Qu, and X. Tong. Textflow: Towards better understanding of evolving topics in text.IEEE transactions on visualization and computer graphics, 17(12):2412–2421, 2011. 2
2011
-
[13]
T. Dang, H. N. Nguyen, and V . Pham. WordStream: Interactive Vi- sualization for Topic Evolution. In J. Johansson, F. Sadlo, and G. E. Marai, eds.,EuroVis 2019 - Short Papers. The Eurographics Associa- tion, 2019. 1, 2
2019
-
[14]
T. Dang, V . Pham, H. N. Nguyen, and N. V . Nguyen. Agasedviz: visualizing groundwater availability of ogallala aquifer, usa.Environ- mental Earth Sciences, 79(5):1–12, 2020. 3
2020
-
[15]
F. D. Davis. Perceived usefulness, perceived ease of use, and user acceptance of information technology.MIS quarterly, pp. 319–340,
-
[16]
R. M. Davison, H. Chughtai, P. Nielsen, M. Marabelli, F. Iannacci, M. van Offenbeek, M. Tarafdar, M. Trenz, A. A. Techatassanasoon- torn, A. D ´ıaz Andrade, and N. Panteli. The ethics of using gener- ative ai for qualitative data analysis.Information Systems Journal, n/a(n/a):1—-35, 2024. doi: 10.1111/isj.12504 3
-
[17]
L. Dedoose. Dedoose version 9.2.007 cloud application for managing, analyzing, and presenting qualitative and mixed method research data. Los Angeles, CA: SocioCultural Research Consultants, LLC, 2021. 4
2021
- [18]
-
[19]
Diehl, A
A. Diehl, A. Abdul-Rahman, B. Bach, M. El-Assady, M. Kraus, R. S. Laramee, D. A. Keim, and M. Chen. An analysis of the interplay and mutual benefits of grounded theory and visualization.IEEE Trans- actions on Visualization and Computer Graphics, 31(9):5462–5479,
-
[20]
doi: 10.1109/TVCG.2024.3452985 1, 3
-
[21]
Diehl, E
A. Diehl, E. E. Firat, T. Torsney-Weir, A. Abdul-Rahman, B. Bach, R. Laramee, R. Pajarola, and M. Chen. Visguided: A community- driven approach for education in visualization. InEurographics. The Eurographics Association, 2021. 1, 3
2021
-
[22]
M. D ¨ork, P. Feng, C. Collins, and S. Carpendale. Critical infovis: exploring the politics of visualization. InCHI ’13 Extended Abstracts on Human Factors in Computing Systems, CHI EA ’13, p. 2189–2198. Association for Computing Machinery, New York, NY , USA, 2013. doi: 10.1145/2468356.2468739 3, 8
-
[23]
E. G. Guba and Y . S. Lincoln. Paradigmatic controversies, contradic- tions, and emerging confluences.The Sage handbook of qualitative research, 2005. 4
2005
-
[24]
R. L. Harris.Information graphics: A comprehensive illustrated ref- erence. Oxford University Press, USA, 1999. 2
1999
-
[25]
Havre, E
S. Havre, E. Hetzler, P. Whitney, and L. Nowell. Themeriver: Visual- izing thematic changes in large document collections.IEEE transac- tions on visualization and computer graphics, 8(1):9–20, 2002. 2
2002
-
[26]
Isenberg, T
P. Isenberg, T. Zuk, C. Collins, and S. Carpendale. Grounded evalua- tion of information visualizations. InProceedings of the 2008 Work- shop on BEyond time and errors: novel evaLuation methods for Infor- mation Visualization, pp. 1–8, 2008. 2, 3
2008
-
[27]
Kucher, N
K. Kucher, N. Sultanum, A. Daza, V . Simaki, M. Skeppstedt, B. Plank, J.-D. Fekete, and N. Mahyar. An interdisciplinary perspective on eval- uation and experimental design for visual text analytics: Position pa- per. InIEEE Evaluation and Beyond - Methodological Approaches for Visualization (BELIV), pp. 28–37, 2022. 3
2022
-
[28]
Losev, J
T. Losev, J. Raynor, S. Carpendale, and M. Tory. Embracing disci- plinary diversity in visualization.IEEE Computer Graphics and Ap- plications, 42(6):64–71, 2022. 1, 3, 8
2022
-
[29]
S. L’Yi, A. van den Brandt, E. Adams, H. N. Nguyen, and N. Gehlen- borg. Learnable and expressive visualization authoring through blended interfaces.IEEE Transactions on Visualization and Computer Graphics, 31(1):459–469, 2025. doi: 10.1109/TVCG.2024.3456598 3
-
[30]
H. Meng, Q. Lyu, P. Qin, Y . Yang, R. Zhang, W.-C. Lin, and Y .-C. Lee. Designing computational tools for exploring causal relationships in qualitative data. InProceedings of the 2026 CHI Conference on Human Factors in Computing Systems, pp. 1–19, 2026. 1, 3
2026
-
[31]
H. N. Nguyen, A. v. d. Brandt, and N. Gehlenborg. Sycamore: Char- acterizing synthetic personas for evaluating genomics visualization re- trieval.arXiv preprint arXiv:2605.08630, 2026. 3
work page internal anchor Pith review Pith/arXiv arXiv 2026
-
[32]
H. N. Nguyen and T. Dang. Eqsa: Earthquake situational analytics from social media. In2019 IEEE Conference on Visual Analytics Sci- ence and Technology (VAST), pp. 142–143, 2019. 3
2019
-
[33]
H. N. Nguyen, T. Dang, and K. A. Bowe. WordStream Maker: A Lightweight End-to-end Visualization Platform for Qualitative Time- series Data.IEEE VIS 2022 NLVIZ Workshop: Exploring Research Opportunities for Natural Language, Text, and Data Visualization,
2022
-
[34]
H. N. Nguyen and N. Gehlenborg. Safire: Similarity framework for visualization retrieval. In2025 IEEE Visualization and Visual Analyt- ics (VIS), pp. 246–250. IEEE, 2025. 3
2025
-
[35]
H. N. Nguyen and N. Gehlenborg. Visualization retrieval for data literacy: Position paper.arXiv preprint arXiv:2604.09598, 2026. 3
work page internal anchor Pith review Pith/arXiv arXiv 2026
-
[36]
H. N. Nguyen, S. L’Yi, T. C. Smits, S. Gao, M. Zitnik, and N. Gehlen- borg. Geranium: Multimodal retrieval of genomics data visualiza- tions.IEEE Transactions on Visualization and Computer Graphics, pp. 1–17, 2026. doi: 10.1109/TVCG.2026.3683429 3
-
[37]
H. N. Nguyen, C. M. Trujillo, K. Wee, and K. A. Bowe. Interactive qualitative data visualization for educational assessment. InProceed- ings of the 12th International Conference on Advances in Information Technology, pp. 1–9, 2021. 1, 2, 3
2021
-
[38]
D. W. Shaffer. Epistemic network analysis: Understanding learning by using big data for thick description. InInternational handbook of the learning sciences, pp. 520–531. Routledge, 2018. 3
2018
-
[39]
Y . Tan, Z. Swiecki, A. R. Ruis, and D. Shaffer. Epistemic network analysis and ordered network analysis in learning analytics. InLearn- ing analytics methods and tutorials: A practical guide using R, pp. 569–636. Springer, 2024. 1, 3
2024
-
[40]
M. Tory. User studies in visualization: A reflection on methods.Hand- book of Human Centric Visualization, pp. 411–426, 2014. 3
2014
-
[41]
H. Van, H. N. Nguyen, R. Hewett, and T. Dang. Hackernets: Visualiz- ing media conversations on internet of things, big data, and cybersecu- rity. In2019 IEEE International Conference on Big Data (Big Data), pp. 3293–3302. IEEE, 2019. 3
2019
-
[42]
van den Brandt, S
A. van den Brandt, S. L’Yi, H. N. Nguyen, A. Vilanova, and N. Gehlenborg. Understanding visualization authoring techniques for genomics data in the context of personas and tasks.IEEE Trans- actions on Visualization and Computer Graphics, 31(1):1180–1190,
-
[43]
doi: 10.1109/TVCG.2024.3456298 3
-
[44]
Verdinelli and N
S. Verdinelli and N. I. Scagnoli. Data display in qualitative research. International Journal of Qualitative Methods, 12(1):359–381, 2013. 3
2013
-
[45]
F. B. Viegas, M. Wattenberg, and J. Feinberg. Participatory visualiza- tion with wordle.IEEE transactions on visualization and computer graphics, 15(6):1137–1144, 2009. 2
2009
-
[46]
X. Wang, S. Liu, Y . Chen, T.-Q. Peng, J. Su, J. Yang, and B. Guo. How ideas flow across multiple social groups. In2016 IEEE Conference on Visual Analytics Science and Technology (VAST), pp. 51–60. IEEE,
-
[47]
Wanner, A
F. Wanner, A. Stoffel, D. J ¨ackle, B. C. Kwon, A. Weiler, D. A. Keim, K. E. Isaacs, A. Gim´enez, I. Jusufi, T. Gamblin, et al. State-of-the-art report of visual analysis for event detection in text data streams. In EuroVis (STARs), 2014. 3
2014
-
[48]
F. Wei, S. Liu, Y . Song, S. Pan, M. X. Zhou, W. Qian, L. Shi, L. Tan, and Q. Zhang. Tiara: a visual exploratory text analytic system. In Proceedings of the 16th ACM SIGKDD international conference on Knowledge discovery and data mining, pp. 153–162, 2010. 2
2010
-
[49]
Zhang, Y
S. Zhang, Y . Wang, H. Li, and W. Zhang. Who will support my project? interactive search of potential crowdfunding investors through insearch. InCHI Conference on Human Factors in Comput- ing Systems Extended Abstracts, pp. 1–6, 2022. 3
2022
discussion (0)
Sign in with ORCID, Apple, or X to comment. Anyone can read and Pith papers without signing in.