REVIEW 3 major objections 6 minor 28 references
Uncertainty Model Estimation in an Augmented Data Space for Robust State Estimation
T0 review · 3 major / 6 minor · reviewed 2026-08-14 · deepseek-v4-flash
Pith's one-line read This paper argues that robust state estimation is improved by learning the measurement error model in an augmented space containing residuals plus quality-correlated metadata such as GNSS signal strength, and validates the claim with…
desk verdict A reasonable incremental extension of BCE, but the 'significant' accuracy claim rests on descriptive statistics from two of three datasets — needs a revision before it can stand. read the letter →
The pith
A machine-rendered reading of the paper's core claim, the machinery that carries it, and where it could break.
The reading
What carries the argument
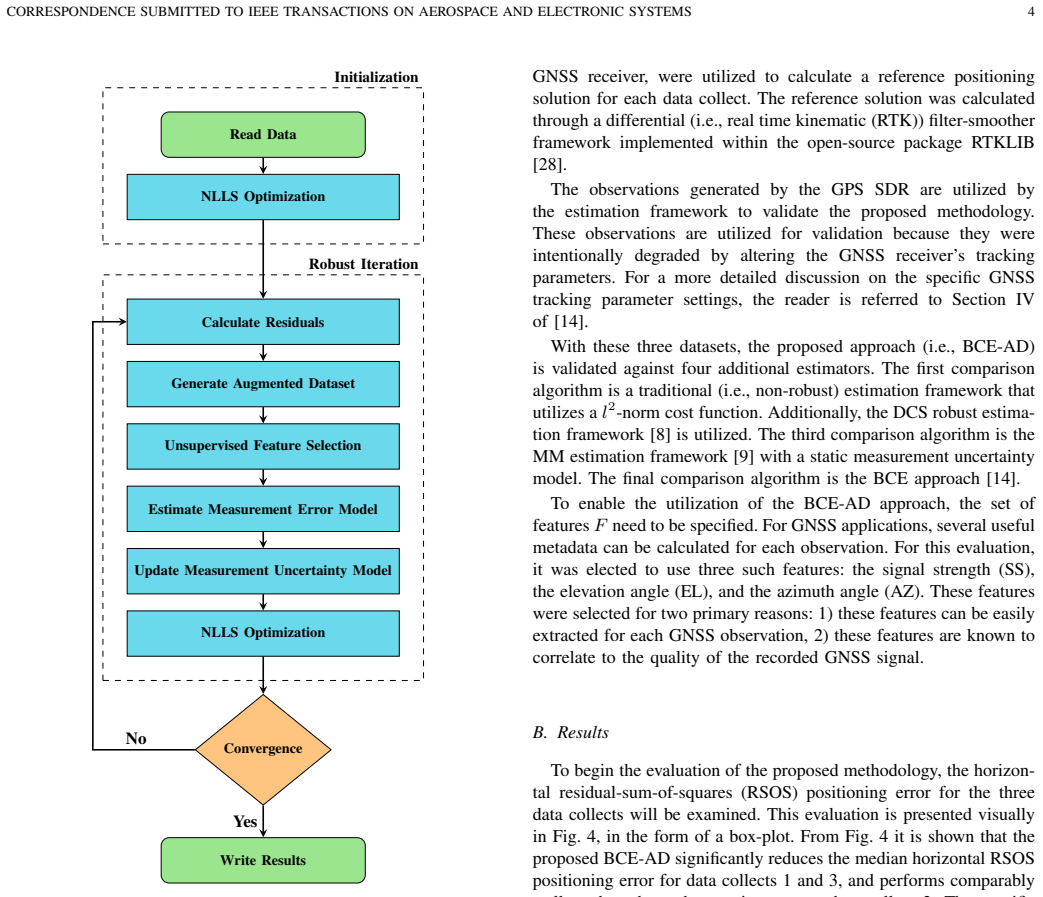
The load-bearing object is the augmented data vector $d_n = (r_n, f_n)$, formed by concatenating a measurement residual with a metadata feature vector. A variational Gaussian mixture model is fit to these augmented vectors, and the resulting cluster assignments partition the original residuals; each cluster's mean and covariance in the residual domain become the updated measurement uncertainty model. Because adding dimensions can make clusters easier to separate but also raises computational cost, the pipeline includes an online feature-selection step—nearest-neighbor graph construction, eigendecomposition, and least-angle regression—that chooses the relevant metadata per iteration. This fit-cluster-update loop is the entire mechanism: it converts external quality indicators into covariance updates without ever requiring a hand-specified robust cost function.
What would settle it
Run BCE-AD with the metadata values randomly permuted across observations while keeping everything else identical; if the median positioning error still improves substantially over BCE, then the improvement cannot be attributed to the metadata's quality information.
Extended reading notes
Core claim
On the paper's own terms, the discovery is that measurement residuals alone can be ambiguous as a domain for learning an uncertainty model, and that projecting them into a higher-dimensional space with quality-correlated metadata makes the clusters that the model needs to find easier to recover. The paper's BCE-AD algorithm iterates: run nonlinear least squares, form residuals, augment each residual with metadata, use unsupervised feature selection to pick the relevant dimensions, fit a variational Gaussian mixture model to the augmented data, map each augmented assignment back onto the residual domain, update each factor's covariance to the sufficient statistics of its assigned component, and repeat until convergence. The experimental claim is that this yields notably lower median horizontal RSOS positioning error than the L2 baseline, dynamic covariance scaling, max-mixtures, and the original BCE on two kinematic GNSS datasets, and comparable performance on a third where the residual-domain partition is already unambiguous.
Load-bearing premise
The load-bearing premise is that the chosen metadata truly correlates with measurement quality, so that adding it to the residual domain separates good from bad observations better than residuals alone.
Editorial extensions
If this is right
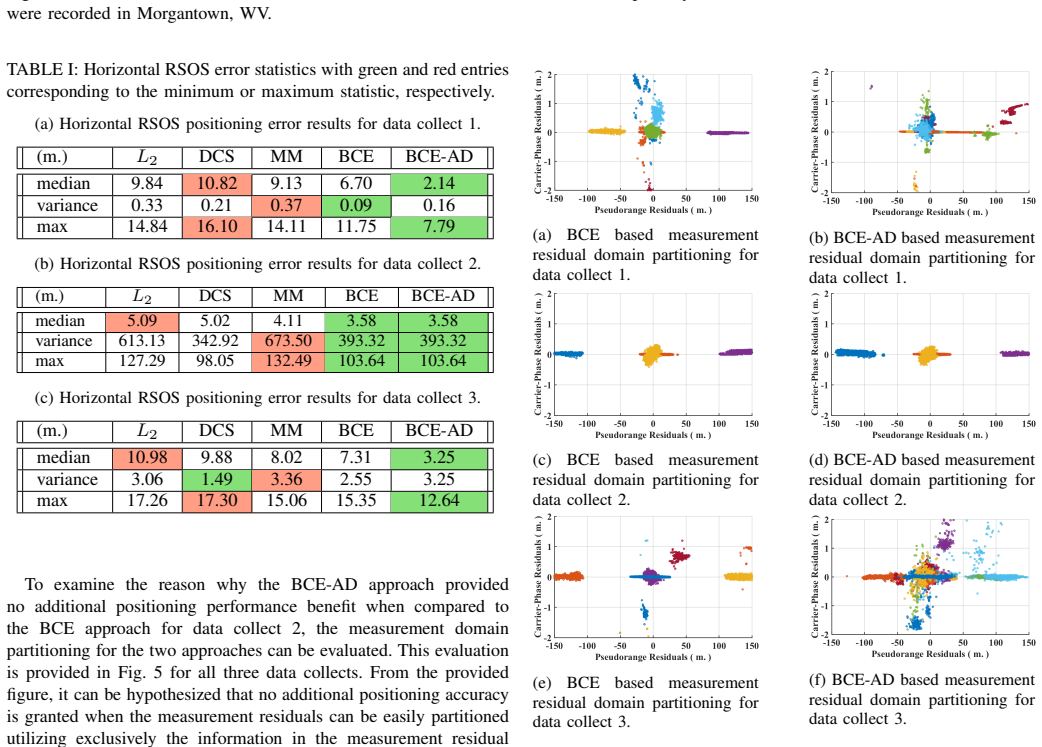
- On the two datasets where residual-only clustering is ambiguous, BCE-AD lowers median horizontal RSOS error from 6.70 m to 2.14 m and from 7.31 m to 3.25 m compared with BCE.
- On the dataset where residual-domain clusters are already clean, BCE-AD matches BCE exactly, and the feature-selection step keeps only residuals—evidence that the gain is tied to separability rather than to extra model capacity.
- Because the pipeline only requires metadata that correlates with observation quality, it transfers to other sensors, e.g., using image illumination or feature age for vision-based estimation, as the paper itself notes.
- Since the selected features change across optimization iterations, the online feature-selection step is not a frill: it prevents irrelevant metadata from degrading the clustering once better state estimates make residual structure clearer.
Reading between the lines
- If the augmentation benefit holds across sensors, then robust estimation becomes a clustering problem with side information, and the practical question shifts to finding cheap metadata that is monotonically related to observation quality rather than designing robust cost functions.
- The three-dataset comparison suggests a control condition for future work: report the residual-domain separability, since BCE-AD should only help when that separability is low. That would turn the paper's post-hoc hypothesis into a testable prediction.
- A natural stress test is to apply BCE-AD to visual odometry or LiDAR, where per-point features like reflectivity, depth uncertainty, or keypoint age are available and where GNSS-style elevation and azimuth metadata are absent.
Signed reviews
Editorial analysis
A structured set of objections, weighed in public.
Referee Report
Summary. The paper proposes BCE-AD, an extension of batch covariance estimation (BCE) for robust state estimation. Instead of fitting a Gaussian mixture model to measurement residuals alone, BCE-AD augments the residuals with metadata (signal strength, elevation, azimuth) and performs variational clustering over the augmented data space, with online feature selection between optimization iterations. The method is evaluated on three kinematic GNSS datasets, using a software-defined receiver with intentionally degraded observations, and compared against l2, DCS, max-mixtures, and BCE baselines. The reported results show lower median horizontal RSOS error for BCE-AD on data collects 1 and 3, and equal performance to BCE on data collect 2. The paper concludes that BCE-AD provides comparable or improved state estimation accuracy compared with previously proposed robust estimation techniques.
Significance. If the reported improvements are statistically reliable, BCE-AD is a valuable extension to robust state estimation because it addresses settings in which residual-domain clustering alone cannot separate good from degraded measurements. The method is well motivated, the baselines are appropriate, and the three datasets have been made publicly available through the authors' earlier BCE paper, which supports reproducibility of the comparison. However, the central empirical claim rests on descriptive statistics alone; no significance tests, confidence intervals, or per-epoch comparisons are provided, and the method shows no gain on one of the three datasets. The conceptual idea is promising, but the current evidence is not sufficient to support the headline claim as stated. I would encourage the authors to add inferential analysis and to reword the 'significant' language accordingly.
major comments (3)
- [Section IV-B, Table I] The claim that BCE-AD 'significantly reduces' the median horizontal RSOS error is not supported by any inferential analysis. The paper reports only the median, variance, and maximum for each estimator and gives no per-epoch counts, confidence intervals, or paired significance tests. Since BCE-AD and BCE have identical statistics on data collect 2 (median 3.58 m and variance 393.32 m^2), and since the improvements on collects 1 and 3 could plausibly arise from sampling variability, the authors should add paired comparisons across epochs (e.g., Wilcoxon signed-rank test or bootstrap confidence intervals) and reserve the word 'significant' for statistically tested differences. The large variance and maximum values on data collect 2 (up to 103.64 m) further indicate that median-only reporting can obscure tail behavior.
- [Section III-B and III-D] The proposed framework is not fully reproducible because key algorithmic parameters are not specified: the truncation level M* for the variational GMM, the convergence threshold for the outer iteration, the variational clustering hyperparameters (including priors), and the feature-selection parameters such as the number of nearest neighbors for the NN graph and the LARS stopping criterion. The paper also does not release code. Without these details, a reader cannot determine whether the reported improvements depend on particular settings, and the experiments cannot be independently replicated. The authors should provide these settings or a reference to a complete implementation.
- [Section III-A, Table II] The paper's core premise, stated in Section III-A, is that features such as signal strength, elevation, and azimuth are known to correlate with measurement quality. This premise is asserted but not validated, and Table II shows that the selected features vary across iterations and datasets with no quantitative justification. A direct check (e.g., correlation of each feature with residual magnitude, or an ablation study adding and removing each feature) would test the premise and would make the observed improvements on collects 1 and 3 more interpretable, especially because no feature beyond residuals is used on data collect 2. Without such evidence, the attribution of the improvement to the augmented data space remains a hypothesis rather than a demonstrated mechanism.
minor comments (6)
- [Section III-A, Eq. (5)] The notation is inconsistent: 'm' is used both as an index and as the number of components, and the relationship between the truncation level M* and the summation limit M is not stated in the equation. Please clarify the indexing and the role of M*.
- [Section IV-A] The number of epochs (sample size) for each data collect is not reported; adding these counts would help interpret the statistics in Table I and would enable paired comparisons across epochs.
- [Fig. 4] The box plot would be easier to interpret if the whisker definition and the handling of outliers were specified, and if the axes were labeled with units.
- [Table I] The color coding described in the caption (green and red entries for minimum and maximum statistics) is not visible in grayscale print; the caption should also state the minimum and maximum values textually for accessibility.
- [Table II] The green/red cell scheme needs a legend; the caption should explicitly define utilized versus non-utilized features, and ideally the numerical feature-selection scores should be reported instead of only binary indicators.
- [Section IV-B and Fig. 5] The claim that residuals are 'easily partitioned' in some datasets is supported only by visual inspection of two-dimensional scatter plots; a quantitative separability measure (e.g., silhouette score) would make the argument more rigorous and would help the reader evaluate the hypothesis about when BCE-AD provides no additional benefit.
Circularity Check
No significant circularity: BCE-AD is an empirical extension of the authors' prior BCE method, validated against external baselines on public datasets; self-citations are not load-bearing.
full rationale
The paper's central claim—that clustering in an augmented data space (residuals plus signal strength, elevation, and azimuth) improves robust state estimation—is not derived from its own inputs; it is tested by comparing BCE-AD against L2, DCS, MM, and BCE on three kinematic GNSS datasets. The only self-citations are to the authors' previous BCE formulation [13], [14] and to the public datasets released there; these serve as a baseline and a data source, not as an argument that BCE-AD is correct. The uncertainty model is fit from measurement residuals and metadata via variational clustering, then used to re-weight the factor graph; this EM-like iteration is an estimation procedure, not a tautology. The paper does not claim to predict a quantity that was used as a fit. The 'significant' language is supported only by descriptive medians (Table I) and lacks significance testing, but that is a statistical-evidence limitation, not circularity. No equation or fitted parameter is renamed as a prediction, and no uniqueness theorem or load-bearing result is imported from the authors' prior work. The improvement claims are therefore self-contained empirical findings, even if their strength is overstated.
Assumptions & free parameters
free parameters (3)
- Truncation level M* =
unknown
- Convergence threshold =
unknown
- Feature selection parameters =
unknown
assumptions (3)
- standard math Variational inference and GMM estimation are valid for the augmented dataset.
- domain assumption Metadata (signal strength, elevation, azimuth) correlate with GNSS measurement quality.
- domain assumption The augmented dataset can be characterized as a GMM.
Cite this review
Pith. "Pith review of Uncertainty Model Estimation in an Augmented Data Space for Robust State Estimation." pith.science (2026). https://pith.science/paper/AJVKCC3I
@misc{pith2026190804372,
  author       = {Pith},
  title        = {Pith review of: Uncertainty Model Estimation in an Augmented Data Space for Robust State Estimation},
  year         = {2026},
  howpublished = {\url{https://pith.science/paper/AJVKCC3I}},
  note         = {Machine review of arXiv:1908.04372}
}
read the original abstract
The requirement to generate robust robotic platforms is a critical enabling step to allow such platforms to permeate safety-critical applications (i.e., the localization of autonomous platforms in urban environments). One of the primary components of such a robotic platform is the state estimation engine, which enables the platform to reason about itself and the environment based upon sensor readings. When such sensor readings are degraded traditional state estimation approaches are known to breakdown. To overcome this issue, several robust state estimation frameworks have been proposed. One such method is the batch covariance estimation (BCE) framework. The BCE approach enables robust state estimation by iteratively updating the measurement error uncertainty model through the fitting of a Gaussian mixture model (GMM) to the measurement residuals. This paper extends upon the BCE approach by arguing that the uncertainty estimation process should be augmented to include metadata (e.g., the signal strength of the associated GNSS observation). The modification of the uncertainty estimation process to an augmented data space is significant because it increases the likelihood of a unique partitioning in the measurement residual domain and thus provides the ability to more accurately characterize the measurement uncertainty model. The proposed batch covariance estimation over an augmented data-space (BCE-AD) is experimentally validated on collected data where it is shown that a significant increase in state estimation accuracy can be granted compared to previously proposed robust estimation techniques.
Figures


Figures from the paper (2 more)
Reference graph
Works this paper leans on
-
[1]
Toward autonomous exploration in confined underwater environments,
A. Mallios, P. Ridao, D. Ribas, M. Carreras, and R. Camilli, “Toward autonomous exploration in confined underwater environments,” Journal of Field Robotics , vol. 33, no. 7, pp. 994–1012, 2016
work page 2016
-
[2]
T. D. Barfoot, State Estimation for Robotics . Cambridge University Press, 2017
work page 2017
-
[3]
Simon, Optimal state estimation: Kalman, H infinity, and nonlinear approaches
D. Simon, Optimal state estimation: Kalman, H infinity, and nonlinear approaches. John Wiley & Sons, 2006
2006
-
[4]
Thrun, W
S. Thrun, W. Burgard, and D. Fox, Probabilistic robotics. MIT press, 2005
2005
-
[5]
Factor graphs for robot perception,
F. Dellaert, M. Kaess et al. , “Factor graphs for robot perception,” Foundations and Trends® in Robotics, vol. 6, no. 1-2, pp. 1–139, 2017
work page 2017
-
[6]
Contribution to the theory of robust estimation,
F. R. Hampel, “Contribution to the theory of robust estimation,” Ph. D. Thesis, University of California, Berkeley , 1968
work page 1968
-
[7]
P. J. Huber, Robust Statistics. Wiley New York, 1981
work page 1981
-
[8]
Robust map optimization using dynamic covariance scaling,
P. Agarwal, G. D. Tipaldi, L. Spinello, C. Stachniss, and W. Burgard, “Robust map optimization using dynamic covariance scaling,” in 2013 IEEE International Conference on Robotics and Automation . Citeseer, 2013, pp. 62–69
work page 2013
Show all 28 references
-
[9]
Inference on networks of mixtures for robust robot mapping,
E. Olson and P. Agarwal, “Inference on networks of mixtures for robust robot mapping,”The International Journal of Robotics Research, vol. 32, no. 7, pp. 826–840, 2013
2013
-
[10]
Random sample consensus: a paradigm for model fitting with applications to image analysis and automated cartography,
M. A. Fischler and R. C. Bolles, “Random sample consensus: a paradigm for model fitting with applications to image analysis and automated cartography,”Communications of the ACM , vol. 24, no. 6, pp. 381–395, 1981
1981
-
[11]
Fault exclusion in multi- constellation global navigation satellite systems,
Y . Zhai, M. Joerger, and B. Pervan, “Fault exclusion in multi- constellation global navigation satellite systems,” The Journal of Navi- gation, vol. 71, no. 6, pp. 1281–1298, 2018
2018
-
[12]
Selecting good measurements vial1 relaxation: A convex approach for robust estimation over graphs,
L. Carlone, A. Censi, and F. Dellaert, “Selecting good measurements vial1 relaxation: A convex approach for robust estimation over graphs,” in 2014 IEEE/RSJ International Conference on Intelligent Robots and Systems. IEEE, 2014, pp. 2667–2674
2014
-
[13]
Batch Measurement Error Covariance Estimation for Robust Localization,
R. M. Watson, C. N. Taylor, R. C. Leishman, and J. N. Gross, “Batch Measurement Error Covariance Estimation for Robust Localization,” in ION GNSS+ 2018 . the Institute of Navigation, 2018, pp. 2429–2439
2018
-
[14]
En- abling Robust State Estimation through Measurement Error Covariance Adaptation,
R. M. Watson, J. N. Gross, C. N. Taylor, and R. C. Leishman, “En- abling Robust State Estimation through Measurement Error Covariance Adaptation,” arXiv preprint arXiv:1906.04055 , 2019
1906 arXiv
-
[15]
Square Root SAM: Simultaneous localization and mapping via square root information smoothing,
F. Dellaert and M. Kaess, “Square Root SAM: Simultaneous localization and mapping via square root information smoothing,” The International Journal of Robotics Research , vol. 25, no. 12, pp. 1181–1203, 2006
2006
-
[16]
Parameter estimation techniques: A tutorial with application to conic fitting,
Z. Zhang, “Parameter estimation techniques: A tutorial with application to conic fitting,” Image and vision Computing, vol. 15, no. 1, pp. 59–76, 1997
1997
-
[17]
Expectation-maximization for adaptive mixture models in graph optimization,
T. Pfeifer and P. Protzel, “Expectation-maximization for adaptive mixture models in graph optimization,” arXiv preprint arXiv:1811.04748 , 2018
2018 arXiv
-
[18]
Geometrical and statistical properties of systems of linear inequalities with applications in pattern recognition,
T. M. Cover, “Geometrical and statistical properties of systems of linear inequalities with applications in pattern recognition,” IEEE transactions on electronic computers , no. 3, pp. 326–334, 1965
1965
-
[19]
Accelerated variational dirich- let process mixtures,
K. Kurihara, M. Welling, and N. Vlassis, “Accelerated variational dirich- let process mixtures,” in Advances in neural information processing systems, 2007, pp. 761–768
2007
-
[20]
An unsupervised approach to modelling visual data,
D. Steinberg, “An unsupervised approach to modelling visual data,” Ph.D. dissertation, University of Sydney., 2013
2013
-
[21]
Monte Carlo methods for signal processing: a review in the statistical signal processing context,
A. Doucet and X. Wang, “Monte Carlo methods for signal processing: a review in the statistical signal processing context,” IEEE Signal Processing Magazine, vol. 22, no. 6, pp. 152–170, 2005
2005
-
[22]
C. M. Bishop, Pattern recognition and machine learning . springer, 2006
2006
-
[23]
Variational inference: A review for statisticians,
D. M. Blei, A. Kucukelbir, and J. D. McAuliffe, “Variational inference: A review for statisticians,” Journal of the American Statistical Association , vol. 112, no. 518, pp. 859–877, 2017
2017
-
[24]
Unsupervised feature selection for multi- cluster data,
D. Cai, C. Zhang, and X. He, “Unsupervised feature selection for multi- cluster data,” in Proceedings of the 16th ACM SIGKDD international conference on Knowledge discovery and data mining . ACM, 2010, pp. 333–342
2010
-
[25]
Least angle and l1 penalized regression: A review,
T. Hesterberg, N. H. Choi, L. Meier, C. Fraley et al., “Least angle and l1 penalized regression: A review,” Statistics Surveys, vol. 2, pp. 61–93, 2008
2008
-
[26]
The levenberg-marquardt algorithm: implementation and theory,
J. J. Mor ´e, “The levenberg-marquardt algorithm: implementation and theory,” in Numerical analysis. Springer, 1978, pp. 105–116
1978
-
[27]
LabSat 3 GPS Simulator,
“LabSat 3 GPS Simulator,” https://www.labsat.co.uk/index.php/en/ products/labsat-3, accessed 3/1/19
-
[28]
RTKLIB: An open source program package for GNSS positioning,
T. Takasu, “RTKLIB: An open source program package for GNSS positioning,” 2011
2011
Reviewed August 14, 2026 · model on record in the stance chip above.
Discussion (0). Continue with ORCID to comment.