REVIEW 3 major objections 6 minor 45 references
Structural, optical and mechanical properties of Cr doped \b{eta}-Ga2O3 single crystals
T0 review · 3 major / 6 minor · reviewed 2026-08-12 · deepseek-v4-flash
Pith's one-line read Adding 200 ppm of chromium hardens beta-gallium oxide single crystals from 13 to 18 GPa.
desk verdict New but modest nanoindentation data on Cr-doped beta-Ga2O3; the hardness dose-response is built on nominal doping concentrations, so treat the exact numbers with caution. read the letter →
The pith
A machine-rendered reading of the paper's core claim, the machinery that carries it, and where it could break.
The reading
What carries the argument
The load-bearing mechanism is solid-solution disorder hardening: Cr3+ ions occupy the octahedral gallium sites, locally deforming the tetrahedral chains and producing low-angle grain boundaries or micro-twins that act as obstacles to dislocation glide. This mechanism is identified spectroscopically through the Raman shoulder at 370.3 cm−1 and the Cr3+ optical transitions at 420 and 597 nm (absorption) and 690 and 697 nm (emission). The same structural disorder that blocks plastic flow lowers the indentation modulus by reducing the packing fraction, which explains why hardness and modulus move in opposite directions.
What would settle it
Measure the actual chromium concentration and its spatial distribution in the exact wafers used for indentation (for example, with SIMS or ICP-MS) and correlate hardness point by point with local Cr content; the linear hardness-versus-doping claim would collapse if the 100 and 200 ppm wafers contain similar or nonuniform Cr levels, or if hardness does not track local Cr content.
Extended reading notes
Core claim
The central claim is that Cr3+ substitutes for Ga3+ at the octahedral sites of monoclinic β-Ga2O3, and the strain and disorder this introduces hardens the crystal by interrupting the movement of indentation-induced dislocations. Structural evidence is the splitting of X-ray rocking curves into multiple broad peaks, a Raman shoulder at 370.3 cm−1 beside the 346.5 cm−1 mode, absorption bands at 420 and 597 nm, and sharp photoluminescence lines at 690 and 697 nm. Mechanically, hardness increases from 13.0 ± 0.6 GPa (undoped) to 15.1 ± 1.0 GPa (100 ppm Cr) and 18.0 ± 0.4 GPa (200 ppm Cr), while indentation modulus decreases from 224.9 ± 21.4 GPa to 202.4 ± 11.9 GPa. The decrease in modulus is attributed to a lower packing fraction caused by the Cr-induced structural disorder.
Load-bearing premise
The paper assumes without elemental analysis that the chromium added to the feed rods (100 and 200 ppm) is incorporated into the crystals at those concentrations and as Cr3+; if actual incorporation is lower or uneven, the hardness trend is not a clean dose-response.
Editorial extensions
If this is right
- Wafer-scale β-Ga2O3 devices could be made more resistant to contact damage by adding 100–200 ppm Cr during growth, with hardness rising roughly 15–38%.
- Because the Cr defects are visible in Raman and photoluminescence spectra, crystal growers can screen wafers for the mechanical hardening effect using quick optical measurements.
- The accompanying drop in indentation modulus means that hardened Cr-doped substrates will be slightly more compliant elastically, which should be factored into wafer handling and epitaxy stress models.
- The pop-in events reported in the load-displacement curves give a direct microscopic signature: the hardening mechanism predicts fewer or shorter pop-ins at higher Cr content as dislocation nucleation is blocked.
Reading between the lines
- If the dose-response is real and not a growth-run artifact, testing intermediate concentrations (e.g., 50 and 150 ppm) would distinguish a smooth linear hardening from a threshold effect.
- The proposed mechanism predicts that annealing the doped crystals should change hardness only if the obstacles are equilibrium defects; if hardness drops on annealing, much of the effect may be quenched-in growth strain rather than Cr itself.
- Other trivalent cations close in size to Ga3+ could plausibly produce similar dislocation-blocking hardening without chromium's strong visible absorptions, which would be preferable for transparent power-electronics substrates.
- A harder-but-softer combination (higher hardness, lower modulus) is a useful test case for atomistic models of β-Ga2O3 plasticity, since most hardening mechanisms raise stiffness as well.
Signed reviews
Editorial analysis
A structured set of objections, weighed in public.
Referee Report
Summary. The manuscript reports growth of undoped and nominally 100 and 200 ppm Cr-doped β-Ga2O3 single crystals by the optical floating zone method, with characterization by HRXRD rocking curves, Raman spectroscopy, UV-Vis absorption, photoluminescence, and nanoindentation. The main results are: (i) Cr doping introduces structural disorder visible as multiple rocking-curve peaks and Raman broadening; (ii) Cr3+ is claimed to substitute at octahedral Ga sites, giving absorption bands near 420/597 nm and PL lines at 690/697 nm; and (iii) nanoindentation at 1 mN shows hardness increasing from 13.0±0.6 to 18.0±0.4 GPa with nominal Cr content, while indentation modulus decreases from about 225 GPa to about 202 GPa. The authors attribute the hardening to Cr-induced defects impeding dislocation motion.
Significance. If the reported dose-response is quantitatively correct, doping with roughly 100-200 ppm Cr is a simple melt-growth route to increase the hardness of β-Ga2O3 by about 40% while preserving high optical transparency, which would be practically useful in device fabrication. The paper has several strengths: it is a direct experimental study with no circular derivation; the Oliver-Pharr nanoindentation protocol is conventional and the pure-crystal modulus (225 GPa) is consistent with the literature value of ~232 GPa; and the PL and absorption data provide independent evidence that Cr3+ occupies Ga sites. The principal limitation is that the concentration axis is nominal feed composition rather than measured dopant content, and the small number of doping levels prevents a robust claim of linearity.
major comments (3)
- [§2 and §3.5] The concentration axis in Fig. 6b and the central claim of a 'nearly linear' hardness increase with Cr doping rest on the nominal Cr2O3 content added to the feed rod, not on a measured Cr concentration in the indented wafers. Section 2 reports only that feed rods were prepared with stoichiometric amounts of Cr2O3; no ICP-MS, SIMS, EDX, or other elemental analysis is provided. In optical floating zone growth, segregation between the molten zone and the growing crystal can make the incorporated concentration differ from the feed. The PL and absorption data demonstrate the presence of Cr3+ and its increase with nominal doping, but they are not quantitative composition measurements. Without this calibration, the dose-response and the specific statement 'upon Cr doping of 200 ppm' are not fully supported. Please add direct composition measurements of the measured wafers, or explicitly reframe the claim as applying to crystals grown from feeds containing 100 and 200 ppm Cr2O3 and remove the linearity statement.
- [§3.5, Fig. 6b, and abstract] The indentation modulus data are 224.9±21.4 GPa (0 ppm), 198.5±5.9 GPa (100 ppm), and 202.4±11.9 GPa (200 ppm). The abstract's statement that the modulus 'decreases from 224.9 ± 21.4 to 202.4 ± 11.9 GPa upon Cr doping of 200 ppm' is true only as an endpoint comparison; the 100-ppm value is lower than the 200-ppm value, and the two doped values are statistically indistinguishable. The text's phrase 'decreases downto ~198.5 ... and ~202.4' implies a monotonic trend that is not present in the data. Please revise to report the endpoint difference or explicitly note the non-monotonic, within-error behavior.
- [§3.1 and §3.5] The hardness claim of a 'nearly linear' increase is based on only three doping levels: 13.0±0.6, 15.1±1.0, and 18.0±0.4 GPa. Even if the concentrations are accurately known, three points with error bars of about 1 GPa can support at most a monotonic increase, not linearity. Please use 'monotonic increase' or fit the data with an explicit functional form and report the goodness of fit.
minor comments (6)
- [Abstract and §3.1] The abstract reports the undoped rocking-curve FWHM as 106 arcsec, while Section 3.1 and Fig. 2b report 104 arcsec; please reconcile this discrepancy.
- [§3.4] The text states that the PL emission was excited at 260 nm, while the Fig. 5 caption says 255 nm; please make the excitation wavelength consistent.
- [§3.1] There is a typo in the sentence 'their FHHM increase with Cr doping concentration'; it should be 'FWHM' rather than 'FHHM'.
- [§3.5] The sentence 'The indentation pure Ga2O3 wafers hardness is still lower as compared to Cr doped β-Ga2O3 crystal' is grammatically garbled and should be rephrased, for example as 'The hardness of the pure Ga2O3 wafers is still lower than that of the Cr-doped crystals.'
- [Fig. 6b] The x-axis is labeled 'Cr concentration (ppm)'; since only nominal feed concentrations are reported, the label should read 'nominal Cr concentration (ppm)' unless direct measurements are added.
- [§3.3] The optical band gaps are reported as 4.64, 4.63, and 4.60 eV without uncertainties; adding error bars or stating the resolution would make the observed 0.04 eV decrease more assessable.
Circularity Check
No circularity: the hardness/modulus trend is a direct measurement, not a derived quantity fitted to the doping axis.
full rationale
This paper is an experimental characterization study: undoped and Cr-doped β-Ga2O3 crystals were grown, and hardness/modulus values were directly measured by nanoindentation with Oliver-Pharr analysis. The central claim—that hardness increases from 13.0 to 17.9 GPa while modulus decreases from 224.9 to 202.4 GPa with 200 ppm Cr doping—is a reported set of measurements, not a quantity derived from an assumed model or from the doping concentration itself. There is no fitted parameter, no equation that maps Cr concentration to hardness, and no prediction that uses the target result as an input. The structural/optical assignments (rocking curve broadening, Raman shoulder at 370 cm-1, absorption bands at 420/597 nm, PL lines at 690/697 nm) are qualitative spectroscopic identifications compared against published transition assignments; none of these arguments imports the hardness result as a premise. Self-citations appear only as routine references to the authors' prior growth method paper (Ref. [31]) and as external comparisons (e.g., Ref. [21] for modulus of undoped β-Ga2O3); none are load-bearing for the claimed doping-hardness trend. The skeptical concern that the actual incorporated Cr concentration was not measured by elemental analysis is a correctness/validity issue about the composition axis, not a circularity issue: the measured hardness trend is independent of whether the nominal ppm values are accurate. Thus the paper contains no circular derivation chain and merits a score of 0.
Assumptions & free parameters
assumptions (3)
- domain assumption Nominal Cr2O3 content in the feed equals actual Cr3+ incorporation in the grown crystals.
- domain assumption The Raman shoulder at 370.3 cm-1 and the broadening near 350 cm-1 indicate Cr3+ occupying octahedral Ga sites.
- domain assumption Oliver-Pharr nanoindentation analysis at 1 mN gives hardness and modulus values that are not significantly affected by indentation size effects or surface preparation.
Cite this review
Pith. "Pith review of Structural, optical and mechanical properties of Cr doped \b{eta}-Ga2O3 single crystals." pith.science (2026). https://pith.science/paper/AKMB2ZOC
@misc{pith2026241119010,
  author       = {Pith},
  title        = {Pith review of: Structural, optical and mechanical properties of Cr doped \beta-Ga2O3 single crystals},
  year         = {2026},
  howpublished = {\url{https://pith.science/paper/AKMB2ZOC}},
  note         = {Machine review of arXiv:2411.19010}
}
read the original abstract
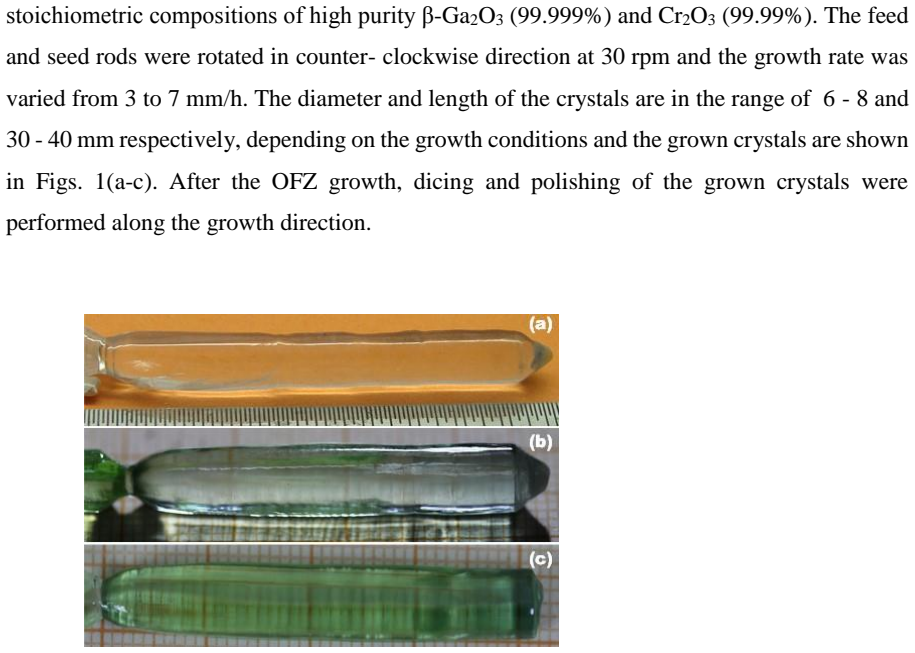
Undoped and Cr doped \b{eta}-Ga2O3 (100) single crystals are grown by optical floating zone method. The full width at half maximum of rocking curve is found to be 106 arcsec for undoped Ga2O3 crystals whereas the 100 and 200 ppm of Cr doped Ga2O3 crystals display multiple rocking curves with large peak widths indicating the presence of structural defects. Raman measurements reveal broadening in the vibrational mode of ~ 350 cm-1 with a shoulder peak indicating the Cr3+ dopants preferentially substitute for Ga3+ at the octahedral sites. Further, the Cr doped Ga2O3 crystals display strong optical absorption bands about 420 and 597 nm in the UV-Vis spectroscopy. Moreover, the observation of sharp characteristic photoluminescence emission lines at 690 and 697 nm also confirms the Cr substitution in the doped crystals. The indentation hardness increases nearly linear from 13.0 to 17.9 GPa whilst the indentation modulus decreases from 224.9 to 202.4 GPa upon Cr doping of 200 ppm in \b{eta}-Ga2O3. The structural defects caused by the Cr doping interrupt the movement of indentation induced dislocations that results in the increase of hardness of the Cr doped \b{eta}-Ga2O3 (100) single crystals.
Figures


Figures from the paper (3 more)


Reference graph
Works this paper leans on
-
[1]
Introduction Over the past few decades, the β-Ga2O3 has attracted much attention of researchers due to its ultrawide bandgap (4.9 eV), opto -electronic characteristics, chemical stability and radiation hardness. Owing to these unique physical and chemical properties, β -Ga2O3 is considered to be a promising candidate for wide range of applications which i...
-
[2]
The (100) oriented seeds were used to grow large single crystals
Experimental methods The pure and Cr doped (100 & 200 ppm) β -Ga2O3 single crystals were grown by OFZ using the four -mirror halogen lamp based FZ-T-4000-H-HR-I-VPO-PC OFZ crystal growth system (Crystal System Corp., Japan) and the details can be found elsewhere [31]. The (100) oriented seeds were used to grow large single crystals. The feed rods were pre...
-
[3]
High resolution X-ray diffraction Fig
Results and Discussion 3.1. High resolution X-ray diffraction Fig. 2a shows the Laue diffraction pattern of pure β-Ga2O3 crystal. The sharp and bright diffraction spots confirms the single crystalline nature. Figs. 2(b-d) display the rocking curves recorded for pure and doped β-Ga2O3 crystal wafers on (100) diffracting planes. As shown in the Fig. 2(b-d),...
-
[4]
The growth parameters were optimized and the crystals were grown along (100) orientation
Conclusions The p ure and Cr doped β -Ga2O3 single crystals were grown by four mirror optical floating zone technique. The growth parameters were optimized and the crystals were grown along (100) orientation. The Cr dopants in β-Ga2O3 introduced certain structural disorder in the lattice as evidenced by rocking curve analysis. The high optical transparenc...
-
[5]
Acknowledgement One of the authors, P.V., is thankful to IGCAR for the award s of Research Associate and Visiting Scientist Fellowships. 12 Author contribution: P. Vijayakumar - Investigation, Methodology, Formal analysis, Data curation, Writing- Original draft; K. Ganesan – Investigation, Formal analysis, Writing- Review & editing; R.M. Sarguna, Edward P...
- [6]
-
[7]
A. S. Pratiyush, U. U. Muazzam, S. Kumar, P. Vijayakumar, S. Ganesamoorthy, N. Subramanian, R. Muralidharan, and D. N. Nath, IEEE Photonics Technol. Lett. 31, 923 (2019)
work page 2019
- [8]
Show all 45 references
-
[9]
A. J. Wojtowicz, M. E. Witkowski, W. Drozdowski, M. Makowski, and Z. Galazka, Heliyon 9, e21240 (2023)
2023
-
[10]
J. Ding, P. Zhao, H. Chen, and H. Fu, Appl. Phys. A Mater. Sci. Process. 130, 350 (2024)
2024
-
[11]
T. K. O. Vu, M. T. Tran, B. T. T. Phuong, N. T. M. Hien, and E. K. Kim, Appl. Phys. A Mater. Sci. Process. 129, 600 (2023)
2023
-
[12]
O. M. Bordun, B. O. Bordun, I. Y. Kukharskyy, D. M. Maksymchuk, and I. I. Medvid, Phys. Chem. Solid State 24, 490 (2023)
2023
-
[13]
X. Long, W. Niu, L. Wan, X. Chen, H. Cui, Q. Sai, C. Xia, D. N. Talwar, and Z. Feng, Crystals 11, 1 (2021)
2021
-
[14]
E. B. Shaik, C. S. Kamal, K. Srinivasu, B. V. N. Kumar, P. K. Balla, R. D. K. Swamy, and K. R. Rao, J. Mater. Sci. Mater. Electron. 31, 6185 (2020). 13
2020
-
[15]
Shi and H
F. Shi and H. Qiao, CrystEngComm 22, 7794 (2020)
2020
-
[16]
R. Sun, Y. K. Ooi, P. T. Dickens, K. G. Lynn, and M. A. Scarpulla, Appl. Phys. Lett. 117, 052101 (2020)
2020
-
[17]
W. Mu, Z. Jia, G. Cittadino, Y. Yin, C. Luperini, Q. Hu, Y. Li, J. Zhang, M. Tonelli, and X. Tao, Cryst. Growth Des. 18, 3037 (2018)
2018
-
[18]
Choi and J
M. Choi and J. Son, Curr. Appl. Phys. 17, 713 (2017)
2017
-
[19]
Makowski, W
M. Makowski, W. Drozdowski, M. E. Witkowski, A. J. Wojtowicz, K. Irmscher, R. Schewski, and Z. Galazka, Opt. Mater. Express 9, 3738 (2019)
2019
-
[20]
Y. Shen, T. Li, X. Zhong, G. Li, A. Li, D. Wei, Y. Zhang, and K. Wei, Vacuum 172, 109036 (2020)
2020
-
[21]
López, E
I. López, E. Nogales, B. Méndez, J. Piqueras, A. Peche, J. Ramírez-Castellanos, and J. M. González-Calbet, J. Phys. Chem. C 117, 3036 (2013)
2013
-
[22]
W. Mu, Y. Yin, Z. Jia, L. Wang, J. Sun, M. Wang, C. Tang, Q. Hu, Z. Gao, J. Zhang, N. Lin, S. Veronesi, Z. Wang, X. Zhao, and X. Tao, RSC Adv. 7, 21815 (2017)
2017
-
[23]
Zhang, C
J. Zhang, C. Xia, Q. Deng, W. Xu, H. Shi, F. Wu, and J. Xu, J. Phys. Chem. Solids 67, 1656 (2006)
2006
-
[24]
Suzuki, S
N. Suzuki, S. Ohira, M. Tanaka, T. Sugawara, K. Nakajima, and T. Shishido, Phys. Status Solidi Curr. Top. Solid State Phys. 4, 2310 (2007)
2007
-
[25]
B. Fu, G. Jian, W. Mu, Y. Li, H. Wang, Z. Jia, Y. Li, S. Long, Y. Shi, and X. Tao, J. Alloys Compd. 896, 1 (2022)
2022
-
[26]
V. I. Nikolaev, A. V. Chikiryaka, L. I. Guzilova, and A. I. Pechnikov, Tech. Phys. Lett. 45, 1114 (2019)
2019
-
[27]
Hoshikawa, T
K. Hoshikawa, T. Kobayashi, and E. Ohba, J. Cryst. Growth 546, 125778 (2020)
2020
-
[28]
Luchechko, V
A. Luchechko, V. Vasyltsiv, Y. Zhydachevskyy, M. Kushlyk, S. Ubizskii, and A. Suchocki, J. Phys. D. Appl. Phys. 53, 354001 (2020)
2020
-
[29]
Huang, H
Y. Huang, H. Wu, Y. Zhi, Y. Huang, D. Guo, Z. Wu, P. Li, Z. Chen, and W. Tang, Appl. Phys. A Mater. Sci. Process. 124, 611 (2018)
2018
-
[30]
Y. Yao, Y. Sugawara, K. Sasaki, A. Kuramata, and Y. Ishikawa, J. Appl. Phys. 134, 215106 (2023). 14
2023
-
[31]
Jõgiaas, A
T. Jõgiaas, A. Tarre, H. Mändar, J. Kozlova, and A. Tamm, Nanomaterials 12, 82 (2022)
2022
-
[32]
Yamaguchi, S
H. Yamaguchi, S. Watanabe, Y. Yamaoka, K. Koshi, and A. Kuramata, Jpn. J. Appl. Phys. 61, 045506 (2022)
2022
-
[33]
A. K. Battu and C. V. Ramana, Adv. Eng. Mater. 20, 1 (2018)
2018
-
[34]
T. Hou, W. Zhang, W. Mu, C. Li, X. Li, X. Ma, J. Zhang, H. Wang, Z. Jia, D. Liu, and X. Tao, Mater. Sci. Semicond. Process. 158, 107357 (2023)
2023
-
[35]
S. Gao, X. Yang, J. Cheng, X. Guo, and R. Kang, Mater. Charact. 200, 112920 (2023)
2023
-
[36]
Vijayakumar, D
P. Vijayakumar, D. Joseph Daniel, M. Suganya, N. Duy Quang, and H. J. Kim, J. Cryst. Growth 634, 127676 (2024)
2024
-
[37]
E. G. Víllora, S. Arjoca, K. Shimamura, D. Inomata, and K. Aoki, Proc. SPIE, Oxide- Based Mater. Devices V 8987, 89871U (2014)
2014
-
[38]
B. Liu, M. Gu, and X. Liu, Appl. Phys. Lett. 91, 3 (2007)
2007
-
[39]
T. H. T. Onuma, S. Fujioka, T. Yamaguchi, Y. Itoh, M. Higashiwaki, K. Sasaki, T. Masui, J. Cryst. Growth 401, 330 (2014)
2014
-
[40]
M. D. Mia, B. C. Samuels, P. D. Borges, L. Scolfaro, A. Siddique, J. K. Saha, A. A. Talukder, and R. Droopad, Appl. Phys. A Mater. Sci. Process. 128, 366 (2022)
2022
-
[41]
Y. Zhuo, Z. Chen, W. Tu, X. Ma, Y. Pei, and G. Wang, Appl. Surf. Sci. 420, 802 (2017)
2017
-
[42]
J. B. Varley, J. R. Weber, A. Janotti, and C. G. Van De Walle, Appl. Phys. Lett. 97, 142106 (2010)
2010
-
[43]
X. Ma, Y. Zhang, L. Dong, and R. Jia, Results Phys. 7, 1582 (2017)
2017
-
[44]
Tokida and S
Y. Tokida and S. Adachi, J. Appl. Phys. 112, 063522 (2012)
2012
-
[45]
Lorenz, A
D. Lorenz, A. Zeckzer, U. Hilpert, P. Grau, H. Johansen, and H. S. Leipner, Phys. Rev. B - Condens. Matter Mater. Phys. 67, 172101 (2003)
2003
Reviewed August 12, 2026 · model on record in the stance chip above.
Discussion (0). Continue with ORCID to comment.