REVIEW 4 major objections 7 minor 76 references
Energy Consumption Optimization, Response Time Differences and Indicators in Cortical Working Memory Revealed by Nonequilibrium
T0 review · 4 major / 7 minor · reviewed 2026-08-12 · deepseek-v4-flash
Pith's one-line read In a 30-area cortical model, a larger share of global connections cuts the energy cost of working memory by an order of magnitude while preserving stability, and the lower-to-higher-area response order is intrinsic to the network.
desk verdict Solid but unvalidated modeling application; the order-of-magnitude EPR claim rests on a Gaussian-mixture closure that needs direct simulation checks before I'd trust it. read the letter →
The pith
A machine-rendered reading of the paper's core claim, the machinery that carries it, and where it could break.
The reading
What carries the argument
The central object is the nonequilibrium potential landscape $U = -\ln P_{\mathrm{ss}}$ together with the steady-state probability flux $J_{\mathrm{ss}}$, defined on the 90-dimensional state space of 30 cortical areas, each with three populations. The argument is carried by the force decomposition $F = -D G \cdot \nabla U + J_{\mathrm{ss}}/P_{\mathrm{ss}} + D\nabla \cdot G$, the entropy production rate $\dot S = \int J \cdot (DG)^{-1}\cdot J / P \, dx$, and the Onsager-Machlup path integral whose minimized action selects the dominant transition path between attractors. All of these quantities are computed under a self-consistent mean-field approximation that represents the steady-state distribution as a weighted sum of Gaussian distributions around each attractor, with mean and variance evolved through linearized moment equations.
What would settle it
Run direct stochastic simulations of the same 30-area network with small diffusion, estimate the entropy production rate from long trajectories (for example via time-irreversibility of cross-correlations or by measuring the flux), and check whether increasing global coupling G still produces a tenfold drop in EPR while the memory states stay equally stable; if the drop disappears or reverses under this non-Gaussian sampling, the central energy-efficiency claim is refuted.
Extended reading notes
Core claim
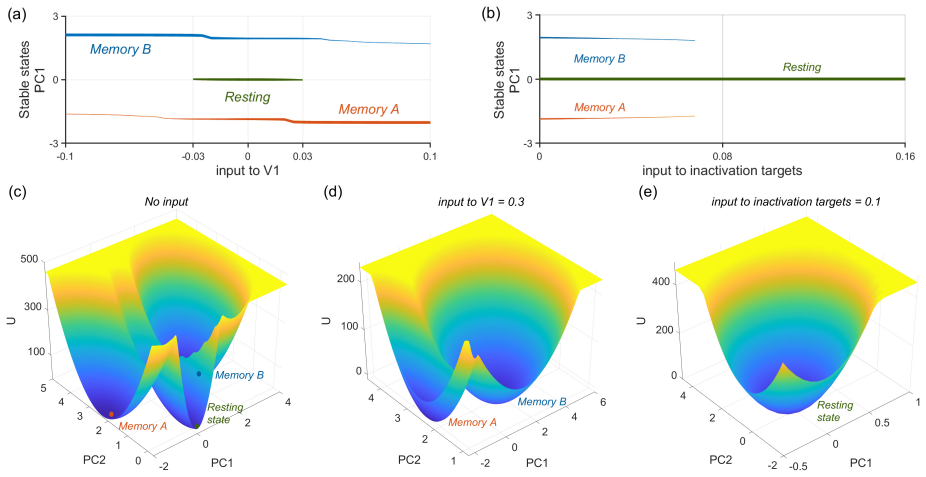
The central discovery, stated on the paper's own terms, is that the thermodynamic cost and response-time structure of distributed working memory are controlled by the balance between global and local connectivity. In the 30-area Wong-Wang model of the macaque cortex, the authors compute the nonequilibrium steady-state probability distribution approximately, decompose the driving force into a landscape gradient and a rotational probability flux, and identify dominant transition paths by minimizing the Onsager-Machlup action. Along the path from resting to memory state, primary sensory areas such as V1 and MT rise first, while higher-order areas ramp later; the same order appears when the stimulus is delivered to different areas, so the temporal scale disparity is an inherent attribute rather than an effect of the stimulus location. Along the bifurcation curve where the resting state disappears, memory states have equal relative stability, yet increasing global coupling strength lowers the entropy production rate by more than an order of magnitude. Since the entropy production rate measures the thermodynamic cost of maintaining the steady state, the paper concludes that a more globally connected network achieves the same memory stability at lower energy dissipation, which it interprets as an evolutionary advantage of long-distance cortical connections.
Load-bearing premise
The whole quantitative framework rests on the assumption that the steady-state probability distribution of the 90-dimensional network is well captured by a weighted sum of Gaussians around each attractor; if the true distribution is significantly non-Gaussian in the strongly nonlinear regime, the computed entropy production rates and the order-of-magnitude reduction could be numerical artifacts.
Editorial extensions
If this is right
- If the temporal hierarchy is intrinsic, then observed latency differences between sensory and association areas do not require stimulus-specific routing explanations; they follow from the network's hierarchical connectivity alone.
- If global connections lower energy cost at equal stability, then the evolutionary expansion of long-range cortical connections may be driven at least in part by thermodynamic efficiency rather than only by robustness.
- Entropy production rate and average probability flux change sharply and early as the network approaches a bifurcation, making them candidate early-warning indicators for imminent cortical state transitions.
- The time-irreversibility measure (forward-backward cross-correlation difference) and critical slowing down (autocorrelation relaxation) are obtainable from time-series data, offering experimentally accessible ways to detect latent state transitions.
- The energy-stability-flexibility analysis points to an optimal balance between global and local connectivity: near the tangent of EPR and relative-stability isolines, the network gets the most stability per unit of thermodynamic cost.
Reading between the lines
- The Gaussian-mixture closure is load-bearing for the quantitative factor of ten; if the true steady-state distribution is non-Gaussian, the qualitative direction of the result might survive but the exact magnitude could change. This is an editorial caution, not a claim of the paper.
- A direct experimental test of the temporal-hierarchy claim: optogenetically stimulate a high-order association area and record lower-order sensory areas during working memory; the intrinsic ordering predicts lower-order areas still ramp earlier during memory encoding.
- The same landscape-flux machinery could be applied to other multistable biological networks with tunable global coupling, such as gene regulatory circuits or ecological systems, to see whether global coupling similarly lowers thermodynamic cost while preserving multistability.
- One could estimate EPR, flux, and time-irreversibility indicators from empirical calcium or electrode recordings during gradual pharmacological perturbation, comparing the predicted early rise before state transitions against measured autocorrelation and forward-backward cross-correlation asymmetry.
Editorial analysis
A structured set of objections, weighed in public.
Referee Report
Summary. This paper applies nonequilibrium landscape-flux theory to a 30-area large-scale cortical network model of working memory. The authors construct a Gaussian-mixture approximation to the steady-state distribution of the 90-dimensional Fokker-Planck equation, compute the nonequilibrium potential landscape, entropy production rate (EPR), and dominant transition paths, and report three main results: (i) the temporal ordering of area responses during memory-state transitions is an intrinsic property independent of stimulus location; (ii) increasing the fraction of global connections reduces EPR by about an order of magnitude while preserving memory-state stability, indicating an energy-efficient evolutionary organization; and (iii) thermodynamic and dynamical indicators (EPR, flux, autocorrelation, cross-correlation asymmetry) show precursor changes before bifurcations, offering early-warning signals. All results are model-derived, with no fitting to external data.
Significance. The framework is a reasonable extension of previous work (Mejias & Wang 2022; Yan & Wang 2020) and addresses a timely question—thermodynamic cost of distributed working memory—with no circular fitting. If the Gaussian-mixture closure is validated, the EPR-stability trade-off result would be an interesting theoretical prediction about global versus local connectivity. The path-optimization treatment of transition dynamics is a strength because it uses the original force rather than the linearized approximation, so the temporal-hierarchy result is less susceptible to the closure error. However, the central quantitative claims are computed from an unvalidated ansatz and the manuscript provides no code or data, so the current evidence is insufficient to establish the conclusions.
major comments (4)
- [3.2] The quantitative results—landscape U, probability flux Jss, entropy production rate, and path action—are all computed from the Gaussian-mixture ansatz Pss = Σ_l w_l N(μ_l, Σ_l), where μ_l and Σ_l come from linearized moment equations and w_l from basin-of-attraction sampling. In a strongly nonlinear, multistable system with saddle-node bifurcations, the true stationary density is generally non-Gaussian, and the anharmonic barrier region can dominate transitions and entropy production. No comparison with direct numerical simulation of the 90-dimensional stochastic differential equations, or with a higher-order closure, is provided in the manuscript or in any code/data release. The order-of-magnitude EPR reduction along the white line in Fig. 3a could therefore be an artifact of the closure. The authors should validate the approximation (e.g., by simulating the SDE for selected parameter points and comparing the computed Pss, EPR, and action) before the central claim is accepted.
- [2.3, Fig. 3a] The stability comparison underlying the claim 'a higher fraction of global connections can significantly reduce the entropy production rate over an order of magnitude while maintaining stability' is not well founded. The text states that on the white bifurcation line ΔU → ∞, and then asserts that 'as the ΔU remains the same along the bifurcation line, the stabilities of the memory states are similar.' At a saddle-node bifurcation, the memory state is marginal, not robustly stable; an infinite potential difference does not provide a meaningful common baseline. Moreover, the paper itself admits that relative stability does not exactly pin down global stability. The subsequent action and MFPT analysis in Fig. 3d-f is performed at fixed Jmax = 0.243 while varying G, not along the white line, so it does not directly support the claim. A clear definition of ΔU and a stability comparison along constant-action or constant-MFPT curves is needed.
- [2.2] The conclusion that 'the temporal scale disparity is an inherent attribute, rather than a consequence of the stimulus input area' is not demonstrated. All path computations use a stimulus applied to V1, which is at the bottom of the hierarchy. To support stimulus-location independence, the authors need to apply the same transition-path analysis with inputs to higher-order areas (or to multiple areas) and show that the ordering of response times is unchanged. Without this comparison, the observed hierarchy may simply reflect the known gradient of connectivity and the chosen input location.
- [2.4] The early-warning indicators are presented as 'practical methods for the prediction and detection of state switching,' but the manuscript does not establish that these computed quantities correspond to observable signatures in the actual network. The EPR and average flux values are derived from the Gaussian-mixture closure, while the autocorrelation and ΔCC results are based on simulated trajectories whose relationship to the large-scale model's real stochastic dynamics is not validated. For the claimed practical utility, the authors should demonstrate that the trends persist in direct SDE simulations and, ideally, discuss how noisy, finite-length experimental time series would be processed.
minor comments (7)
- [3.4] Section 3.4 contains a leftover phrase 'governing transitions between savanna and forest ecosystems' that appears to be copied from a different application; it should be removed.
- [3.2] Section 3.2 uses 'donates' where 'denotes' is intended (e.g., 'which donates the net flow').
- [2.1 and 2.4] The bifurcation threshold for inactivation is given as 0.083 in Sec. 2.1 and as 0.085 in Sec. 2.4; please make the values consistent.
- [Data Availability] The Data Availability statement says 'All data is included in the manuscript and/or supporting information,' but no supporting information or code is provided; please clarify what data are available and how the figures can be reproduced.
- [References] References [31] and [59] are the same reference (Cao et al., Nat. Phys. 2015), as are [32] and [60] (Lan et al., Nat. Phys. 2012); these duplicates should be merged.
- [3.1] In Sec. 3.1, the statistical properties of S_noise are not specified (mean, variance, correlation time), which makes the noise model ambiguous.
- [Figure 3a] Figure 3a caption should state that the EPR color scale is logarithmic, since the text refers to a 'logarithmic trend.'
Circularity Check
No circularity found: the paper's quantitative claims are model-derived outputs under scanned parameters, not predictions equivalent to fitted inputs or self-citation chains.
full rationale
The paper's central results—order-of-magnitude entropy production reduction along the bifurcation line, the temporal hierarchy of response times, and the early-warning indicators—are all computed by forward evaluation of a published large-scale cortical network model under scanned parameters G and Jmax. Nothing in the manuscript fits a parameter to a subset of data and then 'predicts' a closely related quantity; the EPR, relative stability, action, and MFPT are separate functionals of the same steady-state distribution and path calculus. The Gaussian-mixture closure in Sec. 3.2 is an approximation, and its accuracy is a legitimate robustness concern, but an uncontrolled approximation is not circularity: the closure is not defined in terms of any target result, and the paper does not use the claimed conclusions to select the closure. Self-citations to prior landscape-flux methodology and to model parameters are methodological support, not the load-bearing justification of the new biological claims; the model itself is independently published and is not invoked as if it already contained the paper's conclusions. No equation or definition makes a predicted quantity equivalent to an input by construction. Therefore no specific circular step can be exhibited, and the appropriate finding is no significant circularity.
Assumptions & free parameters
free parameters (4)
- Global coupling strength G =
Scanned (default 0.48)
- Max local synaptic strength Jmax =
Scanned (baseline 0.42 nA)
- Noise intensity sigma =
Not precisely specified
- FLN rescaling constants k1, k2 =
k1=1.2, k2=0.3
assumptions (4)
- domain assumption The steady-state probability distribution is a weighted sum of Gaussians (self-consistent mean-field closure).
- domain assumption The noise is small enough that a linear expansion of the transfer function phi is valid.
- domain assumption The Wong-Wang local circuit model is an accurate description of each cortical area.
- domain assumption The macaque tract-tracing data (FLN) and the hierarchy values from SLN are reliable.
Cite this review
Pith. "Pith review of Energy Consumption Optimization, Response Time Differences and Indicators in Cortical Working Memory Revealed by Nonequilibrium." pith.science (2026). https://pith.science/paper/AQLPGO3F
@misc{pith2026241117206,
  author       = {Pith},
  title        = {Pith review of: Energy Consumption Optimization, Response Time Differences and Indicators in Cortical Working Memory Revealed by Nonequilibrium},
  year         = {2026},
  howpublished = {\url{https://pith.science/paper/AQLPGO3F}},
  note         = {Machine review of arXiv:2411.17206}
}
read the original abstract
The neocortex, a complex system driving multi-region interactions, remains a core puzzle in neuroscience. Despite quantitative insights across brain scales, understanding the mechanisms underlying neural activities is challenging. Advances from Hopfield networks to large-scale cortical models have deepened neural network theory, yet these models often fall short of capturing global brain functions. In large-scale cortical networks, an intriguing hierarchy of timescales reflects diverse information processing speeds across spatial regions. As a non-equilibrium system, the brain incurs significant energy costs, with long-distance connectivity suggesting an evolutionary spatial organization. To explore these complexities, we introduce a nonequilibrium landscape flux approach to analyze cortical networks. This allows us to quantify potential landscapes and principal transition paths, uncovering dynamical characteristics across timescales. We examine whether temporal hierarchies correlate with stimuli distribution and how hierarchical networks exhibit differential responses. Furthermore, our analysis quantifies the thermodynamic cost of sustaining cognition, highlighting a link to network connectivity. These findings provide insights into energy consumption during cognitive processes and emphasize the spatial benefits for working memory tasks. Experimental validation is challenging due to evolutionary variability, making our theoretical approach valuable for quantifying complex dynamics. By assessing time irreversibility and critical slowdown, we gain predictive insights into network bifurcations and state transitions, offering practical tools for identifying cortical state changes. These results advance our understanding of cortical dynamics.
Figures


Figures from the paper (4 more)


Reference graph
Works this paper leans on
-
[1]
Wang, Annual Review of Neuroscience 45, 533 (2022)
X.-J. Wang, Annual Review of Neuroscience 45, 533 (2022)
work page 2022
-
[2]
Sporns, Networks of the Brain (MIT Press, 2010)
O. Sporns, Networks of the Brain (MIT Press, 2010)
work page 2010
-
[3]
J. G. White, E. Southgate, J. N. Thomson, and S. Brenner, Philos Trans R Soc Lond B Biol Sci 314, 1 (1986)
work page 1986
-
[4]
L. W. Swanson and J. W. Lichtman, Annu Rev Neurosci 39, 197 (2016)
work page 2016
-
[5]
X. J. Wang, Nat Rev Neurosci 21, 169 (2020)
work page 2020
-
[6]
L. F. Abbott, D. D. Bock, E. M. Callaway, W. Denk, C. Dulac, A. L. Fairhall, I. Fiete, K. M. Harris, M. Helm- staedter, V . Jain, N. Kasthuri, Y . LeCun, J. W. Lichtman, P. B. Littlewood, L. Luo, J. H. R. Maunsell, R. C. Reid, B. R. Rosen, G. M. Rubin, T. J. Sejnowski, H. S. Seung, K. Svoboda, D. W. Tank, D. Tsao, and D. C. Van Essen, Cell 182, 1372 (2020)
work page 2020
-
[7]
P. Dayan and L. F. Abbott, Theoretical Neuroscience: Computational and Mathematical Modeling of Neural Systems, V ol. 460 (Cambridge, MA, 2001)
work page 2001
-
[8]
J. J. Hopfield, Proceedings of the National Academy of Sciences 79, 2554 (1982)
1982
Show all 76 references
-
[9]
J. J. Hopfield, Proceedings of the National Academy of Sciences 81, 3088 (1984)
1984
-
[10]
Huang, Introduction, in Statistical Mechanics of Neural Networks , edited by H
H. Huang, Introduction, in Statistical Mechanics of Neural Networks , edited by H. Huang (Springer Nature Sin- gapore, Singapore, 2021) pp. 1–4
2021
-
[11]
Xiao-Jing, The Journal of Neuroscience 19, 9587 (1999)
W. Xiao-Jing, The Journal of Neuroscience 19, 9587 (1999)
1999
-
[12]
Brunel and X
N. Brunel and X. J. Wang, J Comput Neurosci 11, 63 (2001)
2001
-
[13]
Renart, N
A. Renart, N. Brunel, and X.-J. Wang, Computational Neuroscience: a Comprehensive Approach 10.1201/9780203494462.ch15 (2003)
2003 doi
-
[14]
B. A. W. Brinkman, H. Yan, A. Maffei, I. M. Park, A. Fontanini, J. Wang, and G. La Camera, Applied Physics Reviews 9, 10.1063/5.0062603 (2022)
2022 doi
-
[15]
Chaudhuri, K
R. Chaudhuri, K. Knoblauch, M.-A. Gariel, H. Kennedy, and X.-J. Wang, Neuron 88, 419 (2015)
2015
-
[16]
F. Edin, T. Klingberg, P. Johansson, F. McNab, J. Tegn´er, and A. Compte, Proceedings of the National Academy of Sciences 106, 6802 (2009)
2009
-
[17]
Finkelstein, L
A. Finkelstein, L. Fontolan, M. N. Economo, N. Li, S. Romani, and K. Svoboda, Nat Neurosci 24, 843 (2021)
2021
-
[18]
Freyer, K
F. Freyer, K. Aquino, P. A. Robinson, P. Ritter, and M. Breakspear, J Neurosci29, 8512 (2009)
2009
-
[19]
Freyer, J
F. Freyer, J. A. Roberts, P. Ritter, and M. Breakspear, PLoS Comput Biol 8, e1002634 (2012)
2012
-
[20]
N. T. Markov, J. Vezoli, P. Chameau, A. Falchier, R. Quilodran, C. Huissoud, C. Lamy, P. Misery, P. Giroud, S. Ullman, P. Barone, C. Dehay, K. Knoblauch, and H. Kennedy, Journal of Comparative Neurology 522, 225 (2014)
2014
-
[21]
J. F. Mejias, J. D. Murray, H. Kennedy, and X.-J. Wang, Science Advances 2, e1601335 (2016)
2016
-
[22]
J. F. Mej ´ıas and X.-J. Wang, eLife 11, 10.7554/elife.72136 (2022)
2022 doi
-
[23]
J. D. Murray, A. Bernacchia, D. J. Freedman, R. Romo, J. D. Wallis, X. Cai, C. Padoa-Schioppa, T. Pasternak, H. Seo, D. Lee, and X.-J. Wang, Nature Neuroscience 17, 1661 (2014)
2014
-
[24]
J. D. Murray, J. Jaramillo, and X.-J. Wang, The Journal of Neuroscience 37, 12167 (2017)
2017
-
[25]
M. Wang, Y . Yang, C.-J. Wang, Nao, Lu, James, John, X.-J. Wang, and Amy, Neuron77, 736 (2013). 17
2013
-
[26]
K. F. Wong and X. J. Wang, J Neurosci 26, 1314 (2006)
2006
-
[27]
Yan and J
H. Yan and J. Wang, PLOS Computational Biology 16, e1008209 (2020)
2020
-
[28]
J. I. Gold and M. N. Shadlen, Annu Rev Neurosci 30, 535 (2007)
2007
-
[29]
X. J. Wang, Neuron 60, 215 (2008)
2008
-
[30]
J. E. Niven and S. B. Laughlin, J Exp Biol 211, 1792 (2008)
2008
-
[31]
Y . Cao, H. Wang, Q. Ouyang, and Y . Tu, Nat Phys11, 772 (2015)
2015
-
[32]
G. Lan, P. Sartori, S. Neumann, V . Sourjik, and Y . Tu, Nat Phys8, 422 (2012)
2012
-
[33]
Lan and Y
G. Lan and Y . Tu, J R Soc Interface10, 20130489 (2013)
2013
-
[34]
A. H. Lang, C. K. Fisher, T. Mora, and P. Mehta, Physical Review Letters 113, 148103 (2014)
2014
-
[35]
Theodoni, P
P. Theodoni, P. Majka, D. H. Reser, D. K. W´ojcik, M. G. P. Rosa, and X. J. Wang, Cereb Cortex32, 15 (2021)
2021
-
[36]
X. Fang, K. Kruse, T. Lu, and J. Wang, Reviews of Modern Physics 91, 045004 (2019)
2019
-
[37]
C. Li, E. Wang, and J. Wang, Biophysical Journal 101, 1335 (2011)
2011
-
[38]
Li and J
C. Li and J. Wang, PLoS Computational Biology 9, e1003165 (2013)
2013
-
[39]
Li and J
C. Li and J. Wang, Proceedings of the National Academy of Sciences 111, 14130 (2014)
2014
-
[40]
Wang, Advances in Physics 64, 1 (2015)
J. Wang, Advances in Physics 64, 1 (2015)
2015
-
[41]
L. Xu, D. Patterson, S. A. Levin, and J. Wang, Proceedings of the National Academy of Sciences 120, e2218663120 (2023)
2023
-
[42]
H. Yan, F. Zhang, and J. Wang, Communications Physics 6, 110 (2023)
2023
-
[43]
H. Yan, L. Zhao, L. Hu, X. Wang, E. Wang, and J. Wang, Proceedings of the National Academy of Sciences110, E4185 (2013)
2013
-
[44]
D. J. Amit and N. Brunel, Cerebral Cortex 7, 237 (1997)
1997
-
[45]
Compte, Neuroscience 139, 135 (2006)
A. Compte, Neuroscience 139, 135 (2006)
2006
-
[46]
Brunel, J Comput Neurosci 8, 183 (2000)
N. Brunel, J Comput Neurosci 8, 183 (2000)
2000
-
[47]
Z. V . Guo, H. K. Inagaki, K. Daie, S. Druckmann, C. R. Gerfen, and K. Svoboda, Nature545, 181 (2017)
2017
-
[48]
M. L. Leavitt, D. Mendoza-Halliday, and J. C. Martinez-Trujillo, Trends in Neurosciences 40, 328 (2017)
2017
-
[49]
Lapidus, B
S. Lapidus, B. Han, and J. Wang, Proceedings of the National Academy of Sciences 105, 6039 (2008)
2008
-
[50]
J. Wang, L. Xu, E. Wang, and S. Huang, Biophys J 99, 29 (2010)
2010
-
[51]
Eastman, N
P. Eastman, N. Grønbech-Jensen, and S. Doniach, The Journal of Chemical Physics 114, 3823 (2001)
2001
-
[52]
H. Feng, K. Zhang, and J. Wang, Chemical Science 5, 3761 (2014)
2014
-
[53]
Lee and B
J. Lee and B. R. Brooks, Chemical Physics 535, 110768 (2020)
2020
-
[54]
Lee, I.-H
J. Lee, I.-H. Lee, I. Joung, J. Lee, and B. R. Brooks, Nature Communications 8, 15443 (2017)
2017
-
[55]
Miller, Thomas F
I. Miller, Thomas F. and C. Predescu, The Journal of Chemical Physics 126, 10.1063/1.2712444 (2007)
2007 doi
-
[56]
J. Wang, L. Xu, and E. Wang, Proceedings of the National Academy of Sciences of the United States of America 105, 12271 (2008). 18
2008
-
[57]
C. W. Lynn, E. J. Cornblath, L. Papadopoulos, M. A. Bertolero, and D. S. Bassett, Proc Natl Acad Sci U S A118, 10.1073/pnas.2109889118 (2021)
2021 doi
-
[58]
H. Yan, B. Li, and J. Wang, Journal of The Royal Society Interface 16, 20180756 (2019)
2019
-
[59]
Y . Cao, H. Wang, Q. Ouyang, and Y . Tu, Nature Physics11, 772 (2015)
2015
-
[60]
G. Lan, P. Sartori, S. Neumann, V . Sourjik, and Y . Tu, Nature Physics8, 422 (2012)
2012
-
[61]
H. Yan, K. Zhang, and J. Wang, Chinese Physics B 25, 078702 (2016)
2016
-
[62]
Scheffer, J
M. Scheffer, J. Bascompte, W. A. Brock, V . Brovkin, S. R. Carpenter, V . Dakos, H. Held, E. H. van Nes, M. Ri- etkerk, and G. Sugihara, Nature 461, 53 (2009)
2009
-
[63]
Qian and E
H. Qian and E. L. Elson, Proceedings of the National Academy of Sciences 101, 2828 (2004)
2004
-
[64]
Xu and J
L. Xu and J. Wang, Journal of Physical Chemistry B 124, 2549 (2020)
2020
-
[65]
N. T. Markov, M. Ercsey-Ravasz, D. C. Van Essen, K. Knoblauch, Z. Toroczkai, and H. Kennedy, Science 342, 1238406 (2013)
2013
-
[66]
P. S. Swain, M. B. Elowitz, and E. D. Siggia, Proceedings of the National Academy of Sciences99, 12795 (2002)
2002
-
[67]
Zhang and J
K. Zhang and J. Wang, The Journal of Physical Chemistry B 122, 5487 (2018)
2018
-
[68]
D. T. Gillespie, The Journal of Physical Chemistry 81, 2340 (1977)
1977
-
[69]
A. S. Perelson, The Quarterly Review of Biology 53, 362 (1978)
1978
-
[70]
Gang, Stochastic F orce and Nonlinear Systems (Shanghai Scientific and Technological Education, Shanghai, 1994)
H. Gang, Stochastic F orce and Nonlinear Systems (Shanghai Scientific and Technological Education, Shanghai, 1994)
1994
- [71]
-
[72]
Qian, Journal of Physical Chemistry B 110, 15063 (2006)
H. Qian, Journal of Physical Chemistry B 110, 15063 (2006)
2006
-
[73]
Qian, Chapter 5 - entropy demystified: The “thermo”-dynamics of stochastically fluctuating systems, in Meth- ods in Enzymology, V ol
H. Qian, Chapter 5 - entropy demystified: The “thermo”-dynamics of stochastically fluctuating systems, in Meth- ods in Enzymology, V ol. 467, edited by M. L. Johnson and L. Brand (Academic Press, 2009) pp. 111–134
2009
-
[74]
L. Xu, H. Shi, H. Feng, and J. Wang, Journal of Chemical Physics 136, 10.1063/1.3703514 (2012)
2012 doi
-
[75]
J. Wang, K. Zhang, L. Xu, and E. Wang, Proceedings of the National Academy of Sciences of the United States of America 108, 8257 (2011)
2011
-
[76]
Onsager and S
L. Onsager and S. Machlup, Physical Review 91, 1505 (1953). 19
1953
Reviewed August 12, 2026 · model on record in the stance chip above.
Discussion (0). Continue with ORCID to comment.