REVIEW 3 major objections 6 minor 23 references
Barttender: An approachable & interpretable way to compare medical imaging and non-imaging data
T0 review · 3 major / 6 minor · reviewed 2026-08-12 · deepseek-v4-flash
Pith's one-line read Grayscale bars let deep learning compare X-rays with EHR data directly.
desk verdict Clean idea—tabular bars plus blank-image control—but the preprocessing may leak test set information, so the headline 'comparable performance' claim needs a fix before I'd trust it. read the letter →
The pith
A machine-rendered reading of the paper's core claim, the machinery that carries it, and where it could break.
The reading
What carries the argument
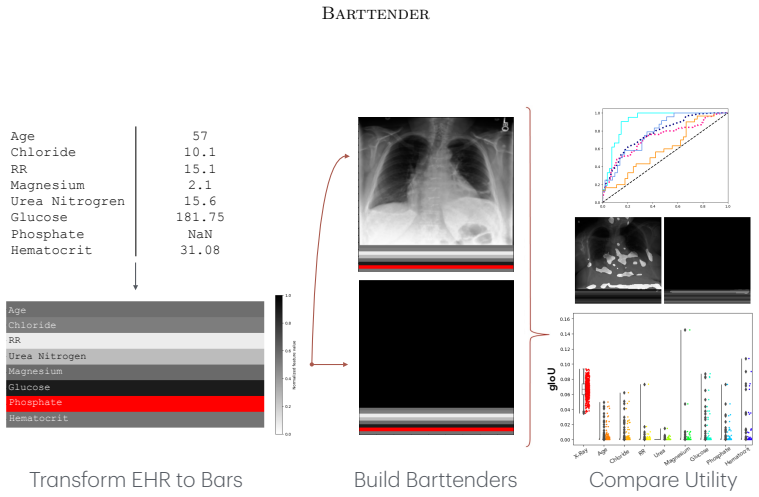
The machinery is the grayscale-bar encoding of tabular data plus the gIoU aggregation rule. Each continuous variable is quantile-normalized to $[0,1]$ and drawn as a bar whose intensity runs from white to black; categorical variables are assigned spaced values, and missing values are drawn as a red bar so missingness itself is visible to the model. Bars are concatenated to a real X-ray (Image Barttender) or to a blank image (Blank Barttender), and the same DenseNet-121 is trained on both. The gIoU measure weights the mean attribution intensity in a region by the Intersection over Union ($\text{IoU} = |A \cap B|/|A \cup B|$) between the model's high-attention mask and that region, then averages over the test set. This turns pixel-level saliency maps into a population-level coefficient-like importance score, and the same construction at the sample level yields local explanations.
What would settle it
Re-run the MIMIC workflow with quantile normalization and the logistic-regression feature selection performed separately inside each training fold. If the Blank Barttender no longer matches or beats XGBoost on tabular data, or if the Image Barttender's advantage shrinks, the reported parity would be traceable to leakage rather than to the bar representation.
Extended reading notes
Core claim
The central claim is that converting non-imaging tabular features into grayscale bars and appending them to medical images produces a deep learning model whose predictive performance is comparable to established scalar-based comparisons, while remaining interpretable. On the MIMIC cardiomegaly task, the Image Barttender reaches an AUC of $0.86 \pm 0.02$ and an MCC of $0.51 \pm 0.05$, close to XGBoost with image biomarkers and tabular data ($0.83 \pm 0.02$ AUC) and logistic regression with the same inputs ($0.88 \pm 0.00$ AUC). The Blank Barttender, which uses only the bars, outperforms XGBoost and logistic regression trained on the same tabular features on most metrics, which the authors suggest may reflect nonlinear interactions among bars that shallow models miss. On CheXpert, the Blank Barttender replicates the relative ranking of logistic regression across conditions, and the bars' ordering does not change performance, evidence that the model attends to the bars' content rather than their position. The paper also introduces gIoU, an IoU-scaled, test-set-averaged attribution intensity, as a global feature importance measure, and shows that even when the X-ray dominates globally, individual patients can still have high bar importances.
Load-bearing premise
The comparison is unbiased only if the quantile normalization of continuous variables and the selection of the eight tabular features via logistic regression Z-scores were fit on training data alone, with the test set excluded; the paper does not state that this was done.
Editorial extensions
If this is right
- Researchers can compare the utility of imaging versus tabular data without building domain-specific pipelines that convert images into scalar biomarkers, shortening the analysis cycle.
- The gap between Image and Blank Barttender performance gives a direct, model-controlled estimate of the added predictive value of images over risk factors.
- gIoU offers a population-level feature importance ranking for image-based models, while sample-level IoU flags individual patients for whom tabular features drive the prediction.
- Because missing values are encoded as a distinct bar color, the approach can model missing data without imputation and can surface missingness as a predictive signal.
- The same bar-encoding recipe can be applied to other disease targets, such as diabetes or cardiovascular risk, where tabular risk scores and imaging could be compared.
Reading between the lines
- A natural extension the authors leave implicit: because quantile normalization preserves only rank order, the Blank Barttender's edge over XGBoost suggests the convolutional network may be exploiting nonlinear interactions among bar regions; one could test this by training on bars whose values are randomly shuffled across features.
- gIoU is defined for any region of an attribution map, not only bars, so it could serve as a general-purpose global importance metric for other image tasks where saliency maps are already computed.
- The framework could be used as a cheap screening step before building multimodal fusion models: if the Image Barttender shows no gain over the Blank Barttender, investing in image-based deep learning for that task may be unwarranted.
- A clinically meaningful next study would present the Image Barttender and its sample-level attributions to clinicians and measure whether it changes their interpretation of a prediction; the authors name this as future work but do not test it.
Signed reviews
Editorial analysis
A structured set of objections, weighed in public.
Referee Report
Summary. The paper proposes Barttender, a framework that converts tabular EHR features into grayscale bars appended to medical images (Image Barttender) or to blank images (Blank Barttender), trains a DenseNet-121 on both, and compares the resulting models with logistic regression and XGBoost baselines trained on scalar representations. It introduces gIoU, an attribution-aggregation metric intended as a global feature importance measure for image-based models, and reports proof-of-concept experiments on CheXpert demographics and MIMIC cardiomegaly prediction. The central claim is that Barttender performs comparably to traditional scalar-based methods while offering local and global explainability.
Significance. If the evaluation is unbiased, Barttender is a useful contribution: it offers an approachable, explainable alternative for comparing imaging versus tabular utility, and it avoids the need for domain-specific image biomarker extraction. The paper is honest about limitations, including the absence of causal claims for gIoU and the need for clinical validation. Reproducibility is aided by the use of public datasets and released code, and the use of two attribution methods strengthens the explainability analysis. The main risk is procedural: the manuscript does not establish that normalization and feature selection are fit on training data alone, and this bears directly on the validity of the headline performance comparisons.
major comments (3)
- [Section 3.2, 'Feature Selection' and Appendix B.2] The manuscript does not state whether quantile normalization (Section 2.1) and the logistic-regression feature selection are fit on training folds only. Since the MIMIC evaluation sample (n = 2667) is drawn from the same Duvieusart et al. cohort used to build the ≈22,000-sample feature-selection pool, the text as written does not rule out test information entering preprocessing. The statement in Appendix B.2 that 'test samples were held out across all folds' refers only to model training. If preprocessing was fit on the full cohort, the AUCs in Table 2 are in-sample estimates and the central 'comparable performance' claim is not supported. Please either state explicitly that all normalization and feature selection were nested inside the cross-validation loop, or re-run the pipeline accordingly and report the resulting metrics.
- [Section 4.1 / Table 1] The claim that Blank Barttender 'has predictive performance similar to that of a logistic regression' is not fully supported by Table 1: for Cardiomegaly, Blank Barttender AUC is 0.53 ± 0.01 versus 0.57 ± 0.00 for logistic regression, a gap larger than the reported confidence intervals, while F1 and MCC rankings also differ (F1: 0.48 vs 0.38; MCC: 0.10 vs 0.07). The text should either report a statistical comparison of the AUC difference and justify the equivalence threshold, or soften the claim to 'similar on some metrics and some labels.'
- [Section 2.3 / Section 5.1] The gIoU metric is computed from the model's own attribution maps, so it cannot independently validate that the model attends to the bars for the intended reason; a model that encodes a spurious shortcut in the bars would still produce high gIoU for those bars. The statement in Section 1 that 'the model learned robust features from the tabular data' therefore goes beyond what gIoU alone can show. Please add a sanity check, such as permuting or ablating individual bars and verifying that gIoU and model performance change in the expected direction, or compare gIoU rankings against a held-out feature-importance measure.
minor comments (6)
- [Section 3.2] There is an unresolved reference 'Section ??' in the sentence 'As mentioned in Section ??'; this should be replaced with a specific pointer to the related work or to Duvieusart et al. (2022).
- [Section 2.1 and Figure 1] There are several typos, including 'deep learing' in Section 2.1, 'prediciton' in Section 2.2, 'clincal' in Section 5, 'recaptitulated' in the introduction, and 'Urea Nitrogren' in Figure 1; these should be corrected.
- [Table 3] The caption of Table 3 says 'computed using gIoU' but the table appears to report raw Integrated Gradients values; please clarify the relationship between the table entries and the gIoU formula.
- [Appendix B.2] Please specify the optimizer, learning rate, early stopping criterion, and the exact horizontal/vertical placement and width of the bars (described only as 'about 20%' of the image); these details are needed for reproducibility.
- [Appendix B.1] Appendix B.1 contains a self-reference to 'section B.1' in the sentence 'preprocessed as directed by Duvieusart et al. (2022) (details can be found in the appendix, section B.1)'; this should point to the relevant subsection.
- [Table 2] All logistic regression entries in Table 2 report ±0.00 for every metric; if these values are rounded to two decimals, please state the rounding rule or report more significant digits so that the confidence intervals are meaningful.
Circularity Check
No significant circularity: the central performance comparison is empirical and benchmarked against external baselines.
full rationale
Barttender's main claim, that it performs comparably to logistic regression and XGBoost on scalar representations of imaging and tabular data, is an empirical comparison against external models and external image biomarkers (Duvieusart et al., 2022). The bar-encoding transformation is a preprocessing choice, not a derivation, and the reported AUC/F1/MCC values are measured outcomes rather than quantities defined by the method's own equations. The gIoU measure is an aggregation of the model's own attribution maps, but the paper does not use gIoU to derive the performance comparison; it is a post-hoc explanation tool, and the paper explicitly cautions that gIoU lacks the statistical and causal foundations of regression coefficients. No load-bearing self-citations appear: the reference list contains no works by the present authors, and the external datasets, baselines, and attribution methods are independently established. The potential MIMIC preprocessing and feature-selection leakage is a methodological validity concern, not a circular derivation: the selected 8 features are chosen by logistic-regression Z-scores on roughly 22,000 samples, but the final model weights are trained on held-out folds, and the reported test metrics are not equal to the feature-selection statistics by construction. Therefore, no circular step can be exhibited, and the appropriate score is 0.
Assumptions & free parameters
free parameters (4)
- Categorical bar encoding values =
sex: No=0.2, Yes=1.0; race: 0.33/0.66/0.99; smoking: 0.1/0.4/0.9
- Attention mask threshold =
10% highest-intensity pixels
- Bar area fraction =
~20% of image width
- Gaussian blur kernel for attribution maps =
unspecified
assumptions (5)
- domain assumption Quantile normalization preserves the predictive information in tabular features and maps ranks to absolute values.
- domain assumption Blank Barttender (bars on a blank image) isolates the contribution of non-imaging data.
- domain assumption Saliency maps and Integrated Gradients provide meaningful estimates of pixel relevance for DenseNet-121.
- domain assumption ImageNet pretraining transfers to chest X-rays with appended bars.
- ad hoc to paper The 8 features selected by logistic regression Z-scores are the appropriate tabular features.
Cite this review
Pith. "Pith review of Barttender: An approachable & interpretable way to compare medical imaging and non-imaging data." pith.science (2026). https://pith.science/paper/AYRTWJ6R
@misc{pith2026241112707,
  author       = {Pith},
  title        = {Pith review of: Barttender: An approachable & interpretable way to compare medical imaging and non-imaging data},
  year         = {2026},
  howpublished = {\url{https://pith.science/paper/AYRTWJ6R}},
  note         = {Machine review of arXiv:2411.12707}
}
read the original abstract
Imaging-based deep learning has transformed healthcare research, yet its clinical adoption remains limited due to challenges in comparing imaging models with traditional non-imaging and tabular data. To bridge this gap, we introduce Barttender, an interpretable framework that uses deep learning for the direct comparison of the utility of imaging versus non-imaging tabular data for tasks like disease prediction. Barttender converts non-imaging tabular features, such as scalar data from electronic health records, into grayscale bars, facilitating an interpretable and scalable deep learning based modeling of both data modalities. Our framework allows researchers to evaluate differences in utility through performance measures, as well as local (sample-level) and global (population-level) explanations. We introduce a novel measure to define global feature importances for image-based deep learning models, which we call gIoU. Experiments on the CheXpert and MIMIC datasets with chest X-rays and scalar data from electronic health records show that Barttender performs comparably to traditional methods and offers enhanced explainability using deep learning models.
Figures


Reference graph
Works this paper leans on
-
[1]
Mohanad Alkhodari, Ahsan H. Khandoker, Herbert F. Jelinek, Angelos Karlas, Stergios Soulaidopoulos, Petros Arsenos, Ioannis Doundoulakis, Konstantinos A. Gatzoulis, Konstantinos Tsioufis, and Leontios J. Hadjileontiadis. Circadian assessment of heart failure using explainable deep learning and novel multi-parameter polar images. Computer Methods and Progr...
arXiv 2024
-
[2]
Revolutionizing healthcare: the role of artificial intelligence in clinical practice
Shuroug A Alowais, Sahar S Alghamdi, Nada Alsuhebany, Tariq Alqahtani, Abdulrahman I Alshaya, Sumaya N Almohareb, Atheer Aldairem, Mohammed Alrashed, Khalid Bin Saleh, Hisham A Badreldin, et al. Revolutionizing healthcare: the role of artificial intelligence in clinical practice. BMC medical education, 23 0 (1): 0 689, 2023
work page 2023
-
[3]
Reading Race: AI Recognises Patient's Racial Identity In Medical Images
Imon Banerjee, Ananth Reddy Bhimireddy, John L. Burns, Leo Anthony Celi, Li-Ching Chen, Ramon Correa, Natalie Dullerud, Marzyeh Ghassemi, Shih-Cheng Huang, Po-Chih Kuo, Matthew P. Lungren, Lyle Palmer, Brandon J. Price, Saptarshi Purkayastha, Ayis Pyrros, Luke Oakden-Rayner, Chima Okechukwu, Laleh Seyyed-Kalantari, Hari Trivedi, Ryan Wang, Zachary Zaiman,...
work page Pith review arXiv 2022
-
[4]
Davide Chicco and Giuseppe Jurman. The matthews correlation coefficient (mcc) should replace the roc auc as the standard metric for assessing binary classification. BioData Mining, 16 0 (1): 0 4, 2023
work page 2023
-
[5]
Can Cui, Haichun Yang, Yaohong Wang, Shilin Zhao, Zuhayr Asad, Lori A. Coburn, Keith T. Wilson, Bennett A. Landman, and Yuankai Huo. Deep multimodal fusion of image and non-image data in disease diagnosis and prognosis: a review. Prog. Biomed. Eng., 5 0 (2): 0 022001, April 2023. ISSN 2516-1091. doi:10.1088/2516-1091/acc2fe. URL https://dx.doi.org/10.1088...
-
[6]
Towards efficient image-based representation of tabular data
Amit Damri, Mark Last, and Niv Cohen. Towards efficient image-based representation of tabular data. Neural Comput & Applic, 36 0 (2): 0 1023--1043, January 2024. ISSN 1433-3058. doi:10.1007/s00521-023-09074-y. URL https://doi.org/10.1007/s00521-023-09074-y
-
[7]
Ai for radiographic covid-19 detection selects shortcuts over signal
Alex J DeGrave, Joseph D Janizek, and Su-In Lee. Ai for radiographic covid-19 detection selects shortcuts over signal. Nature Machine Intelligence, 3 0 (7): 0 610--619, 2021
work page 2021
-
[8]
Benjamin Duvieusart, Felix Krones, Guy Parsons, Lionel Tarassenko, Bartłomiej W. Papież, and Adam Mahdi. Multimodal Cardiomegaly Classification with Image - Derived Digital Biomarkers . In Guang Yang, Angelica Aviles-Rivero, Michael Roberts, and Carola-Bibiane Schönlieb, editors, Medical Image Understanding and Analysis , pages 13--27, Cham, 2022. Springe...
Show all 23 references
-
[9]
Algorithmic encoding of protected characteristics in chest X -ray disease detection models
Ben Glocker, Charles Jones, Mélanie Bernhardt, and Stefan Winzeck. Algorithmic encoding of protected characteristics in chest X -ray disease detection models. eBioMedicine, 89, March 2023. ISSN 2352-3964. doi:10.1016/j.ebiom.2023.104467. URL https://www.thelancet.com/journals/...
2023
-
[10]
Menten, and Daniel Rueckert
Paul Hager, Martin J. Menten, and Daniel Rueckert. Best of Both Worlds : Multimodal Contrastive Learning with Tabular and Imaging Data . 2023 IEEE/CVF Conference on Computer Vision and Pattern Recognition (CVPR), pages 23924--23935, June 2023. doi:10.1109/CVPR52729.2023.02291....
2023
-
[11]
Partridge, Habib Rahbar, Debosmita Biswas, Christoph I
Gregory Holste, Savannah C. Partridge, Habib Rahbar, Debosmita Biswas, Christoph I. Lee, and Adam M. Alessio. End-to- End Learning of Fused Image and Non - Image Features for Improved Breast Cancer Classification from MRI . 2021 IEEE/CVF International Conference on Computer Vi...
2021
-
[12]
Fusion of CT images and clinical variables based on deep learning for predicting invasiveness risk of stage I lung adenocarcinoma
Haozhe Huang, Dezhong Zheng, Hong Chen, Ying Wang, Chao Chen, Lichao Xu, Guodong Li, Yaohui Wang, Xinhong He, and Wentao Li. Fusion of CT images and clinical variables based on deep learning for predicting invasiveness risk of stage I lung adenocarcinoma. Medical Physics, 49 0...
2022 doi
-
[13]
Mong, Safwan S
Jeremy Irvin, Pranav Rajpurkar, Michael Ko, Yifan Yu, Silviana Ciurea-Ilcus, Chris Chute, Henrik Marklund, Behzad Haghgoo, Robyn Ball, Katie Shpanskaya, Jayne Seekins, David A. Mong, Safwan S. Halabi, Jesse K. Sandberg, Ricky Jones, David B. Larson, Curtis P. Langlotz, Bhavik ...
2019
-
[14]
MIMIC - IV , a
Alistair Johnson, Lucas Bulgarelli, Tom Pollard, Brian Gow, Benjamin Moody, Steven Horng, Leo Anthony Celi, and Roger Mark. MIMIC - IV , a . URL https://physionet.org/content/mimiciv/3.0/
-
[15]
MIMIC - CXR - JPG - chest radiographs with structured labels, b
Alistair Johnson, Matthew Lungren, Yifan Peng, Zhiyong Lu, Roger Mark, Seth Berkowitz, and Steven Horng. MIMIC - CXR - JPG - chest radiographs with structured labels, b . URL https://physionet.org/content/mimic-cxr-jpg/2.1.0/
-
[16]
Key challenges for delivering clinical impact with artificial intelligence
Christopher J Kelly, Alan Karthikesalingam, Mustafa Suleyman, Greg Corrado, and Dominic King. Key challenges for delivering clinical impact with artificial intelligence. BMC medicine, 17: 0 1--9, 2019
2019
-
[17]
Yan, Durgesh Chaudhary, Venkatesh Avula, Satish Mudiganti, Hannah Husby, Shima Shahjouei, Ardavan Afshar, Walter F
Jiang Li, Xiaowei S. Yan, Durgesh Chaudhary, Venkatesh Avula, Satish Mudiganti, Hannah Husby, Shima Shahjouei, Ardavan Afshar, Walter F. Stewart, Mohammed Yeasin, Ramin Zand, and Vida Abedi. Imputation of missing values for electronic health record laboratory data. npj Digit. ...
2021 doi
-
[18]
A comparative analysis of converters of tabular data into image for the classification of Arboviruses using Convolutional Neural Networks
Leonides Medeiros Neto, Sebastião Rogerio da Silva Neto, and Patricia Takako Endo. A comparative analysis of converters of tabular data into image for the classification of Arboviruses using Convolutional Neural Networks . PLoS One, 18 0 (12): 0 e0295598, December 2023. ISSN 1...
2023 doi
-
[19]
Deep inside convolutional networks: Visualising image classification models and saliency maps
Karen Simonyan. Deep inside convolutional networks: Visualising image classification models and saliency maps. arXiv preprint arXiv:1312.6034, 2013
2013 arXiv
-
[20]
Axiomatic attribution for deep networks
Mukund Sundararajan, Ankur Taly, and Qiqi Yan. Axiomatic attribution for deep networks. In International conference on machine learning, pages 3319--3328. PMLR, 2017
2017
-
[21]
Sanity Checks for Saliency Metrics
Richard Tomsett, Dan Harborne, Supriyo Chakraborty, Prudhvi Gurram, and Alun Preece. Sanity Checks for Saliency Metrics . AAAI, 34 0 (04): 0 6021--6029, April 2020. ISSN 2374-3468, 2159-5399. doi:10.1609/aaai.v34i04.6064. URL https://ojs.aaai.org/index.php/AAAI/article/view/6064
2020 doi
-
[22]
Carl van Walraven, Christopher McCudden, and Peter C. Austin. Imputing missing laboratory results may return erroneous values because they are not missing at random. J Clin Epidemiol, 154: 0 65--74, February 2023. ISSN 1878-5921. doi:10.1016/j.jclinepi.2022.12.011
2023 doi
-
[23]
Evrard, James H
Yitan Zhu, Thomas Brettin, Fangfang Xia, Alexander Partin, Maulik Shukla, Hyunseung Yoo, Yvonne A. Evrard, James H. Doroshow, and Rick L. Stevens. Converting tabular data into images for deep learning with convolutional neural networks. Sci Rep, 11 0 (1): 0 11325, May 2021. IS...
2021 doi
Reviewed August 12, 2026 · model on record in the stance chip above.
Discussion (0). Continue with ORCID to comment.