REVIEW 5 major objections 5 minor 2 references
Deep learning on butterfly phenotypes tests evolution's oldest mathematical model
T0 review · 5 major / 5 minor · reviewed 2026-08-14 · deepseek-v4-flash
Pith's one-line read Phenotypic distances learned from 2,468 butterfly photos quantitatively confirm Müllerian mimicry and show that mutual convergence creates new wing patterns.
desk verdict A serious and checkable application of deep metric learning to butterfly mimicry, whose core convergence result likely holds but whose 'total phenome' claim and mutual-convergence case study need careful qualification. read the letter →
The pith
A machine-rendered reading of the paper's core claim, the machinery that carries it, and where it could break.
The reading
What carries the argument
The central object is ButterflyNet, a 15-layer convolutional neural network trained with a triplet loss together with a subspecies-classification loss. Each training triplet shows two photographs of the same subspecies and one of a different subspecies, and the network learns a 64-dimensional embedding in which Euclidean distance is small for same-subspecies pairs and large for different-subspecies pairs. The learned coordinates of all 2,468 images then supply pairwise phenotypic distances between subspecies, which are tested for mimicry versus non-mimicry similarity and used to build neighbor-joining trees; those trees are compared with gene phylogenies using an unrooted tree-distance metric. The same embedding enables sister-group comparisons in which a focal co-mimic's distance from its nearest conspecific is measured across all 64 axes, giving the quantitative evidence for mutual convergence.
What would settle it
Re-photograph a subset of the same specimens under altered lighting or background and measure the embedding distance between photographs of the same individual; if that within-specimen distance is as large as typical distances between co-mimic subspecies, the Euclidean distances are tracking imaging artifacts rather than a neutral phenome measure.
Extended reading notes
Core claim
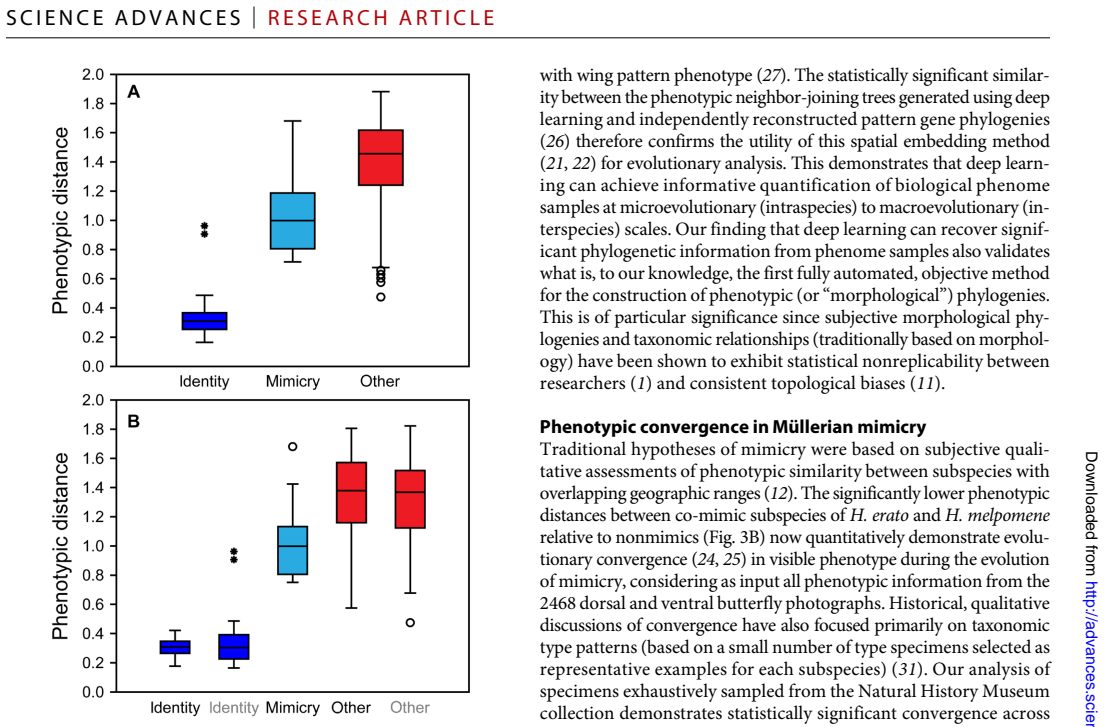
Across the complete dataset, traditionally hypothesized sympatric co-mimics are significantly more similar to each other than are other subspecies pairs (rank-based pairwise comparison, P = 5.50e-7), and neighbor-joining trees reconstructed from phenotypic distances are significantly more similar to color-pattern gene trees than to random trees (P <= 2.59e-256). For both species separately, phenotypic trees are closer to gene trees for wing-pattern loci than to neutral-locus gene trees. Comparative case studies of twelve subspecies show statistically significant mutual convergence: in the focal example H. melpomene has converged about 1.6 times as far as H. erato, consistent with frequency-dependent Müllerian fitness benefits, and the shared derived pattern features appear to have been exchanged between the lineages rather than inherited from a common ancestor. The paper concludes that mutual convergence, equivalent to reciprocal advergence, can itself generate phenotypic novelty by recombining features from the two lineages, and that deep learning embeddings can serve as quantitative phenomic distances for evolutionary analysis.
Load-bearing premise
The entire distance measure rests on the premise that Euclidean distance in the 64-dimensional embedding, trained only to separate the 38 named subspecies, faithfully represents total visible phenotypic similarity rather than the particular image features that distinguish those labels.
Editorial extensions
If this is right
- Co-mimic subspecies of H. erato and H. melpomene are confirmed to be more similar in visible phenotype than non-mimics, quantitatively validating the central prediction of Müllerian mimicry theory.
- Phenotypic distances from deep embeddings carry significant phylogenetic information, especially for wing-pattern genes, offering a fully automated and objective route to morphological phylogenetics.
- Both species show statistically significant mutual convergence, supporting reciprocal coevolution between model and mimic rather than entirely one-sided mimicry evolution.
- Mutual convergence can combine pattern features from different lineages, providing a coevolutionary mechanism for the origin of novel wing patterns without direct gene exchange.
- The method generalizes as a phenomic-distance pipeline: any large, consistently photographed collection can be embedded and interrogated for convergence, hybridization, biogeographic, and phylogenetic hypotheses.
Reading between the lines
- Beyond the paper's dataset, the same embedding pipeline could be applied to other mimicry rings or to any phenotype-rich museum collection; the key requirement is a set of labels (subspecies, species, morphs) strong enough to train the triplet network.
- Because the embedding is optimized for subspecies discrimination, 'total phenotypic similarity' here means similarity along axes that separate the named subspecies; traits that vary within subspecies or are shared by all 38 subspecies may be underrepresented in the distances, so the method is best read as classification-relevant phenomics.
- The proposed recombination mechanism, mutual convergence generating novel feature combinations, could be tested in silico by simulating two-lineage frequency-dependent predator learning on two binary pattern traits and checking whether the predicted novel combination arises and spreads.
- Comparing individual embedding axes with known wing-pattern loci, such as optix-linked traits, could reveal which learned dimensions correspond to which genetic switches, connecting the phenomic distances to developmental genetics.
Signed reviews
Editorial analysis
A structured set of objections, weighed in public.
Referee Report
Summary. The paper trains a deep convolutional triplet network ('ButterflyNet') on 2468 dorsal and ventral photographs of 38 subspecies of Heliconius erato and H. melpomene, using subspecies identity as the training signal. It embeds all images into a 64-dimensional Euclidean space and uses pairwise distances to quantify phenotypic similarity. The authors report three main results: (i) same-subspecies images are significantly more similar than different-subspecies images; (ii) traditionally hypothesized sympatric co-mimics are significantly more similar than other subspecies pairs (Mann-Whitney pairwise, P = 5.50e-7), which they interpret as quantitative support for Müllerian mimicry; (iii) neighbor-joining trees from phenotypic distances are more similar to color-pattern gene trees than to random or neutral-gene trees. A case study of four subspecies is used to argue for mutual convergence and for the claim that mutual convergence can generate phenotypic novelty. The paper concludes that deep learning can provide phenomic embeddings enabling quantitative tests of evolutionary hypotheses previously testable only subjectively.
Significance. If the central claims hold, this paper would be a valuable methodological contribution: it applies modern deep metric learning to a classic evolutionary question and provides a large, openly available image dataset, code, and embedding coordinates. The effort to test a quantitative prediction of Müllerian mimicry with a data-driven phenotype representation is commendable, and the authors are careful to validate the embedding against gene-tree comparisons and to check robustness after excluding hybrids. The central observation that co-mimic subspecies are phenotypically closer than other pairs is directionally clear and consistent with the mimicry literature. However, the strength of the conclusions depends critically on whether the embedding is a neutral and comprehensive phenomic measure, and on the statistical handling of non-independent pairwise distances. The current manuscript does not fully establish these prerequisites, and several load-bearing claims require additional validation before the broad conclusions can be accepted.
major comments (5)
- [Results, 'Testing phenotypic convergence'; Supplementary Methods, 'Statistical analyses of phenotypic distance'] The Mann-Whitney and Kruskal-Wallis tests treat average pairwise distances between subspecies pairs as independent observations, but these distances are non-independent because each subspecies appears in many pairs (e.g., 684 'other' pairs derived from only 38 subspecies). This pseudoreplication inflates the effective sample size and produces extreme P-values; the reported P = 5.50e-7 for the co-mimic test is therefore not a valid significance level. The authors should use a permutation test that resamples subspecies labels while preserving the pair structure, or a mixed-effects model with random intercepts for subspecies, to account for the dependence. This is load-bearing for the central claim of significant convergence.
- [Abstract and Discussion, 'Quantification of phenotypic similarity using deep learning'] The claim that the 64-dimensional embedding captures 'total visible phenotypic similarity' is not supported by the training objective. The network is trained to classify 38 named subspecies, so the embedding is optimized to preserve image variation that discriminates those labels. In this system, subspecies are defined largely by wing-pattern phenotype, and the traditional mimicry hypotheses were based on the same visual features. Consequently, the significant co-mimic similarity may partly reflect the network recovering human taxonomic labels rather than measuring an independent phenomic signal. A label-free control embedding (e.g., a convolutional autoencoder, or raw pixel-based distances after alignment) should be compared; if the convergence signal persists under that control, the claim of a general phenotypic measure would be substantially strengthened.
- [Materials and Methods, 'Deep learning'; Results, 'Deep learning network output and accuracy'] Hyperparameters were tuned to optimize test classification accuracy, as acknowledged in the Supplementary Methods, so the reported 86% test accuracy is an optimistic estimate. More importantly, the pairwise distance analyses use all 2468 images, including the 1500 images on which the network was trained. Distances involving training images are likely overfit (e.g., artificially compact same-subspecies clusters), which could bias the convergence comparisons. The authors should recompute all distance-based statistics using only the 968 held-out test images, or use a cross-validated embedding procedure, to ensure the results are not driven by training-set memorization.
- [Results, 'Phylogenetic results'; Supplementary Methods, 'Phylogenetic analyses'] The comparison of phenotypic neighbor-joining trees to random topologies (P ≤ 2.59e-256) is a very weak null because any tree with taxonomic or geographic signal will beat a random tree. The more meaningful comparison is to neutral-gene trees, but the combined-dataset result is only P ≤ 0.0066 (table S10), which is far more modest. Moreover, the strong similarity to color-pattern gene trees is expected given that both the subspecies labels and the color-pattern genes are tied to wing-pattern variation; this does not independently validate the embedding as a general phenomic measure. The authors should either provide a stronger null (e.g., trees from a label-free embedding or from permuted image sets) or temper the claim of 'objective, phylogenetically informative phenome capture.'
- [Discussion, 'Mutual convergence and strict coevolution'; Fig. S7] The mutual-convergence case study selects focal taxa and evolutionary polarities using gene phylogenies and phylogeographic reconstructions, then tests distances in the embedding. This selection process can bias the outcome because the data used to define the expected direction of change are not independent of the phenotype being measured. Additionally, the image-level distances within the small set of selected subspecies again raise the non-independence problem described above. The authors should report a permutation analysis over all possible polarity assignments (or a sensitivity analysis with different focal-taxon choices) to show that the mutual-convergence result is not an artifact of the selection procedure.
minor comments (5)
- [Abstract and Introduction] The relationship between '2468 butterfly photographs' and '1234 butterfly specimens' is not made explicit until the Materials and Methods; consider stating early that each specimen has both dorsal and ventral photographs.
- [Fig. 3 caption] The caption states 'Sample sizes are 38, 19, and 684 subspecies pairs'; please clarify that these are unordered pairs and that the pair-level distances are averages over image pairs.
- [Supplementary Methods, Eq. S1] Equation S1 writes the triplet loss as an expectation without a margin or hinge; please specify the exact loss used (e.g., whether a margin is applied) and how the expectation is estimated during training.
- [Supplementary Methods, 'Deep learning'] The statement that hyperparameters were tuned to optimize test classification accuracy appears only in the supplementary; this is an important limitation and should be disclosed in the main text alongside the reported test accuracy.
- [Discussion, 'Quantification of phenotypic similarity using deep learning'] The phrase 'total visible phenotypic similarity' is used as if the embedding is a complete representation of the phenotype; given the low input resolution (64 pixels high), the fixed cropping, and the label-driven training, a more cautious phrase such as 'task-specific phenotypic distance' would better match the evidence.
Circularity Check
Central mimicry-convergence test is independent of the network's training labels; one minor result merely restates the triplet training objective.
-
self definitional
[Results – 'Quantification of phenotypic similarity'; Methods – 'Deep learning' (eqs. S1/S2)]
"The deep convolutional neural network (which we name ButterflyNet) learnt both to correctly classify images by subspecies and to calculate an internally consistent set of Euclidean distances between input images, with those of the same subspecies closer together and those of different subspecies further apart. ... statistical analyses of average pairwise Euclidean distances ... show that the most phenotypically similar butterfly images are those of the same subspecies (Kruskal-Wallis, P = 1.043 × 10⁻²⁸; ...)."
The triplet loss explicitly optimizes the embedding so that images from the same subspecies are pulled closer together than images from different subspecies. The later statistical 'finding' that within-subspecies images have the smallest Euclidean distances is therefore not an independent empirical discovery; it is a restatement of the training objective. This step is only a sanity check on the embedding and is not the basis of the paper's central mimicry-convergence claim, which compares interspecies co-mimic pairs that the training objective never used as positive pairs.
full rationale
The paper's central quantitative claims are not circular. Co-mimic labels are taken from Sheppard et al. (1985), an external source, and ButterflyNet was trained only on subspecies identity, not on mimicry labels; co-mimics are different subspecies, so the triplet loss actually pushes them apart. Their significant similarity in the learned space is thus an emergent result. The phylogenetic validation also uses independent published gene-sequence trees (Hines et al.), not the training labels. The one reduction-by-construction element is the within-subspecies clustering result, which simply reflects the triplet training objective; this does not carry the paper's main conclusions. Self-citations to Hoyal Cuthill and Charleston are used in the mutual-convergence case study to infer evolutionary polarity, but the paper includes reversed-polarity comparisons showing that mutual convergence is supported in two of three analyses, so the self-citation is not uniquely load-bearing. The weak random-tree null is a statistical-power concern, not a circularity. Overall, the derivation is largely self-contained, with only a minor self-definitional validation.
Assumptions & free parameters
free parameters (2)
- Embedding dimensionality =
64
- Network training hyperparameters =
lr 1e-4, 30000 batches, batch size 99, L2 6e-5, loss weight 0.1, height 64 px, translate 3 px
assumptions (6)
- domain assumption Subspecies labels from NHM specimen labels and Lamas (2004) are accurate and sufficient as ground truth for training and testing.
- domain assumption Euclidean distance in the 64-dimensional embedding corresponds to total visible phenotypic similarity.
- domain assumption Traditionally hypothesized co-mimic pairs from Sheppard et al. (1985) correctly identify Müllerian mimicry relationships.
- domain assumption Published gene phylogenies (Hines et al. 2011; Hoyal Cuthill and Charleston 2015) are accurate and comparable to the phenotypic trees.
- domain assumption Pairwise Euclidean distances between subspecies pairs can be treated as independent samples in Mann-Whitney tests.
- standard math Neighbor-joining and Robinson-Foulds distances provide an appropriate phylogenetic comparison.
Cite this review
Pith. "Pith review of Deep learning on butterfly phenotypes tests evolution's oldest mathematical model." pith.science (2026). https://pith.science/paper/B3PLSWTH
@misc{pith2026190805635,
  author       = {Pith},
  title        = {Pith review of: Deep learning on butterfly phenotypes tests evolution's oldest mathematical model},
  year         = {2026},
  howpublished = {\url{https://pith.science/paper/B3PLSWTH}},
  note         = {Machine review of arXiv:1908.05635}
}
abstract
Traditional anatomical analyses captured only a fraction of real phenomic information. Here, we apply deep learning to quantify total phenotypic similarity across 2468 butterfly photographs, covering 38 subspecies from the polymorphic mimicry complex of $\textit{Heliconius erato}$ and $\textit{Heliconius melpomene}$. Euclidean phenotypic distances, calculated using a deep convolutional triplet network, demonstrate significant convergence between interspecies co-mimics. This quantitatively validates a key prediction of M\"ullerian mimicry theory, evolutionary biology's oldest mathematical model. Phenotypic neighbor-joining trees are significantly correlated with wing pattern gene phylogenies, demonstrating objective, phylogenetically informative phenome capture. Comparative analyses indicate frequency-dependent, mutual convergence with coevolutionary exchange of wing pattern features. Therefore, phenotypic analysis supports reciprocal coevolution, predicted by classical mimicry theory but since disputed, and reveals mutual convergence as an intrinsic generator for the surprising diversity of M\"ullerian mimicry. This demonstrates that deep learning can generate phenomic spatial embeddings which enable quantitative tests of evolutionary hypotheses previously only testable subjectively.
Figures


Figures from the paper (2 more)


Reference graph
Works this paper leans on
-
[1]
is aScience Advances Association for the Advancement of Science
http://advances.sciencemag.org/content/5/8/eaaw4967#BIBL This article cites 29 articles, 2 of which you can access for free PERMISSIONS http://www.sciencemag.org/help/reprints-and-permissions Terms of ServiceUse of this article is subject to the registered trademark of AAAS. is aScience Advances Association for the Advancement of Science. No claim to orig...
2019
-
[4]
To test the phylogenetic informativeness of the phenotypic distances against independent data sources, sets of neighbour joining phenotypic trees (of either all subspecies, H. erato only, or H. melpomene only) were compared against phylogenies reconstructed from published gene sequences (27) as well as random tree topologies. The subspecies coverage and i...
work page 2014
Reviewed August 14, 2026 · model on record in the stance chip above.
Discussion (0). Continue with ORCID to comment.