pith. sign in

arxiv: 1906.10404 · v1 · pith:B5ESR3F5new · submitted 2019-06-25 · ❄️ cond-mat.mtrl-sci

Understanding the volume-diffusion governed shape-instabilities in metallic systems

Pith reviewed 2026-05-25 16:50 UTC · model grok-4.3

classification ❄️ cond-mat.mtrl-sci
keywords phase-field modelingmicrostructure stabilityGibbs-Thomson relationvolume diffusioncurvature-driven evolutionshape instabilitiesmetallic systems
0
0 comments X

The pith

Phase-field model recovers the Gibbs-Thomson relation for curvature-driven shape changes despite using a diffuse interface.

A machine-rendered reading of the paper's core claim, the machinery that carries it, and where it could break.

The paper applies phase-field modeling to examine how two- and three-dimensional finite structures in metals evolve under curvature when no phase transformation occurs. It first demonstrates that the model still satisfies the Gibbs-Thomson relation that links curvature to the driving force for shape change. With this check complete, the same numerical setup is used to track volume-diffusion controlled transformations. The work addresses the practical need to predict when microstructure changes will alter material properties without relying on explicit interface tracking.

Core claim

A phase-field formulation that replaces the sharp interface with a finite diffuse region through an additional scalar phase-field variable recovers the governing Gibbs-Thomson relation. The validated model is then applied to investigate volume-diffusion governed curvature-induced transformations in two- and three-dimensional finite structures.

What carries the argument

The phase-field variable, a scalar field that replaces explicit sharp-interface tracking with a diffuse transition zone.

If this is right

  • Curvature-driven shape evolution can be simulated in the absence of phase transformations.
  • The method applies equally to two-dimensional and three-dimensional finite structures.
  • Microstructure stability predictions become feasible without the computational cost of explicit interface tracking.
  • Volume diffusion as the rate-controlling mechanism can be isolated and studied separately.

Where Pith is reading between the lines

These are editorial extensions of the paper, not claims the author makes directly.

  • The same validation step could be repeated for other diffusion mechanisms to broaden the range of applicable problems.
  • Results from the 3D cases may identify instability pathways that differ qualitatively from their 2D counterparts.
  • If the recovered relation holds for more complex geometries, the approach could be used to screen candidate microstructures for long-term dimensional stability.

Load-bearing premise

The diffuse-interface phase-field formulation accurately reproduces the sharp-interface Gibbs-Thomson relation and curvature-driven evolution for the finite structures considered.

What would settle it

Direct numerical measurement showing that the chemical potential or interface velocity in the phase-field simulations deviates from the value required by the Gibbs-Thomson relation at a measured curvature.

Figures

Figures reproduced from arXiv: 1906.10404 by P G Kubendran Amos.

Figure 2.1
Figure 2.1. Figure 2.1: A schematic representation of the thermal cycle involved in inter-critical and static annealing [PITH_FULL_IMAGE:figures/full_fig_p033_2_1.png] view at source ↗
Figure 2.2
Figure 2.2. Figure 2.2: A schematic illustration of the caused approach to investigate the stability of the innitely-long [PITH_FULL_IMAGE:figures/full_fig_p035_2_2.png] view at source ↗
Figure 2.3
Figure 2.3. Figure 2.3: Morphological evolution governed by the inherent curvature di erence between the termination [PITH_FULL_IMAGE:figures/full_fig_p036_2_3.png] view at source ↗
Figure 2.4
Figure 2.4. Figure 2.4: Plate morphology assumed by the precipitate in a microstructure and its evolution to cylindrical [PITH_FULL_IMAGE:figures/full_fig_p036_2_4.png] view at source ↗
Figure 2.5
Figure 2.5. Figure 2.5: Schematic representation of fault migration wherein the discontinuous structure evolves by [PITH_FULL_IMAGE:figures/full_fig_p037_2_5.png] view at source ↗
Figure 2.6
Figure 2.6. Figure 2.6: Faulty structure forming a branch of the regular lamella and its evolution leading to the inho [PITH_FULL_IMAGE:figures/full_fig_p038_2_6.png] view at source ↗
Figure 2.7
Figure 2.7. Figure 2.7: Thermal grooving in the through-thickness boundary leading to the fragmentation of the pre [PITH_FULL_IMAGE:figures/full_fig_p039_2_7.png] view at source ↗
Figure 2.8
Figure 2.8. Figure 2.8: The shape-change in the lamellar arrangement of the phases initiated by its fragmentation [PITH_FULL_IMAGE:figures/full_fig_p041_2_8.png] view at source ↗
Figure 5.1
Figure 5.1. Figure 5.1: Schematic illustration of the free energy density vs concentration plot pertaining to a binary [PITH_FULL_IMAGE:figures/full_fig_p076_5_1.png] view at source ↗
Figure 5.2
Figure 5.2. Figure 5.2: Gibbs free-energy density dependence of austenite on carbon concentration as rendered by the [PITH_FULL_IMAGE:figures/full_fig_p077_5_2.png] view at source ↗
Figure 7.1
Figure 7.1. Figure 7.1: A representative depiction of the fault migration for a nite duration of [PITH_FULL_IMAGE:figures/full_fig_p096_7_1.png] view at source ↗
Figure 7.2
Figure 7.2. Figure 7.2: Two-dimensional domain setup considered for the simulation of the termination migration. [PITH_FULL_IMAGE:figures/full_fig_p097_7_2.png] view at source ↗
Figure 7
Figure 7. Figure 7: , the amount of the mass transferred during the interval [PITH_FULL_IMAGE:figures/full_fig_p097_7.png] view at source ↗
Figure 7.3
Figure 7.3. Figure 7.3: The morphological evolution in the lamellar precipitate accompanying the recession of the faulty [PITH_FULL_IMAGE:figures/full_fig_p099_7_3.png] view at source ↗
Figure 7
Figure 7. Figure 7: , these active regions are highlighted in red and blue. [PITH_FULL_IMAGE:figures/full_fig_p099_7.png] view at source ↗
Figure 7.4
Figure 7.4. Figure 7.4: The temporal change in the volume of the discontinuous lamellar-fault. The position of the tip [PITH_FULL_IMAGE:figures/full_fig_p100_7_4.png] view at source ↗
Figure 7
Figure 7. Figure 7: , asserts that the time taken to transfer a denite volume from the faulty to the regular [PITH_FULL_IMAGE:figures/full_fig_p100_7.png] view at source ↗
Figure 7.5
Figure 7.5. Figure 7.5: Change in the kinetics of the termination migration under the in uence of the interlamellar [PITH_FULL_IMAGE:figures/full_fig_p101_7_5.png] view at source ↗
Figure 7.6
Figure 7.6. Figure 7.6: The in uence of the spacing between the regular structures on the morphological evolution of the [PITH_FULL_IMAGE:figures/full_fig_p102_7_6.png] view at source ↗
Figure 7.7
Figure 7.7. Figure 7.7: The in uence of the interlamellar distances, [PITH_FULL_IMAGE:figures/full_fig_p102_7_7.png] view at source ↗
Figure 7.8
Figure 7.8. Figure 7.8: The migration of the three-dimensional faulty precipitate and the consequent change in the [PITH_FULL_IMAGE:figures/full_fig_p104_7_8.png] view at source ↗
Figure 7.9
Figure 7.9. Figure 7.9: The change in the volume of the three-dimensional discontinuous structure, for a given period [PITH_FULL_IMAGE:figures/full_fig_p104_7_9.png] view at source ↗
Figure 7.10
Figure 7.10. Figure 7.10: The role of the distance separating the regular structures (2 [PITH_FULL_IMAGE:figures/full_fig_p105_7_10.png] view at source ↗
Figure 2.4
Figure 2.4. Figure 2.4: This morphological evolution, referred to as the cylinderization [36], is extensively [PITH_FULL_IMAGE:figures/full_fig_p107_2_4.png] view at source ↗
Figure 8.1
Figure 8.1. Figure 8.1: The domain setup considered for the investigation of the cylinderization. The precipitate- [PITH_FULL_IMAGE:figures/full_fig_p108_8_1.png] view at source ↗
Figure 8.2
Figure 8.2. Figure 8.2: An isoline representation (φ = 0.5) of the temporal change in the morphology of the precipitate of aspect ratio 6 during curvature-driven transformation. 8.2 Cylinderization of capped ribbon-like structure 8.2.1 Morphological evolution [PITH_FULL_IMAGE:figures/full_fig_p109_8_2.png] view at source ↗
Figure 8
Figure 8. Figure 8: shows the morphological changes accompanying the cylinderization of the precipitate [PITH_FULL_IMAGE:figures/full_fig_p109_8.png] view at source ↗
Figure 8.3
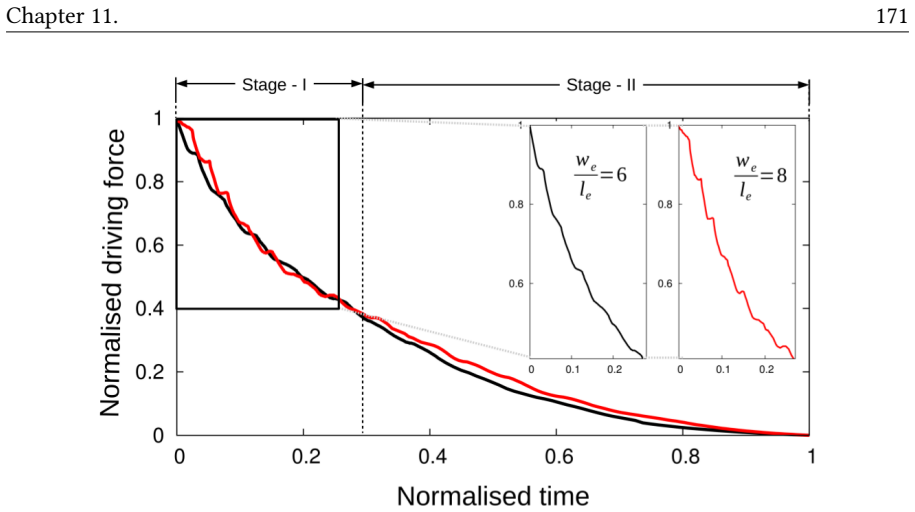
Figure 8.3. Figure 8.3: The temporal change in the driving force which governs the simulated transformation is com [PITH_FULL_IMAGE:figures/full_fig_p111_8_3.png] view at source ↗
Figure 8
Figure 8. Figure 8: , unravels that the existing theoretical treatment predicts a nearly linear decrease in [PITH_FULL_IMAGE:figures/full_fig_p111_8.png] view at source ↗
Figure 8.4
Figure 8.4. Figure 8.4: An isoline representation of the precipitate morphology at the initial (t [PITH_FULL_IMAGE:figures/full_fig_p113_8_4.png] view at source ↗
Figure 8
Figure 8. Figure 8: b shows the numerical nature of the normalised parameter [PITH_FULL_IMAGE:figures/full_fig_p116_8.png] view at source ↗
Figure 8.6
Figure 8.6. Figure 8.6: The cylinderization kinetics predicted by the simulation-aided semi-analytical treatment [PITH_FULL_IMAGE:figures/full_fig_p118_8_6.png] view at source ↗
Figure 8.7
Figure 8.7. Figure 8.7: Morphology of the faceted precipitate of aspect ratio [PITH_FULL_IMAGE:figures/full_fig_p119_8_7.png] view at source ↗
Figure 12
Figure 12. Figure 12: , the transformation time increases [PITH_FULL_IMAGE:figures/full_fig_p119_12.png] view at source ↗
Figure 8.8
Figure 8.8. Figure 8.8: Increase in the time taken for the cylinderization of the faceted structure with increase in the [PITH_FULL_IMAGE:figures/full_fig_p120_8_8.png] view at source ↗
Figure 8.9
Figure 8.9. Figure 8.9: The change in the cylinderization rate induced solely by the morphology of the terminations [PITH_FULL_IMAGE:figures/full_fig_p122_8_9.png] view at source ↗
Figure 8.10
Figure 8.10. Figure 8.10: Distribution of the chemical potential and the resulting morphological changes exhibited by [PITH_FULL_IMAGE:figures/full_fig_p123_8_10.png] view at source ↗
Figure 12
Figure 12. Figure 12: shows the simulation domain considered for the analysis of spheroidization of nite [PITH_FULL_IMAGE:figures/full_fig_p127_12.png] view at source ↗
Figure 9.2
Figure 9.2. Figure 9.2: The morphology of the precipitate of aspect ratio [PITH_FULL_IMAGE:figures/full_fig_p130_9_2.png] view at source ↗
Figure 9.3
Figure 9.3. Figure 9.3: The parameter p = rsc (a/b) r is seemingly independent of the initial size of the three-dimensional rod. As shown in [PITH_FULL_IMAGE:figures/full_fig_p133_9_3.png] view at source ↗
Figure 9.4
Figure 9.4. Figure 9.4: The transitory driving at the specic stages of the spheroidization which are calculated based [PITH_FULL_IMAGE:figures/full_fig_p134_9_4.png] view at source ↗
Figure 12.4
Figure 12.4. Figure 12.4: This illustration unravels the relation that [PITH_FULL_IMAGE:figures/full_fig_p135_12_4.png] view at source ↗
Figure 12.5
Figure 12.5. Figure 12.5: Owing to some misappropriations, the existing studies render a driving force which [PITH_FULL_IMAGE:figures/full_fig_p135_12_5.png] view at source ↗
Figure 9.5
Figure 9.5. Figure 9.5: Time taken for the spheroidization of capped rods of di erent aspect ratio is compared with the [PITH_FULL_IMAGE:figures/full_fig_p136_9_5.png] view at source ↗
Figure 9.6
Figure 9.6. Figure 9.6: Temporal evolution of the curvature (potential) di erence, [PITH_FULL_IMAGE:figures/full_fig_p137_9_6.png] view at source ↗
Figure 12.8
Figure 12.8. Figure 12.8: In the initial stages of the spheroidization, high potential is established around the termi- [PITH_FULL_IMAGE:figures/full_fig_p138_12_8.png] view at source ↗
Figure 9.7
Figure 9.7. Figure 9.7: The transformation mechanism underpinning the spheroidization of the capped rod of aspect [PITH_FULL_IMAGE:figures/full_fig_p139_9_7.png] view at source ↗
Figure 9.8
Figure 9.8. Figure 9.8: The geometrical description of the uncapped and faceted rods. The longitudinal and radial view [PITH_FULL_IMAGE:figures/full_fig_p140_9_8.png] view at source ↗
Figure 12.9
Figure 12.9. Figure 12.9: The cross-section of the rods, both longitudinal and radial, are included in this [PITH_FULL_IMAGE:figures/full_fig_p141_12_9.png] view at source ↗
Figure 9.9
Figure 9.9. Figure 9.9: The continual change in the distribution of the chemical potential and respective change in the [PITH_FULL_IMAGE:figures/full_fig_p142_9_9.png] view at source ↗
Figure 12
Figure 12. Figure 12: at [PITH_FULL_IMAGE:figures/full_fig_p142_12.png] view at source ↗
Figure 9.10
Figure 9.10. Figure 9.10: The in uence of the aspect ratio on time taken for the spheroidization of the faceted and un [PITH_FULL_IMAGE:figures/full_fig_p144_9_10.png] view at source ↗
Figure 12
Figure 12. Figure 12: shows the time taken for the spheroidization of uncapped and faceted rods of dif [PITH_FULL_IMAGE:figures/full_fig_p144_12.png] view at source ↗
Figure 12.9
Figure 12.9. Figure 12.9: Consequently, an increased amount of mass transfer is required to spheroidise the [PITH_FULL_IMAGE:figures/full_fig_p145_12_9.png] view at source ↗
Figure 9.11
Figure 9.11. Figure 9.11: The temporal evolution of the capped rod of aspect ratio 9. The spheroidization mechanism is [PITH_FULL_IMAGE:figures/full_fig_p146_9_11.png] view at source ↗
Figure 12
Figure 12. Figure 12: illustrates the morphological evolution of the capped rod of aspect ratio 9. As [PITH_FULL_IMAGE:figures/full_fig_p146_12.png] view at source ↗
Figure 9.12
Figure 9.12. Figure 9.12: Drastic change in the spheroidization rate due to the shift in the transformation mechanism [PITH_FULL_IMAGE:figures/full_fig_p148_9_12.png] view at source ↗
Figure 9.13
Figure 9.13. Figure 9.13: The spheroidization mechanism exhibited by the capped rod of aspect ratio 12, which yields a [PITH_FULL_IMAGE:figures/full_fig_p149_9_13.png] view at source ↗
Figure 9
Figure 9. Figure 9: , is due to the size of the precipitate. [PITH_FULL_IMAGE:figures/full_fig_p149_9.png] view at source ↗
Figure 9.14
Figure 9.14. Figure 9.14: The coarsening rate of the identical entities at the expense of the satellite particle during the [PITH_FULL_IMAGE:figures/full_fig_p151_9_14.png] view at source ↗
Figure 9.15
Figure 9.15. Figure 9.15: The distance between the primary spheroids which result from the spheroidization of the [PITH_FULL_IMAGE:figures/full_fig_p152_9_15.png] view at source ↗
Figure 9.16
Figure 9.16. Figure 9.16: The aspect ratio of the pear-shaped sub-structure at the moment of ovulation during the [PITH_FULL_IMAGE:figures/full_fig_p154_9_16.png] view at source ↗
Figure 9
Figure 9. Figure 9: unravels that, expect for the rods of aspect ratio 10 and 11, the aspect ratio of [PITH_FULL_IMAGE:figures/full_fig_p154_9.png] view at source ↗
Figure 9.17
Figure 9.17. Figure 9.17: Evidently, above the aspect ratio 12, the no visible change is observed in the time [PITH_FULL_IMAGE:figures/full_fig_p155_9_17.png] view at source ↗
Figure 9.17
Figure 9.17. Figure 9.17: The time taken for the primary ovulation during the transformation of the rods with di erent [PITH_FULL_IMAGE:figures/full_fig_p156_9_17.png] view at source ↗
Figure 10.1
Figure 10.1. Figure 10.1: Top- and side-view of the unidirectionally-equiaxed ‘pancake’ structure of diameter [PITH_FULL_IMAGE:figures/full_fig_p163_10_1.png] view at source ↗
Figure 10.2
Figure 10.2. Figure 10.2: A cross-sectional view of the geometrical consideration adopted to dene the precipitate struc [PITH_FULL_IMAGE:figures/full_fig_p164_10_2.png] view at source ↗
Figure 12
Figure 12. Figure 12: indicates that the precipitate, which is considered for this investigation, is a cen [PITH_FULL_IMAGE:figures/full_fig_p164_12.png] view at source ↗
Figure 10.3
Figure 10.3. Figure 10.3: Morphology of the precipitate at the initial (t [PITH_FULL_IMAGE:figures/full_fig_p167_10_3.png] view at source ↗
Figure 10.4
Figure 10.4. Figure 10.4: Aspect ratio of the ellipsoid, or specically ‘oblate spheroid’ , which are formed at the midpoint [PITH_FULL_IMAGE:figures/full_fig_p169_10_4.png] view at source ↗
Figure 10.5
Figure 10.5. Figure 10.5: The transitory driving-force at the initial, midpoint and nal stage of the globularisation [PITH_FULL_IMAGE:figures/full_fig_p172_10_5.png] view at source ↗
Figure 10.6
Figure 10.6. Figure 10.6: The time taken for the globularisation of the pancake precipitates of di erent aspect ratio in [PITH_FULL_IMAGE:figures/full_fig_p173_10_6.png] view at source ↗
Figure 10.7
Figure 10.7. Figure 10.7: A schematic representation of the temporal change in the shape of the pancake structure as [PITH_FULL_IMAGE:figures/full_fig_p175_10_7.png] view at source ↗
Figure 10.8
Figure 10.8. Figure 10.8: The change in the potential di erence, induced by the inherent disparity in the curvature, with [PITH_FULL_IMAGE:figures/full_fig_p176_10_8.png] view at source ↗
Figure 12
Figure 12. Figure 12: includes a resolved sub-plot of the change in the curvature di erence at the ini [PITH_FULL_IMAGE:figures/full_fig_p176_12.png] view at source ↗
Figure 10.9
Figure 10.9. Figure 10.9: The morphological transformation of the pancake structure of aspect ratio 6 during the stage-I [PITH_FULL_IMAGE:figures/full_fig_p177_10_9.png] view at source ↗
Figure 12.6
Figure 12.6. Figure 12.6: With time, the intensity of these peaks continually decreases and the driving force [PITH_FULL_IMAGE:figures/full_fig_p177_12_6.png] view at source ↗
Figure 12
Figure 12. Figure 12: at [PITH_FULL_IMAGE:figures/full_fig_p178_12.png] view at source ↗
Figure 10.10
Figure 10.10. Figure 10.10: The subsequent transformation following the stage-I evolution which results in the globular [PITH_FULL_IMAGE:figures/full_fig_p180_10_10.png] view at source ↗
Figure 11.1
Figure 11.1. Figure 11.1: The boundary-splitting which, through the fragmentation of the continuous precipitate along [PITH_FULL_IMAGE:figures/full_fig_p184_11_1.png] view at source ↗
Figure 11.2
Figure 11.2. Figure 11.2: The morphological conguration of a three-dimensional elliptical plate of the thickness [PITH_FULL_IMAGE:figures/full_fig_p186_11_2.png] view at source ↗
Figure 11.3
Figure 11.3. Figure 11.3: The cross-section of the parent three-dimensional ellipsoid of major-axes length [PITH_FULL_IMAGE:figures/full_fig_p187_11_3.png] view at source ↗
Figure 11.4
Figure 11.4. Figure 11.4: The temporal change in the shape of the elliptical plate of aspect ratio 6 at the three specic [PITH_FULL_IMAGE:figures/full_fig_p188_11_4.png] view at source ↗
Figure 12
Figure 12. Figure 12: extends from at surface of the precipitate to the end of the parent structure along a [PITH_FULL_IMAGE:figures/full_fig_p188_12.png] view at source ↗
Figure 11.5
Figure 11.5. Figure 11.5: The aspect ratio of the prolate ellipsoid formed at the midpoint of the transformation during [PITH_FULL_IMAGE:figures/full_fig_p194_11_5.png] view at source ↗
Figure 11.6
Figure 11.6. Figure 11.6: The instantaneous driving-force at the initial, midpoint and nal stage of the globularisation [PITH_FULL_IMAGE:figures/full_fig_p195_11_6.png] view at source ↗
Figure 11.7
Figure 11.7. Figure 11.7: The time taken for the globularisation of the elliptical plates of di erent aspect ratio in the [PITH_FULL_IMAGE:figures/full_fig_p197_11_7.png] view at source ↗
Figure 12.7
Figure 12.7. Figure 12.7: Both the simulation and analytical study show a monotonic increase in the time [PITH_FULL_IMAGE:figures/full_fig_p198_12_7.png] view at source ↗
Figure 11.8
Figure 11.8. Figure 11.8: The temporal evolution of the potential di erence which govern the shape-changes exhibited [PITH_FULL_IMAGE:figures/full_fig_p199_11_8.png] view at source ↗
Figure 11.9
Figure 11.9. Figure 11.9: The shape change exhibited by the elliptical plate of aspect ratio 6 in the stage-I of globulari [PITH_FULL_IMAGE:figures/full_fig_p200_11_9.png] view at source ↗
Figure 11.10
Figure 11.10. Figure 11.10: The transformation mechanism following the stage-I globularisation of the elliptical plate of [PITH_FULL_IMAGE:figures/full_fig_p202_11_10.png] view at source ↗
Figure 12.1
Figure 12.1. Figure 12.1: The morphological conguration of the cementite plate embedded in the ferrite matrix, with [PITH_FULL_IMAGE:figures/full_fig_p207_12_1.png] view at source ↗
Figure 12.2
Figure 12.2. Figure 12.2: It is evident that, similar to the pancake morphology, the faceted plate transforms [PITH_FULL_IMAGE:figures/full_fig_p208_12_2.png] view at source ↗
Figure 12.3
Figure 12.3. Figure 12.3: The aspect ratio of the prolate spheroid, which is formed at the midpoint of the spheroidization [PITH_FULL_IMAGE:figures/full_fig_p209_12_3.png] view at source ↗
Figure 12
Figure 12. Figure 12: indicates that, at the midpoint of the transformation, the precipitate is much closer [PITH_FULL_IMAGE:figures/full_fig_p209_12.png] view at source ↗
Figure 12
Figure 12. Figure 12: illustrates the progressive change in the shape of the precipitate of aspect ratio 15, [PITH_FULL_IMAGE:figures/full_fig_p210_12.png] view at source ↗
Figure 12.4
Figure 12.4. Figure 12.4: The monotonic increase in the time taken for the spheroidization of the cementite plate with [PITH_FULL_IMAGE:figures/full_fig_p211_12_4.png] view at source ↗
Figure 12.5
Figure 12.5. Figure 12.5: The termination-migration assisted spheroidization of cementite plate of aspect ratio [PITH_FULL_IMAGE:figures/full_fig_p212_12_5.png] view at source ↗
Figure 12.6
Figure 12.6. Figure 12.6: The transformation of a relatively-large faceted cementite plate of aspect ratio [PITH_FULL_IMAGE:figures/full_fig_p213_12_6.png] view at source ↗
Figure 12
Figure 12. Figure 12: shows the initial stages of the spheroidization of the plate with aspect ratio [PITH_FULL_IMAGE:figures/full_fig_p213_12.png] view at source ↗
Figure 12.7
Figure 12.7. Figure 12.7: The temporal evolution of the circular discontinuities accompanying the morphological trans [PITH_FULL_IMAGE:figures/full_fig_p214_12_7.png] view at source ↗
Figure 12.8
Figure 12.8. Figure 12.8: The fragmentation of the region separating the discontinuities in the cementite plate of aspect [PITH_FULL_IMAGE:figures/full_fig_p216_12_8.png] view at source ↗
Figure 12.9
Figure 12.9. Figure 12.9: The temporal change in the geometric parameter [PITH_FULL_IMAGE:figures/full_fig_p218_12_9.png] view at source ↗
Figure 12.10
Figure 12.10. Figure 12.10: Furthermore, three-dimensional representation of the transitory potential-distribution [PITH_FULL_IMAGE:figures/full_fig_p219_12_10.png] view at source ↗
Figure 12.10
Figure 12.10. Figure 12.10: The formation of the separate cementite entities through the breaking-up of the cementite [PITH_FULL_IMAGE:figures/full_fig_p220_12_10.png] view at source ↗
Figure 12.11
Figure 12.11. Figure 12.11: The morphological evolution associated with the spheroidization of the cementite plate of [PITH_FULL_IMAGE:figures/full_fig_p222_12_11.png] view at source ↗
Figure 12.12
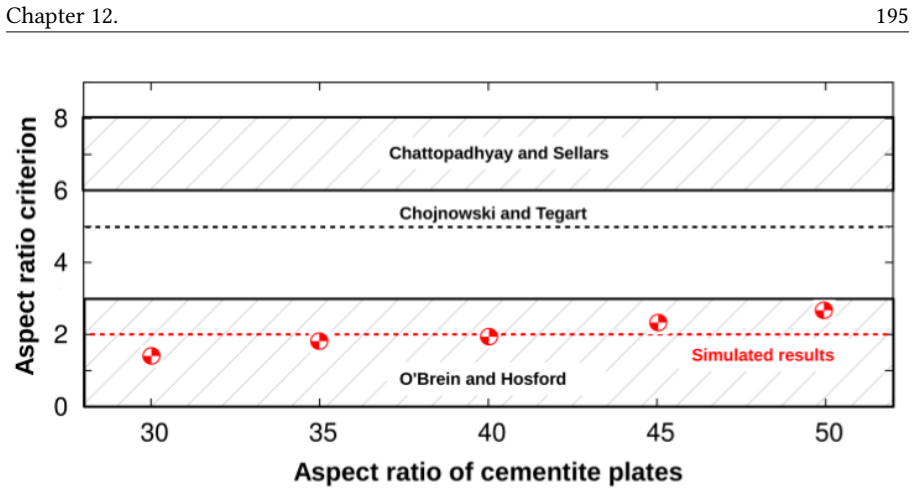
Figure 12.12. Figure 12.12: The cut-o criterion, which is adopted in the industrial heat-treatment techniques to distin [PITH_FULL_IMAGE:figures/full_fig_p223_12_12.png] view at source ↗
Figure 13.1
Figure 13.1. Figure 13.1: The outcomes of the preliminary analysis on the co-operative growth of the mutually [PITH_FULL_IMAGE:figures/full_fig_p230_13_1.png] view at source ↗
read the original abstract

The reliability of any day-to-day material is critically dictated by its properties. One factor which governs the behaviour of a material, under a given condition, is the microstructure. Despite the absence of any phase transformation, a change in the microstructure would significantly alter the properties. Therefore, a substantial understanding on the stability of the microstructure is vital to avert any unexpected catastrophic change in the material properties. In the present work, one such numerical approach called phase-field modelling in employed to analyse the stability of two- and three-dimensional finite structures, which dictate the curvature-driven evolution of the microstructure. A characteristic feature of this numerical approach is the introduction of a scalar variable, called the phase field, in addition to the other thermodynamic variables. While the inclusion of the phase field obviates the need for the interface tracking, which is a strenuous aspect of the other conventional techniques, it replaces the sharp interface with a finite diffuse region. Therefore, before adopting and extending the phase-field technique, it is shown that the model recovers the governing law, i.e, Gibbs-Thomson relation, despite the introduction of the diffuse interface. Subsequently, the numerical treatment is employed to investigate the volume-diffusion governed curvature-induced transformation.

Editorial analysis

A structured set of objections, weighed in public.

Desk editor's note, referee report, simulated authors' rebuttal, and a circularity audit. Tearing a paper down is the easy half of reading it; the pith above is the substance, this is the friction.

Referee Report

1 major / 2 minor

Summary. The manuscript develops a phase-field model to study curvature-driven shape instabilities in 2-D and 3-D finite metallic structures under volume diffusion. It first claims to demonstrate recovery of the sharp-interface Gibbs-Thomson relation despite the diffuse interface, then applies the model to investigate the resulting transformations.

Significance. If the validation step is quantitatively confirmed, the work supplies a standard but useful numerical framework for microstructure stability analysis without explicit interface tracking. The application to finite structures under volume diffusion could inform material reliability predictions, though the core methodology is already established in the phase-field literature.

major comments (1)
  1. [Abstract / model validation paragraph] Abstract and model-validation paragraph: the assertion that the phase-field formulation recovers the Gibbs-Thomson relation is central to justifying all subsequent simulations, yet no quantitative comparison (e.g., relative error versus interface width or curvature radius), tabulated data, or error analysis is referenced. Without these, the load-bearing claim that the diffuse-interface model is faithful for the examined finite structures cannot be verified.
minor comments (2)
  1. Notation for the phase-field variable and the mobility parameters should be introduced with explicit definitions before their first use in the governing equations.
  2. Figure captions for the instability simulations should state the initial geometry, domain size, and interface-width-to-curvature ratio employed.

Simulated Author's Rebuttal

1 responses · 0 unresolved

We thank the referee for their detailed review and constructive feedback. We address the single major comment below and agree that additional quantitative validation is warranted to strengthen the manuscript.

read point-by-point responses
  1. Referee: [Abstract / model validation paragraph] Abstract and model-validation paragraph: the assertion that the phase-field formulation recovers the Gibbs-Thomson relation is central to justifying all subsequent simulations, yet no quantitative comparison (e.g., relative error versus interface width or curvature radius), tabulated data, or error analysis is referenced. Without these, the load-bearing claim that the diffuse-interface model is faithful for the examined finite structures cannot be verified.

    Authors: We agree with the referee that the central claim of recovering the Gibbs-Thomson relation requires explicit quantitative support to be fully convincing. Although the manuscript states that the model recovers the relation, no error metrics, tabulated comparisons, or dependence on interface width/curvature radius were included. In the revised manuscript we will add a new subsection (or appendix) presenting quantitative validation: relative errors between the phase-field chemical potential and the sharp-interface Gibbs-Thomson prediction, plotted or tabulated versus normalized interface width and curvature radius, together with a brief error analysis. This will directly address the concern and confirm the model's fidelity for the finite structures studied. revision: yes

Circularity Check

0 steps flagged

No significant circularity; validation is independent check

full rationale

The paper's central step is a numerical validation that the diffuse-interface phase-field model recovers the known sharp-interface Gibbs-Thomson relation when the interface width is small relative to curvature radius. This is a standard, externally falsifiable consistency test for conserved-order-parameter models and does not reduce any prediction to a fitted parameter or self-referential equation. Subsequent simulations of curvature-driven instabilities under volume diffusion rest on this validated formulation without load-bearing self-citations or ansatz smuggling. The derivation chain is self-contained against external benchmarks.

Axiom & Free-Parameter Ledger

0 free parameters · 1 axioms · 0 invented entities

Abstract provides insufficient detail to enumerate specific free parameters or invented entities; the central claim rests on the standard assumption that the phase-field diffuse interface recovers sharp-interface physics.

axioms (1)
  • domain assumption Phase-field model with diffuse interface recovers the sharp-interface Gibbs-Thomson relation
    Invoked when validating the model before applying it to shape instabilities.

pith-pipeline@v0.9.0 · 5738 in / 1032 out tokens · 24164 ms · 2026-05-25T16:50:00.536494+00:00 · methodology

discussion (0)

Sign in with ORCID, Apple, or X to comment. Anyone can read and Pith papers without signing in.

Reference graph

Works this paper leans on

256 extracted references · 256 canonical work pages · 1 internal anchor

  1. [1]

    Rayleigh

    L. Rayleigh. On the instability of jets. P. LOND. MATH. SOC., 1(1):4–13, 1878

  2. [2]

    Rayleigh

    L. Rayleigh. Xvi. on the instability of a cylinder of viscous liquid under capillary force. Philos. Mag., 34(207):145–154, 1892

  3. [3]

    Rayleigh

    L. Rayleigh. Xix. on the instability of cylindrical /f_luid surfaces. Philos. Mag., 34(207):177–180, 1892

  4. [4]

    F. A. Nichols and W. W. Mullins. Morphological changes of a surface of revolution due to capillarity-induced surface diffusion. J. APPL. PHYS., 36(6):1826–1835, 1965

  5. [5]

    F. A. Nichols. On the spheroidization of rod-shaped particles of /f_inite length.J. MATER. SCI., 11(6):1077–1082, 1976

  6. [6]

    M. Qian, L. Baicheng, and L. Runqi. Thermodynamic considerations of the equilibrium shape of an in/f_initely long rod.ACTA. METALL. MATER., 42(12):4083–4086, 1994

  7. [7]

    Tian and A

    L. Tian and A. Russell. Phase /f_ield study of interfacial diffusion-driven spheroidiza- tion in a composite comprised of two mutually insoluble phases. J. CHEM. PHYS., 140(12):124706, 2014

  8. [8]

    T. H. Courtney and J. C. M. Kampe. Shape instabilities of plate-like structures—ii. anal- ysis. ACTA. METALL. MATER., 37(7):1747–1758, 1989

  9. [9]

    S. L. Semiatin, N. Stefansson, and R. D. Doherty. Prediction of the kinetics of static globularization of ti-6al-4v. METALL. MATER. TRANS. A, 36(5):1372–1376, 2005

  10. [10]

    C. H. Park, J. W. Won, J. W. Park, S. L. Semiatin, and C. S. Lee. Mechanisms and ki- netics of static spheroidization of hot-worked ti-6al-2sn-4zr-2mo-0.1 si with a lamellar microstructure. METALL. MATER. TRANS. A, 43(3):977–985, 2012

  11. [11]

    Torquato

    S. Torquato. Random heterogeneous materials: microstructure and macroscopic properties, volume 16. Springer Science & Business Media, 2013. 212 Bibliography 213

  12. [12]

    Bhadeshia and R

    H. Bhadeshia and R. Honeycombe. Steels: microstructure and properties. Butterworth- Heinemann, 2017

  13. [13]

    W. D. Callister and D. G. Rethwisch. MATER. SCI. ENG., volume 5. John Wiley & Sons NY, 2011

  14. [14]

    Perrin, B

    J. Perrin, B. Despax, V. Hanchett, and E. Kay. Microstructure and electrical conductiv- ity of plasma deposited gold//f_luorocarbon composite /f_ilms.J. VAC. SCI. TECHNOL., 4(1):46–51, 1986

  15. [15]

    Z. W. Wu, J. J. Liu, Y. Chen, and L. Meng. Microstructure, mechanical properties and electrical conductivity of cu–12 wt.% fe microcomposite annealed at different temper- atures. J. ALLOY. COMPD., 467(1-2):213–218, 2009

  16. [16]

    D. C. Jiles. The in/f_luence of size and morphology of eutectoid carbides on the magnetic properties of carbon steels. J. APPL. PHYS., 63(8):2980–2982, 1988

  17. [17]

    Qian and F

    M. Qian and F. H. Froes. Titanium powder metallurgy: science, technology and applications. Butterworth-Heinemann, 2015

  18. [18]

    H. K. D. H. Bhadeshia. Steels for bearings. PROG. MATER. SCI., 57(2):268–435, 2012

  19. [19]

    De Graef, M

    M. De Graef, M. V. Kral, and M. Hillert. A modern 3-d view of an “old” pearlite colony. JOM, 58(12):25–28, 2006

  20. [20]

    C. R. Brooks and C. R. Brooks. Heat treatment, structure and properties of nonferrous alloys, volume 4. American Society for metals Ohio, 1982

  21. [21]

    K. E. Thelning. Steel and its heat treatment. Butterworth-heinemann, 2013

  22. [22]

    Hernandez-Silva

    D. Hernandez-Silva. The spheroidization of cementite in a medium carbon steel by means of subcritical and intercritical annealing. ISIJ. INT., 32(12):1297–1305, 1992

  23. [23]

    Erişir and O

    E. Erişir and O. G. Bilir. Effect of intercritical annealing temperature on phase transfor- mations in medium carbon dual phase steels. J. MATER. ENG. PERFORM., 23(3):1055– 1061, 2014

  24. [24]

    Chen and C

    H. Chen and C. Cao. Static globularization of tc11 alloy during hot working process. RARE. METAL. MAT.ENG., 40(6):946–950, 2011

  25. [25]

    Kaspar, W

    R. Kaspar, W. Kapellner, and C. Lang. Hot deformation-enhanced globularization of pearlite. STEEL. RES., 59(11):492–498, 1988

  26. [26]

    T. V. Rajan, C. P. Sharma, and A. Sharma. Heat treatment: Principles and techniques. PHI Learning Pvt. Ltd., 2011. 214 B.2

  27. [27]

    W. Y. Guo, J. Li, and X. F. Jiang. Subcritical spheroidization of medium-carbon 50crv4 steel. J. MATER. ENG. PERFORM., 21(6):1003–1007, 2012

  28. [28]

    U. G. Gang, J. C. Lee, and W. J. Nam. Effect of prior microstructures on the behav- ior of cementite particles during subcritical annealing of medium carbon steels. MET. MATER. INT., 15(5):719, 2009

  29. [29]

    J. W. Gibbs. The collected works of J. Willard Gibbs, volume I: thermodynamics. Yale University Press, 1928

  30. [30]

    J. W. GiBBS. The Collected Works of J. Willard Gibbs, Ph. D., LLD [Vol 1-2]. London, England, Yale University Press, 1957

  31. [31]

    W. W. Mullins. Shape instabilities of plate-like struc-tures. i. experi mental observations in heavily cold worked in situcomposites. ACTA. METALL. MATER., pages 414–423, 1958

  32. [32]

    M. Ha/f_iz. Mechanical properties of sg-iron with different matrix structure.J. MATER. SCI., 36(5):1293–1300, 2001

  33. [33]

    H. E. Cline. Shape instabilities of eutectic composites at elevated temperatures. ACTA. METALL. MATER., 19(6):481–490, 1971

  34. [34]

    D. J. Srolovitz and S. A. Safran. Capillary instabilities in thin /f_ilms. i. energetics.J. APPL. PHYS., 60(1):247–254, 1986

  35. [35]

    J. D. Livingston and J. W. Cahn. Discontinuous coarsening of aligned eutectoids.ACTA. METALL. MATER., 22(4):495–503, 1974

  36. [36]

    J. C. M. Kampe, T. H. Courtney, and Y. Leng. Shape instabilities of plate-like struc- tures—i. experimental observations in heavily cold worked in situ composites. ACTA. METALL. MATER., 37(7):1735–1745, 1989

  37. [37]

    Sharma, R

    G. Sharma, R. V. Ramanujan, and G. P. Tiwari. Instability mechanisms in lamellar mi- crostructures. ACTA. MATER., 48(4):875–889, 2000

  38. [38]

    J. W. Martin, J. W. Martin, R. D. Doherty, and B. Cantor. Stability of microstructure in metallic systems. Cambridge University Press, 1997

  39. [39]

    D. T. Papageorgiou. On the breakup of viscous liquid threads. PHYS. FLUIDS., 7(7):1529–1544, 1995

  40. [40]

    A. L. Yarin and D. A. Weiss. Impact of drops on solid surfaces: self-similar capillary waves, and splashing as a new type of kinematic discontinuity. J. FLUID. MECH., 283:141–173, 1995. Bibliography 215

  41. [41]

    H. P. Le. Progress and trends in ink-jet printing technology. J. IMAGING. SCI. TECHN., 42(1):49–62, 1998

  42. [42]

    Eggers and E

    J. Eggers and E. Villermaux. Physics of liquid jets. REP. PROG. PHYS., 71(3):036601, 2008

  43. [43]

    W. W. Mullins. Flattening of a nearly plane solid surface due to capillarity. J. APPL. PHYS., 30(1):77–83, 1959

  44. [44]

    F. A. Nichols. Surface-(interface-) and volume-diffusion contributions to morphological changes driven by capillarity. Trans. AIME, 233(10):1840–1848, 1965

  45. [45]

    A. D. Brailsford and N. A. Gjostein. In/f_luence of surface energy anisotropy on mor- phological changes occurring by surface diffusion. J. APPL. PHYS., 46(6):2390–2397, 1975

  46. [46]

    M. Qian, L. Baicheng, and W. Zhaochang. Breakup of eutectic carbide network of white cast irons at high temperatures. J. MATER. SCI., 30(13):3383–3386, 1995

  47. [47]

    M. Qian. Non-linear capillary shape evolution of rod morphologies via interfacial dif- fusion. ACTA. MATER., 46(5):1669–1681, 1998

  48. [48]

    M. McLean. Microstructural instabilities in metallurgical systems—a review. MET. SCI., 12(3):113–122, 1978

  49. [49]

    H. E. Cline, J. L. Walter, E. Lifshin, and R. R. Russell. Structures, faults, and the rod-plate transition in eutectics. METALL. TRANS., 2(1):189–194, 1971

  50. [50]

    K. A. Jackson and J. D. Hunt. Lamellar and rod eutectic growth. InDynamics of Curved Fronts, pages 363–376. Elsevier, 1988

  51. [51]

    M. Hillert. Diffusion controlled growth of lamellar eutectics and eutectoids in binary and ternary systems. ACTA. METALL. MATER., 19(8):769–778, 1971

  52. [52]

    J. S. Kirkaldy and R. C. Sharma. Stability principles for lamellar eutectoid (ic) reactions. ACTA. METALL. MATER., 28(7):1009–1021, 1980

  53. [53]

    Ogris, A

    E. Ogris, A. Wahlen, H. Lüchinger, and P. J. Uggowitzer. On the silicon spheroidization in al–si alloys. J. Light. Met., 2(4):263–269, 2002

  54. [54]

    D. H. Shin, S. Y. Han, K. T. Park, Y. S. Kim, and Y. N. Paik. Spheroidization of low carbon steel processed by equal channel angular pressing. MATER. TRANS., 44(8):1630–1635, 2003. 216 B.2

  55. [55]

    Sjölander and S

    E. Sjölander and S. Seifeddine. The heat treatment of al–si–cu–mg casting alloys. J. MATER. PROCESS. TECH., 210(10):1249–1259, 2010

  56. [56]

    R. V. Ramanujan, P. J. Maziasz, and C. T. Liu. The thermal stability of the microstructure of g-based titanium aluminides. ACTA. MATER., 44(7):2611–2642, 1996

  57. [57]

    M. F. Bartholomeusz and J. A. Wert. The effect of thermal exposure on microstructural stability and creep resistance of a two-phase tial/ti 3 al lamellar alloy.METALL. MATER. TRANS. A, 25(11):2371–2381, 1994

  58. [58]

    S. I. Hong and M. A. Hill. Microstructural stability and mechanical response of cu–ag microcomposite wires. ACTA. MATER., 46(12):4111–4122, 1998

  59. [59]

    L. D. Graham and R. W. Kraft. Coarsening of eutectic microstructures at elevated tem- peratures. AIME MET. SOC. TRANS., 236(1):94–102, 1966

  60. [60]

    S. Marich. The solidi/f_ication of iron-sulphur alloys. Doctor of Philosophy thesis, University of Wollongong, 1969

  61. [61]

    Zherebtsov, M

    S. Zherebtsov, M. Murzinova, G. Salishchev, and S. L. Semiatin. Spheroidization of the lamellar microstructure in ti–6al–4v alloy during warm deformation and annealing. ACTA. MATER., 59(10):4138–4150, 2011

  62. [62]

    J. G. Wang, L. M. Hsiung, and T. G. Nieh. Microstructural instability in a crept fully lamellar tial alloy. Intermetallics, 7(7):757–763, 1999

  63. [63]

    X. G. Fan, H. Yang, S. L. Yan, P. F. Gao, and J. H. Zhou. Mechanism and kinetics of static globularization in ta15 titanium alloy with transformed structure. J. ALLOY. COMPD., 533:1–8, 2012

  64. [64]

    J. Xu, W. Zeng, Z. Jia, X. Sun, and J. Zhou. Static globularization kinetics for ti-17 alloy with initial lamellar microstructure. J. ALLOY. COMPD., 603:239–247, 2014

  65. [65]

    Y. G. Nakagawa and G. C. Weatherly. The stability of lamellar structures. METALL. TRANS., 3(12):3223–3229, 1972

  66. [66]

    M. F. X. Gigliotti, G. L. F. Powell, and G. A. Colligan. A temperature-composition zone of coupled eutectic growth in the sn- bi system. METALL. TRANS., 1(4):1038–1041, 1970

  67. [67]

    A. J. Ardell. Isotropic /f_iber coarsening in unidirectionally solidi/f_ied eutectic alloys. METALL. TRANS., 3(6):1395–1401, 1972. Bibliography 217

  68. [68]

    S. L. Semiatin and P. S. Poteet. Branch elimination during heat treatment of titanium alloys with a colony-alpha microstructure. METALL. MATER. TRANS. A, 39(11):2538– 2541, 2008

  69. [69]

    D. P. Mason, D. C. Van A, and J. F. Mans/f_ield. On the microstructure and crystallog- raphy of directionally solidi/f_ied mosi2-mo5si3 eutectics. ACTA. METALL. MATER., 43(3):1189–1199, 1995

  70. [70]

    R. M. Poths, B. P. Wynne, W. M. Rainforth, J. H. Beynon, G. Angella, and S. L. Semi- atin. Effect of strain reversal on the dynamic spheroidization of ti-6al-4v during hot deformation. METALL. MATER. TRANS. A, 35(9):2993–3001, 2004

  71. [71]

    Cabibbo, S

    M. Cabibbo, S. Zherebtsov, S. Mironov, and G. Salishchev. Loss of coherency and inter- phaseα/β angular deviation from the burgers orientation relationship in a ti–6al–4v alloy compressed at 800 c. J. MATER. SCI., 48(3):1100–1110, 2013

  72. [72]

    P. Lin, Z. He, S. Yuan, J. Shen, Y. Huang, and X. Liang. Instability of the o-phase in ti– 22al–25nb alloy during elevated-temperature deformation. J. ALLOY.COMPD., 578:96– 102, 2013

  73. [73]

    W. W. Mullins. Theory of thermal grooving. J. APPL. PHYS., 28(3):333–339, 1957

  74. [74]

    Rastegari, A

    H. Rastegari, A. Kermanpur, A. Naja/f_izadeh, D. Porter, and M. Somani. Warm deforma- tion processing maps for the plain eutectoid steels. J. ALLOY. COMPD., 626:136–144, 2015

  75. [75]

    K. X. Wang, W. D. Zeng, Y. Q. Zhao, Y. T. Shao, and Y. G. Zhou. Prediction of dynamic globularization of ti-17 titanium alloy with initial lamellar microstructure during hot compression. MAT.SCI. ENG. A-STRUCT., 527(23):6193–6199, 2010

  76. [76]

    D. F. Lupton and D. H. Warrington. The in/f_luence of deformation on the spheroidization and coarsening of pearlite. MET. SCI. Journal, 6(1):200–204, 1972

  77. [77]

    C. B. Wu, Y. He, X. G. Fan, and Z. C. Sun. Dynamic globularization kinetics during hot working of ta15 titanium alloy with colony microstructure. T. NONFERR. METAL. SOC., 21(9):1963–1969, 2011

  78. [78]

    X. Ma, W. Zeng, F. Tian, and Y. Zhou. The kinetics of dynamic globularization during hot working of a two phase titanium alloy with starting lamellar microstructure.MAT. SCI. ENG. A-STRUCT., 548:6–11, 2012

  79. [79]

    Yamaguchi, H

    M. Yamaguchi, H. Inui, and K. Ito. High-temperature structural intermetallics. ACTA. MATER., 48(1):307–322, 2000. 218 B.2

  80. [80]

    T. A. Parthasarathy, M. G. Mendiratta, and D. M. Dimiduk. Observations on the creep behavior of fully-lamellar polycrystalline tial: Identi/f_ication of critical effects.SCRIPTA. MATER., 37(3):315–321, 1997

Showing first 80 references.