REVIEW 5 major objections 5 minor 24 references
Risk Management via Anomaly Circumvent: Mnemonic Deep Learning for Midterm Stock Prediction
T0 review · 5 major / 5 minor · reviewed 2026-08-14 · deepseek-v4-flash
Pith's one-line read A hybrid deep network, Mid-LSTM, claims to sidestep market anomalies and lift midterm stock forecasts by 2–4%.
desk verdict Useful architecture idea, but the empirical evaluation is undermined by a train-on-one-step/evaluate-recursively mismatch and an inflated return claim. read the letter →
The pith
A machine-rendered reading of the paper's core claim, the machinery that carries it, and where it could break.
The reading
What carries the argument
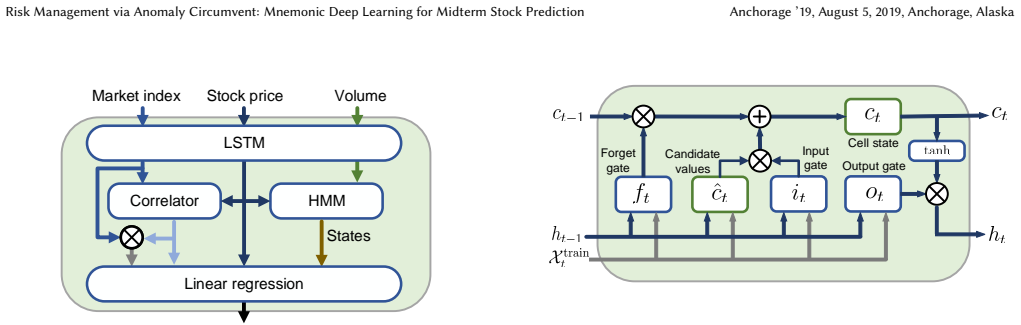
The load-bearing object is the Mid-ARMA model of equation (5), which expresses the predicted price as a weighted sum of an ARMA forecast, a CAPM-inspired market term $\rho(\lambda M_t^A + \eta)$, and a hidden-state term $\gamma S_t^A$; Mid-LSTM is the neural realization of that equation. The LSTM produces the component forecasts $X_t^A$, $M_t^A$, $V_t^A$; the HMM (with $K=4$ states corresponding to high/low volume crossed with high/low price) produces $S_t^A$; and the linear regression layer learns the scalar weights $\alpha,\eta,\lambda,\gamma,c$ by minimizing a mean-square loss over the 30–60 day prediction horizon. The mechanism's job is to let the model absorb anomalous market and volume movements into the market and hidden-state terms so they do not propagate through the recursively generated price sequence.
What would settle it
The cleanest check is a walk-forward retraining experiment: after each observed month, retrain Mid-LSTM on all data up to that point and predict the next 30–60 days; then compare the rolling mean prediction accuracy and the resulting portfolio Sharpe ratio with the fixed-split numbers reported in the paper. If the accuracy advantage over linear regression and plain LSTM shrinks to noise, or if the recursive 30–60 day predictions are no better than point-by-point forecasts that use true prices, the central claim is falsified.
Extended reading notes
Core claim
On its own terms, the paper's discovery is that a model which deliberately routes market-wide shocks away from the price path can sustain recursive multi-step forecasting. The proposed Mid-LSTM implements the Mid-ARMA equation, $\hat{X}_t = \alpha X_t^A + \lambda\rho M_t^A + \eta\rho + \gamma S_t^A + c$, where $X_t^A$ is an ARMA forecast, $M_t^A$ is an ARMA forecast of the market index, $\rho$ is the correlation between stock and market, and $S_t^A$ is a hidden-state variable extracted from the joint behavior of price and volume via a four-state HMM. The LSTM supplies $X_t^A$, $M_t^A$, and $V_t^A$; the linear regression learns the weights. The authors report that on 451 S&P 500 stocks over six testing windows, this design raises mean prediction accuracy to 0.9308 versus 0.9258 for plain LSTM and 0.9253 for linear regression, raises trend accuracy to 0.8460 (0.9200 for the 50 most market-correlated stocks), and in the second asset set yields an average annualized return of 26.51% and an average Sharpe ratio of 2.99.
Load-bearing premise
The load-bearing premise is that a network trained on one-step-ahead targets keeps producing accurate outputs when its own predictions are fed back into the window for 30 to 60 days, with no error accumulation—an assumption the paper asserts but does not test.
Editorial extensions
If this is right
- If the claim holds, value investors can use the model's 30–60 day forecasts as a risk filter: stocks highly correlated with the market get the largest accuracy benefit, so capital can be concentrated there.
- The linear-regression weights give analysts an interpretable decomposition of each price forecast into ARMA, market, and volume-hidden-state contributions, which can flag when a prediction is being driven by an anomaly.
- The trend-accuracy results imply the model is better used for directional decisions (up/down over a month) than for exact price levels, since trend accuracy reaches 0.92 for market-correlated stocks.
- Because the framework is horizon-agnostic, the same Mid-ARMA/Mid-LSTM recipe can be retargeted to other horizons by changing the window length and the number of HMM states.
Reading between the lines
- A natural test the paper leaves implicit is whether Mid-LSTM's advantage grows with the severity of market anomalies; restricting the test set to high-volatility periods (e.g., the 2018 Q4 sell-off) and comparing error growth against calm periods would directly probe the anomaly-circumvention mechanism.
- The HMM's K=4 states are fixed in advance; a variant that learns the number of states from data could reveal whether the four volume-price regimes are the right granularity or whether more states improve anomaly detection.
- The reported 120.16% annualized return comes from a single six-window testing span; averaging over many non-overlapping out-of-sample windows would tell whether the edge is systematic or period-specific.
- If the one-step LSTM actually diverges under recursive prediction, one could add a feedback-correction layer (e.g., retraining on predicted sequences) and check whether the accuracy gain persists; this is an extension the paper does not consider.
Signed reviews
Editorial analysis
A structured set of objections, weighed in public.
Referee Report
Summary. The manuscript proposes Mid-LSTM, a hybrid predictor for 30–60-day S&P 500 stock prices. It combines an ARMA-type linear structure with LSTM outputs, hidden Markov model (HMM) states relating price and volume, a CAPM-inspired market term, and a final linear regression refinement. Experiments on 451 stocks over six rolling windows report mean prediction accuracy (MPA) 0.9308 for Mid-LSTM versus 0.9258 for LSTM, trend accuracy 0.846, and portfolio backtests with average Sharpe ratios up to 2.99 and a claimed 120.16% annual return.
Significance. If substantiated, Mid-LSTM would be a practically useful midterm forecasting tool and an instructive example of injecting financial structure into recurrent forecasting. The paper has concrete strengths: it evaluates on held-out rolling windows, compares against standard baselines, reports both price accuracy and trend accuracy, and provides enough architectural detail to reimplement. However, the empirical support for the headline claims is currently weak. The main accuracy gain over LSTM is about half a percentage point with no uncertainty quantification; the headline return figure is not the annualized number in the paper's own tables; and the subset result that produces the largest gains is not matched with baseline methods on the same subset.
major comments (5)
- [§3.2.2, §4.1, Eq. (10)] The LSTM is trained one step ahead using real lagged values as inputs (training output length 1 in Section 4.1), but the midterm evaluation is a recursive full-sequence forecast in which predicted values are fed back into the window for 30–60 days. The paper itself identifies cumulative error as the main difficulty of midterm prediction, yet no closed-loop training, scheduled sampling, teacher-forcing diagnostic, or error-growth analysis is provided. All of the reported MPA, TA, and portfolio results in Tables 1–4 are produced in this recursive regime, so the central empirical claim is unsupported unless the stability of the one-step model under feedback is demonstrated.
- [Abstract, Tables 1–2] The abstract's claim of a '2–4% improvement in prediction accuracy' is not consistent with the reported numbers. Table 1 gives mean MPA 0.9308 for Mid-LSTM versus 0.9258 for LSTM, an absolute difference of 0.0050 and roughly a 0.5% relative improvement; the gain over linear regression is similar. No confidence intervals, standard errors, or repeated-seed results are reported for any MPA or TA number, so the 0.005 advantage cannot currently be distinguished from noise. The authors should state exactly which metric supports the 2–4% claim and add uncertainty quantification.
- [Abstract, Tables 3–4] The abstract's claim of 'up to 120.16% annual return' is contradicted by Table 4, where the largest annualized return for Mid-LSTM is 42.95% (R-2) and the average annualized return is 26.51%. The value 120.16 appears in Table 3 as the period cumulative return for R-6, not an annualized return. The abstract should either report the annualized figures from Table 4 or explicitly describe 120.16% as a window-specific cumulative return.
- [§4.4, Tables 1–2] The strongest accuracy results are reported for the 50-stock subset 'highly correlated with the market' (Mid-LSTM HC: MPA 0.9637, TA 0.9200), but no baseline method is evaluated on that same subset. Because the subset is selected using training-data market correlation, the comparison to full-sample baselines is not matched, and the improvement could be an artifact of selecting easier-to-predict stocks. The authors should provide linear, ridge, random forest, and LSTM results on the same 50 stocks.
- [§3.2.1, Eq. (19)] The min-max normalization in Eq. (19) appears to be computed with the minimum and maximum over the full observed series, which would use future information when normalizing training data and could leak test-period information into the model. The paper should specify whether the normalization statistics are computed on each rolling training window only, and if the current implementation uses full-sample min/max, the experiments should be rerun with causal normalization.
minor comments (5)
- [§4.1] The data description is inconsistent: the text says the sample runs from 01/02/2009 to 12/24/2018, but the stated training period starts 11/09/2007 and the figure shows 2007 dates. Please correct the date ranges.
- [§2.2, Eq. (5)] The 'CAPM-based' term in Eq. (5) is asserted rather than derived from Eq. (3); it replaces expected returns with the market index level and beta with a correlation coefficient. Since the coefficients are fitted by regression, the model may be better described as a flexible linear regression with a market interaction term rather than a CAPM-constrained model.
- [§3.2.2] The number of training iterations is fixed at 10 with no convergence criterion, validation-based early stopping, or discussion of stability across initializations. Please provide training curves or a stopping rule.
- [§3.1.2, §3.2.2] The four HMM states are predefined qualitatively (e.g., 'large trading volume, high stock price'), so it is unclear what the HMM learns. If the states are manually labeled rather than inferred, the 'hidden state' claim should be softened.
- [Figures and typography] Several typos and display artifacts need correction: 'Afterwords' should be 'Afterwards', 'The first it to use' should be 'The first is to use', and Figure 5's subplot labels are not legible in the present PDF.
Circularity Check
No significant circularity: all predictive claims are evaluated on held-out test windows, and the fitted coefficients in Eq. (5) are ordinary regression parameters rather than renamed predictions.
full rationale
The paper's derivation chain is not circular in the sense defined by the review. Equation (5) is presented as a linear model combining an ARMA-style autoregressive term, a CAPM-inspired market term, and an HMM-based hidden-state term; the coefficients alpha, lambda, eta, gamma, c are fit by linear regression to minimize the training loss in Eq. (9), and the resulting model is evaluated on held-out test windows (04/26/2017-12/24/2018) against baselines. The 2-4% MPA improvement and the portfolio returns in Tables 1-4 are therefore empirical out-of-sample measurements, not re-statements of fitted quantities. The citations to the authors' own prior work ([11], [24]) appear only as background on RNN/deep reinforcement learning methods and are not load-bearing for the Mid-LSTM construction or its evaluation. The central weakness of the paper is a correctness/validation gap rather than circularity: the LSTM is trained with one-step-ahead outputs (Section 4.1: training output length 1) while midterm evaluation uses recursive full-sequence prediction, and no closed-loop training or error-accumulation analysis is supplied. That gap undermines support for the empirical claims but does not make them true by construction, so it does not raise the circularity score.
Assumptions & free parameters
free parameters (6)
- α, λ, η, γ, c (Mid-ARMA regression weights) =
fitted on training data
- Number of HMM hidden states K =
4
- Window size N =
60
- Asset selection thresholds =
1.15 and 1.05 cumulative return
- Risk-free rate for Sharpe ratio =
1.5%
- Dropout rate and training iterations =
0.2 and 10
assumptions (5)
- standard math ARMA and CAPM formulas as given in Eqs. (1) and (3) are valid background.
- ad hoc to paper A hidden function g exists such that S_{t-i}=g(X_{t-i},V_{t-i}) (Eq. 2).
- domain assumption The market index and its correlation with a stock can reduce anomaly impact for midterm prediction.
- ad hoc to paper LSTM can remember midterm trends and circumvent anomalies.
- ad hoc to paper Four HMM states suffice to represent the hidden relationship between price and volume.
Cite this review
Pith. "Pith review of Risk Management via Anomaly Circumvent: Mnemonic Deep Learning for Midterm Stock Prediction." pith.science (2026). https://pith.science/paper/B7VAWSKD
@misc{pith2026190801112,
  author       = {Pith},
  title        = {Pith review of: Risk Management via Anomaly Circumvent: Mnemonic Deep Learning for Midterm Stock Prediction},
  year         = {2026},
  howpublished = {\url{https://pith.science/paper/B7VAWSKD}},
  note         = {Machine review of arXiv:1908.01112}
}
read the original abstract
Midterm stock price prediction is crucial for value investments in the stock market. However, most deep learning models are essentially short-term and applying them to midterm predictions encounters large cumulative errors because they cannot avoid anomalies. In this paper, we propose a novel deep neural network Mid-LSTM for midterm stock prediction, which incorporates the market trend as hidden states. First, based on the autoregressive moving average model (ARMA), a midterm ARMA is formulated by taking into consideration both hidden states and the capital asset pricing model. Then, a midterm LSTM-based deep neural network is designed, which consists of three components: LSTM, hidden Markov model and linear regression networks. The proposed Mid-LSTM can avoid anomalies to reduce large prediction errors, and has good explanatory effects on the factors affecting stock prices. Extensive experiments on S&P 500 stocks show that (i) the proposed Mid-LSTM achieves 2-4% improvement in prediction accuracy, and (ii) in portfolio allocation investment, we achieve up to 120.16% annual return and 2.99 average Sharpe ratio.
Figures


Figures from the paper (2 more)


Reference graph
Works this paper leans on
-
[1]
William H Beaver. 1968. The information content of annual earnings announce- ments. Journal of Accounting Research (1968), 67–92
work page 1968
-
[2]
George EP Box, Gwilym M Jenkins, Gregory C Reinsel, and Greta M Ljung. 2015. Time series analysis: forecasting and control . John Wiley & Sons
2015
-
[3]
Pei-Chann Chang, Chin-Yuan Fan, and Chen-Hao Liu. 2009. Integrating a piece- wise linear representation method and a neural network model for stock trading points prediction. IEEE Transactions on Systems, Man, and Cybernetics, Part C (Applications and Reviews) 39, 1 (2009), 80–92
work page 2009
-
[4]
Robert L Crouch. 1970. The volume of transactions and price changes on the New York Stock Exchange. Financial Analysts Journal 26, 4 (1970), 104–109
work page 1970
-
[5]
Xiao Ding, Yue Zhang, Ting Liu, and Junwen Duan. 2015. Deep learning for event-driven stock prediction. In Twenty-Fourth International Joint Conference on Artificial Intelligence
work page 2015
-
[6]
Felix A Gers, Nicol N Schraudolph, and Jürgen Schmidhuber. 2002. Learning precise timing with LSTM recurrent networks. Journal of Machine Learning Research 3, Aug (2002), 115–143
work page 2002
-
[7]
Reza Hafezi, Jamal Shahrabi, and Esmaeil Hadavandi. 2015. A bat-neural network multi-agent system (BNNMAS) for stock price prediction: Case study of DAX stock price. Applied Soft Computing 29 (2015), 196–210
work page 2015
-
[8]
Sepp Hochreiter and Jürgen Schmidhuber. 1997. Long short-term memory.Neural Computation 9, 8 (1997), 1735–1780
1997
Show all 24 references
-
[9]
Ken-ichi Kamijo and Tetsuji Tanigawa. 1990. Stock price pattern recognition-a recurrent neural network approach. In International Joint Conference on Neural Networks. IEEE, 215–221
1990
-
[10]
Diederik P Kingma and Jimmy Ba. 2014. Adam: A method for stochastic opti- mization. arXiv preprint arXiv:1412.6980 (2014)
2014 arXiv
-
[11]
Xinyi Li, Yinchuan Li, Yuancheng Zhan, and Xiao-Yang Liu. 2019. Optimistic Bull or Pessimistic Bear: Adaptive Deep Reinforcement Learning for Stock Portfolio Allocation. ICML Workshop on AI in Finance (2019)
2019
-
[12]
Pankaj Malhotra, Lovekesh Vig, Gautam Shroff, and Puneet Agarwal. 2015. Long short term memory networks for anomaly detection in time series. InProceedings. Presses Universitaires de Louvain, 89
2015
-
[13]
Robert C Merton. 1973. An intertemporal capital asset pricing model. Economet- rica: Journal of the Econometric Society (1973), 867–887
1973
-
[14]
David MQ Nelson, Adriano CM Pereira, and Renato A de Oliveira. 2017. Stock market’s price movement prediction with LSTM neural networks. In 2017 Inter- national Joint Conference on Neural Networks (IJCNN) . IEEE, 1419–1426
2017
-
[15]
Yao Qin, Dongjin Song, Haifeng Cheng, Wei Cheng, Guofei Jiang, and Garrison W Cottrell. 2017. A dual-stage attention-based recurrent neural network for time series prediction. In Proceedings of the 26th International Joint Conference on Artificial Intelligence. AAAI Press, 2627–2633
2017
-
[16]
Lawrence R Rabiner. 1986. An introduction to hidden Markov models. IEEE ASSP Magazine 3, 1 (1986), 4–16
1986
-
[17]
Haşim Sak, Andrew Senior, and Françoise Beaufays. 2014. Long short-term memory recurrent neural network architectures for large scale acoustic model- ing. In Fifteenth Annual Conference of the International Speech Communication association
2014
-
[18]
Sreelekshmy Selvin, R Vinayakumar, EA Gopalakrishnan, Vijay Krishna Menon, and KP Soman. 2017. Stock price prediction using LSTM, RNN and CNN-sliding window model. In 2017 International Conference on Advances in Computing, Com- munications and Informatics (ICACCI). IEEE, 1643–1647
2017
-
[19]
Kristie Seymore, Andrew McCallum, and Roni Rosenfeld. 1999. Learning hidden Markov model structure for information extraction. In AAAI-99 workshop on Machine Learning for Information Extraction . 37–42
1999
-
[20]
Ilya Sutskever, Oriol Vinyals, and Quoc V Le. 2014. Sequence to sequence learning with neural networks. InAdvances in Neural Information Processing Systems. 3104– 3112
2014
-
[21]
Frank Z Xing, Erik Cambria, and Roy E Welsch. 2018. Intelligent asset allocation via market sentiment views. IEEE Computational Intelligence Magazine 13, 4 (2018), 25–34
2018
-
[22]
Charles C Ying. 1966. Stock market prices and volumes of sales. Econometrica: Journal of the Econometric Society (1966), 676–685
1966
-
[23]
Qun Zhuge, Lingyu Xu, and Gaowei Zhang. 2017. LSTM Neural Network with Emotional Analysis for Prediction of Stock Price. Engineering Letters 25, 2 (2017)
2017
-
[24]
Practical deep reinforcement learning approach for stock trading
Xiong Zhuoran, Liu Xiao-Yang, Zhong Shan, Yang Hongyang, and Walid Anwar. Practical deep reinforcement learning approach for stock trading. In NeurIPS Workshop on Challenges and Opportunities for AI in Financial Services, 2018
2018
Reviewed August 14, 2026 · model on record in the stance chip above.
Discussion (0). Continue with ORCID to comment.